
A Statistical Analysis of Chronic Liver Disease Diagnosis with
Noninvasive Biomarkers
Pinyi Zhen
a
Department of Statistics,University of California,
Los Angeles, California, U.S.A.
Keywords: Biomarker, HCV, Fibrosis, Cirrhosis, Multinomial Logistics Regression, LASSO, Ridge Regression.
Abstract: Chronic hepatitis C virus infection (CHC) can cause life-threatening liver diseases such as cirrhosis and
fibrosis. This study aims to investigate how noninvasive serum biomarkers can aid in CHC infected liver
disease diagnosis. Previous studies have researched various combinations of serum biomarkers. This study
examines the diagnosing effect of a different combination of serum biomarkers on CHC patients. A
multinomial logistics regression model is employed to make a secondary analysis of the HCV dataset. We use
LASSO, stepwise regression, and ridge regression for model selection. Average accuracy, sensitivity,
precision, and specificity are calculated to evaluate model performance. Our statistical analysis resulted in
high accuracy and specificity. The average accuracy and sensitivity for predicting cirrhosis have both achieved
99%. The average specificity for predicting fibrosis has attained 95%. Our statistical analysis result implicates
that future research on CHC diagnosis can analyze different combinations of serum biomarkers or even
genetic markers.
1 INTRODUCTION
The hepatitis C virus (HCV) was discovered by Nobel
Prize winning researchers Harvey J. Alter, Michael
Houghton, and Charles M. Rice (Masucci, Hedestam
2020). Alter, Houghton, and Rice also determined
HCV to be caused by an RNA virus from the
Flavivirus family (Masucci, Hedestam 2020). HCV
can cause both long-term and short-term liver disease,
but more than half of the infected patients will suffer
from chronic infection of HCV (Centers for Disease
Control and Prevention 2020). According to
American Centers for Disease Control and Prevention
(CDC), chronic hepatitis C can pose severe and life-
threatening health problems like fibrosis and cirrhosis
(Centers for Disease Control and Prevention 2020).
Liver fibrosis is caused by wounded tissue healing in
response to HCV inflicted damage and is
characterized by the excessive accumulation of
extracellular matrix (ECM) proteins (Khatun and Ray
2019). HCV is an infectious virus and there are
currently no vaccines for hepatitis C virus (Centers for
Disease Control and Prevention 2020). Thus, it is
imperative to investigate accurate and specific
a
https://orcid.org/0000-0002-7642-6820
biomarker predictors of CHC infection stage.
Although liver biopsy is considered the gold standard
for diagnosing CHC infected liver disease, some
research focused on alternative diagnosing methods
using noninvasive serum biomarkers (Pár, Vincze and
Pár 2015, Sebastiani, Gkouvatsos and Pantopoulos
2014, Shahid, Idrees, Nasir, Raja, Raza, Amin, Rasul
and Tayyab 2014, Valva, Ríos, Matteo and Preciado
2016). With more patient-friendly and noninvasive
avenues to diagnose CHC infection stage, effective
treatment can be applied to cure patients quickly
(Centers for Disease Control and Prevention 2020)
without excessive pain.
Previous studies applied various statistical models
and machine learning methods to research diagnosing
effect of serum biomarkers (López, Manzano, et al.
2020, Forns, Ampurdanès, Llovet, Aponte, Quintó, et
al. 2002, Hoffmann, Bietenbeck, Lichtinghagen and
Frank Klawonn 2018, Peschel, Grimm, Gülow,
Müller, Buechler and Weigand 2020, Staufer,
Dengler, et al. 2017, Syafa’ah, Zulfatman, Pakaya and
Lestandy 2021, Valva, Casciato, Carrasco, Gadano, et
al. 2011). An early study published in 2002 utilized a
multiple logistics regression model to predict CHC
76
Zhen, P.
A Statistical Analysis of Chronic Liver Disease Diagnosis with Noninvasive Biomarkers.
DOI: 10.5220/0011231300003438
In Proceedings of the 1st International Conference on Health Big Data and Intelligent Healthcare (ICHIH 2022), pages 76-82
ISBN: 978-989-758-596-8
Copyright
c
2022 by SCITEPRESS – Science and Technology Publications, Lda. All rights reserved

infected liver fibrosis (Forns, Ampurdanès, Llovet,
Aponte, Quintó, et al. 2002,). This study has identified
age, gamma-glutamyl transpeptidase (GGT),
cholesterol, platelet count, and prothrombin time as
important predictors of fibrosis (Forns, Ampurdanès,
Llovet, Aponte, Quintó, et al. 2002,). However, the
predictive accuracy was relatively low (0.66) in the
validation set, and the study did not include p-values
in the final multivariate model (Forns, Ampurdanès,
Llovet, Aponte, Quintó, et al. 2002,). Other
biomarkers like albumin (ALB) (Staufer, Dengler, et
al. 2017), chemerin (CHE) (Peschel, Grimm, Gülow,
Müller, Buechler and Weigand 2020), HA, PIIINP,
and TGF-ß1 (Valva, Casciato, Carrasco, Gadano, et
al. 2011) have all been identified as relatively accurate
predictors of CHC infected liver disease stage.
Effective CHC liver disease stage predicting indexes
such as AST to platelet ratio index (APRI), WFA-
M2BP, and ELF score have also been studied
individually or together as covariates (Fujita, Kuroda,
Morishita, Oura, Tadokoro, Nomura, Yoneyama, et
al. 2018, Wai, Greenson, Fontana, Kalbfleisch,
Marrero, Conjeevaram, and Lok 2003). Some studies
explored machine learning methods other than
logistics regression (Hoffmann, Bietenbeck,
Lichtinghagen and Frank Klawonn 2018, Syafa’ah,
Zulfatman, Pakaya and Lestandy 2021). The original
paper (Hoffmann, Bietenbeck, Lichtinghagen and
Frank Klawonn 2018) used ctree and rpart algorithm
on a subset of the HCV dataset biomarkers
(Lichtinghagen, Klawonn and Hoffmann), but the
highest accuracy did not exceed 80%. Another paper
used naïve Bayes classifier, neural network, and
random forest (Syafa’ah, Zulfatman, Pakaya and
Lestandy 2021) to model all biomarkers in the HCV
dataset (Lichtinghagen, Klawonn and Hoffmann).
The predictive accuracy using neural network
achieved as high as 95.12% (Syafa’ah, Zulfatman,
Pakaya and Lestandy 2021). Our study uses
multinomial logistics regression to analyze the HCV
dataset (Lichtinghagen, Klawonn and Hoffmann) and
evaluates its performance on predicting CHC infected
liver disease stage. The paper is organized in the
following order: introduction to our data source,
elucidation of research variables, explanation of the
statistical method, statistical analysis result,
limitations, and conclusions.
2 DATA SOURCE
The dataset used in this paper is obtained from UCI
Machine Learning Repository, a free machine
learning database established in 2019 (Dua and
Graff). UCI Machine Learning Repository (Dua and
Graff) offers many high-quality datasets that can be
used for academic research. The HCV dataset
contains 615 samples and 14 variables: CHC
infection stage (Category), age, sex, albumin level
(ALB), alkaline phosphatase level (ALP), alanine
aminotransferase level (ALT), aspartate
aminotransferase level (AST), bilirubin level (BIL),
serum cholinesterase level (CHE), cholesterol level
(CHOL), creatinine level (CREA), gamma-glutamyl
transferase level (GGT), and overall protein level
(PROT). This HCV dataset was originally used in a
study by Hoffmann, Bietenbeck, Lichtinghagen, and
Klawonn (Hoffmann, Bietenbeck, Lichtinghagen and
Frank Klawonn 2018).
3 RESEARCH VARIABLES
The response variable is CHC infection stage
(Category), a categorical variable indicating diagnosis
result of CHC infected liver disease. The 12
covariates used in this study are listed in Table 1.
Table 1: Variables Explained.
Variable Meaning Type Range
Category CHC infected liver disease stage
Categorical
0=Blood Donors,
1=Hepatitis,
2=Fibrosis,
3=Cirrhosis
Sex Gende
r
Female, Male
Age Samples’ Age
[23.0, 77.0]
ALB Albumin level [23.0, 82.2]
ALP Alkaline
p
hos
p
hatase level [11.3, 416.6]
ALT Alanine aminotransferase level [0.9, 118.1]
AST Aspartate aminotransferase level [12.0, 324.0]
BIL Bilirubin level [1.8, 209.0]
A Statistical Analysis of Chronic Liver Disease Diagnosis with Noninvasive Biomarkers
77
CHE Serum cholinesterase level
Numerical
[1.42, 16.41]
CHOL Cholesterol level [1.43, 9.67]
CREA Creatinine level [8.0, 1079.1]
GGT Gamma-glutamyl transferase
level
[4.5, 650.9]
PROT Overall protein level [51.0, 86.5]
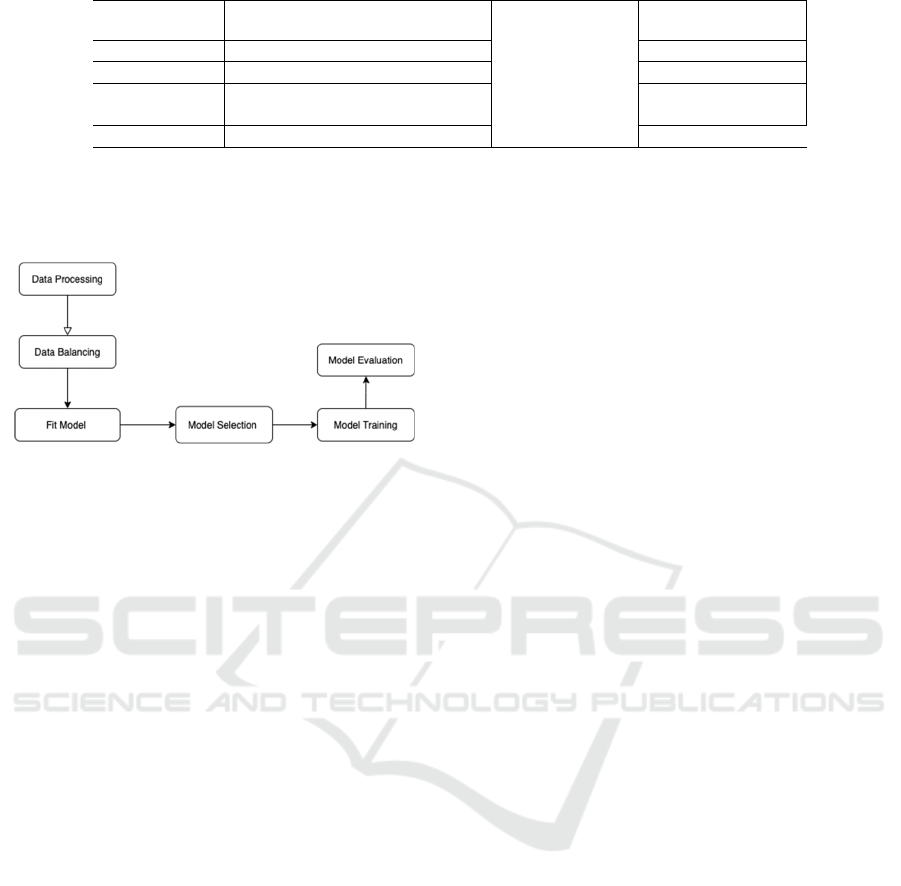
4 STATISTICAL METHOD
Figure 1: Implementation of statistical analysis.
First, we processed our dataset before statistical
analysis. The dataset initially consists of 615
observations. We removed the NAs and the patient
ID indicator column. There are 589 observations left
after removing the NAs. There are originally five
categories in the response variable: 0=Blood Donor,
0s=suspect Blood Donor, 1=Hepatitis, 2=Fibrosis,
and 3=Cirrhosis. The category “0=Blood Donor”
means healthy samples that are not diagnosed with
CHC infected liver disease. The category
“0s=suspect Blood Donor” indicates it is
undetermined whether the sample contracted CHC
infected liver disease or not. The other three
categories represent different diagnosis stages of
CHC infected liver disease. “1=Hepatitis” is the least
severe of the three categories, and “3=Cirrhosis” is
the most severe. We removed observations classified
as “0s=suspect Blood Donor” because our research
interest focuses on predicting diseased versus healthy
samples.
After processing the data, we performed
exploratory data analysis. The dataset was initially
very imbalanced. About 90.3% of the samples are
classified as “0=Blood Donor” (non-diseased
samples). About 3.4% of the samples are classified as
“1=Hepatitis”. About 2.1% of the samples are
classified as “2=Fibrosis”. About 4.1% of the
samples are classified as “3=Cirrhosis”. To balance
the data, we randomly replicated examples with
replacement so that each category (“0=Blood
Donor”, “1=Hepatitis”, “2=Fibrosis”, “3=Cirrhosis”)
in the response variable contains the same number of
samples. After we balanced the data, there are 1432
samples in total and 526 samples for each of the four
categories in the response variable, CHC infected
liver disease stage. We computed the range for all
numerical variables and summarized them in Table 1.
A multinomial logistics regression model was fit
using variables listed in Table 1. Some previous
studies also used the multinomial logistics regression
model, but they used different combinations of
biomarkers or liver disease indexes other than this
study. First, the data was modeled using the entire
balanced dataset without training. The corresponding
regression coefficients and p-values were calculated
to exclude non-significant variables from the model.
We used a significance level of α = 0.05. After that,
we performed forward, backward and bidirectional
model selection to fine-tune our model. LASSO and
cross-validation were implemented to eliminate
unimportant variables. We fitted a multinomial
logistics regression model with all selected variables.
We randomly partitioned the samples into training
and testing sets 100 times to estimate the average
model performance. We computed mean accuracy,
mean recall sensitivity, mean precision, and mean
specificity. The corresponding standard deviations of
the model accuracy, recall sensitivity, precision, and
specificity are also calculated after 100 iterations. In
addition, we also performed multinomial logistics
regression with L2 penalty (ridge regression). The
dataset was again randomly split into training versus
validation sets 100 times. Corresponding statistics for
ridge regression performance are also computed.
Mean accuracy, recall sensitivity, precision, and
specificity are calculated. The standard deviations of
model accuracy, recall sensitivity, precision, and
specificity are computed. All data analysis in this
study was done using software R version 4.1.0
(https://cran.r-project.org/).
5 RESULT
Multinomial logistics regression was employed to
make a statistical analysis of the relationship between
age, sex, albumin level (ALB), alkaline phosphatase
ICHIH 2022 - International Conference on Health Big Data and Intelligent Healthcare
78

level (ALP), alanine aminotransferase level (ALT),
aspartate aminotransferase level (AST), bilirubin
level (BIL), serum cholinesterase level (CHE),
cholesterol level (CHOL), creatinine level (CREA),
gamma-glutamyl transferase level (GGT), overall
protein level (PROT) and the response variable CHC
infected liver disease stage. It can be found that if all
other predictor variables are held constant, the odds
of “1=Hepatitis” occurring decreased by 1.05 (95%
CI [-1.28, -0.824]) for a one-unit increase in ALP.
The odds of “2=Fibrosis” occurring decreased by
0.994 (95% CI [-1.22, -0.768]) for a one-unit increase
in ALP. The odds of “3=Cirrhosis” occurring
decreased by 0.349 (95% CI [-0.48, -0.218]) for a
one-unit increase in ALP. It was found that if all other
predictor variables are held constant, the odds of
“1=Hepatitis” occurring increased by 0.218 (95% CI
[0.172, 0.265]) for a one-unit increase in AST. The
odds of “2=Fibrosis” occurring increased by 0.236
(95% CI [0.189, 0.283]) for a one-unit increase in
AST. The odds of “3=Cirrhosis” occurring increased
by 0.201 (95% CI [0.143, 0.259]) for a one-unit
increase in AST. It was also found that if all other
predictor variables are held constant, the odds of
“1=Hepatitis” occurring increased by 0.747 (95% CI
[0.502, 0.993]) for a one-unit increase in BIL. The
odds of “2=Fibrosis” occurring increased by 0.669
(95% CI [0.424, 0.913]) for a one-unit increase in
BIL. The odds of “3=Cirrhosis” occurring increased
by 0.449 (95% CI [0.137, 0.76]) for a one-unit
increase in BIL. It was also found that if all other
predictor variables are held constant, the odds of
“1=Hepatitis” occurring increased by 2.43 (95% CI
[0.317, 4.55]) for a one-unit increase in CHE. The
odds of “2=Fibrosis” occurring increased by 2.31
(95% CI [0.193, 4.42]) for a one-unit increase in
CHE. The odds of “3=Cirrhosis” occurring decreased
by 7.95 (95% CI [-10.6, -5.26]) for a one-unit
increase in CHE. It was shown that, if all other
predictor variables are held constant, the odds of
“1=Hepatitis” occurring decreased by 4.52 (95% CI
[-6.72, -2.32]) for a one-unit increase in CHOL. The
odds of “2=Fibrosis” occurring decreased by 4.91
(95% CI [-7.11, -2.72]) for a one-unit increase in
CHOL. The odds of “3=Cirrhosis” occurring
decreased by 2.66 (95% CI [-4.33, -0.99]) for a one-
unit increase in CHOL.
Table 2 summarizes our model performance
calculated using fully balanced data before we train
the model. The accuracy and specificity of the model
are consistently high across all four categories.
Table 5 and 6 (see the following pages) present
the regression coefficients of selected variables and
their corresponding p-values. Variables of interest,
ALB, ALP, AST, BIL, CHE, CHOL, GGT, and
PROT, are significant (p < 0.05) for all 3 stages of
CHC infected liver disease. Variable CREA is only
significant for “3=Cirrhosis”. Variable ALT is only
significant for “1=Hepatitis” and “2=Fibrosis”.
Table 2. Model performance using full data.
Accurac
y
Sensitivit
y
Precisio
n
Specificit
y
0=Blood
Donor
0.998 1.000 0.992 0.998
1=Hepatiti
s
0.915 0.847 0.808 0.937
2=Fibrosis 0.915 0.814 0.856 0.951
3=Cirrhosi
s
0.999 0.998 1.000 1.000
We implemented backward stepwise model
selection, forward stepwise model selection, and
bidirectional model selection. No variables were
eliminated. The cross-validation result from LASSO
did not indicate a single variable to be unimportant
for all four categories of the response variable, but
LASSO ruled out variable CREA for “0=Blood
Donors” and “1=Hepatitis”. No variables were
eliminated.
We randomly partitioned the data 100 times into
training and validation sets to improve model
performance. Table 3 lists the mean and standard
deviation of our final model performance after
training. The standard deviations are consistently
small for all entries. The average model performance
statistics are consistently high across all four
categories of CHC infected liver disease stage.
However, the average accuracy, sensitivity,
precision, and specificity computed for the testing set
are not significantly different from the performance
of the initial untrained model.
Table 3. Model performance in the testing set (no L2
penalty).
Accuracy Sensitivity Precision Specificity
Mean
(SD)
Mean
(SD)
Mean
(SD)
Mean
(SD)
0=Blood
Donor
0.996
(0.00317)
1.00
(0)
0.984
(0.0127)
0.995
(0.00420)
1=Hepatitis 0.915
(0.0129)
0.844
(0.030)
0.807
(0.0429)
0.937
(0.0145)
2=Fibrosis 0.914
(0.0127)
0.813
(0.0382)
0.856
(0.0283)
0.951
(0.0103)
3=Cirrhosis 0.999
(0.00213)
0.994
(0.00837)
1.00
(0)
1.00
(0)
Finally, we added an L2 penalty to fit a ridge
multinomial logistics regression. The average ridge
model performance is summarized in Table 4 below.
The standard deviations of the accuracy, sensitivity,
precision, and specificity after 100 iterations are very
A Statistical Analysis of Chronic Liver Disease Diagnosis with Noninvasive Biomarkers
79

similar to those calculated without adding an L2
penalty. However, it seems that model precision and
sensitivity have drastically declined for predicting
“1=Hepatitis” and “2=Fibrosis”, decreasing from
over 90% to less than 70%. We also observed a slight
decline in model accuracy and specificity across all
four categories in the response variable. The
multinomial logistics regression model without L2
penalty has higher accuracy and specificity in terms
of model performance. Nevertheless, adding an L2
penalty may address the potential problem of
overfitting. Since we randomly replicated samples to
account for the imbalanced sample distribution in the
response variable, there might be potential issue of
overfitting.
Table 4. Model performance in the testing set (with L2
penalty).
Accurac
y
Sensitivit
y
Precision S
p
ecificit
y
Mean
(
SD
)
Mean
(
SD
)
Mean
(
SD
)
Mean
(
SD
)
0=Blood
Dono
r
0.975
(
0.0179
)
0.927
(
0.0558
)
0.981
(
0.0105
)
0.993
(
0.0036
)
1=Hepatitis 0.826
(
0.02
)
0.655
(
0.0453
)
0.64
(
0.0509
)
0.881
(
0.0179
)
2=Fibrosis 0.839
(
0.0198
)
0.691
(
0.0408
)
0.646
(
0.0648
)
0.885
(
0.0217
)
3=Cirrhosis 0.975
(0.00621)
0.939
(0.0178)
0.965
(0.0148)
0.988
(0.00513)
Table 5: Coefficients and p-values of hepatitis and fibrosis.
He
p
atitis Fibrosis
Variable Coefficient p-value Coefficie
nt
p-value
A
g
e -0.013 0.82 0.11 0.058
Sex
(
male
)
-6.4
< 2.2 × 10
-16
-6.0
< 2.2 × 10
-16
ALB 0.73 0.029 0.72 0.031
ALP -1.1
< 2.2 × 10
-16
-0.99
< 2.2 × 10
-16
ALT -0.56
1.3 ×
10
-13
-0.56
1.3 × 10
-13
AST 0.22
< 2.2 × 10
-16
0.24
< 2.2 × 10
-16
BIL 0.75
2.5 × 10
-9
0.67
8.2 × 10
-8
CHE 2.4 0.024 2.3 0.032
CHOL -4.5
5.7 × 10
-5
-4.9
1.2 × 10
-5
CREA -0.059 0.41 -0.099 0.17
GGT 0.30
6.4 ×
10
-15
0.28
3.0 × 10
-13
PROT 1.2
4.2 × 10
-9
1.2
5.6 × 10
-9
Table 6: Coefficients and p-values of cirrhosis.
Cirrhosis
Variable Coefficient p-value
Age 0.54 0.056
Sex (male) -8.2
< 2.2 × 10
-16
ALB -1.6 0.012
ALP -0.35
1.7 × 10
-7
ALT -1.1 0.051
AST 0.20
1.4 × 10
-11
BIL 0.45
4.7 × 10
-3
CHE -7.9
7.1 × 10
-9
CHOL -2.7
1.8 × 10
-3
CREA 0.13
1.4 × 10
-4
GGT 0.18
3.0 × 10
-6
PROT 1.9
7.5 × 10
-7
6 DISCUSSIONS
Our study supports the hypothesis that the biomarkers
listed in Table 1 are significantly associated with
CHC infected liver disease stages. Our multinomial
logistics regression model included 10 biomarkers to
predict CHC infected liver disease stage. The
statistical analysis result is highly accurate, sensitive,
precise, and specific (see Table 4). Future research
can test such combinations for more accurate and
specific diagnosing of CHC infected liver disease
stages.
However, our study has the following limitations.
First, it is conducted from the point of view of
statistical analysis. Hence, it requires further reviews
from professionals in medical fields, especially
clinical fields. Second, the dataset used in our study
includes relatively limited patient characteristics. The
dataset only has information on patients’ age and
gender. Other key biochemical markers for detecting
CHC infected liver disease may also be lacking in this
dataset. Third, despite the good predictive
performance of our final multinomial logistics model,
there might be potential overfitting issues. We
randomly replicated samples with replacement to
ensure that all four categories in the response variable
ICHIH 2022 - International Conference on Health Big Data and Intelligent Healthcare
80

(CHC infected liver disease stage) contain the same
number of samples. Other limitations may include
further investigations of pesky points (e.g., outliers,
high leverage points) and collinearity issues.
Although there do not seem to be many collinearity
issues between covariates, it is worth noting that three
pairs of covariates have a high Pearson correlation.
Specifically, the Pearson correlation is 0.69 between
CHE and ALB, 0.63 between GGT and ALP, and -
0.54 for CHE and BIL.
7 CONCLUSIONS
In summary, this paper researched how noninvasive
serum biomarkers can improve the diagnosis of
chronic hepatitis C virus infected liver disease. We
addressed the research question by fitting an accurate
and specific multinomial logistics regression on the
HCV dataset. With enhanced diagnosis efficiency,
the effect of treatment could be significantly
augmented, and more lives could be saved.
Future research can explore the diagnosis effect
of other combinations of non-invasive serum
biomarkers. Besides, future research can also
investigate the influence of genetic factors in
diagnosing CHC infected liver disease. Furthermore,
key clinical features other than age and gender can
also be incorporated as covariates in the statistical
analysis so that more comprehensive clinical
applications could be developed.
REFERENCES
Alajos Pár, Áron Vincze and Gabriella Pár (2015). Non-
Invasive Diagnostic Methods of Fibrosis in Chronic
Hepatitis C Virus Infection: Their Role in Treatment
Indication, Follow-up and Assessment of Prognosis.
Orvosi Hetilap, 156(21), 855-861.
Centers for Disease Control and Prevention, Hepatitis C -
Faqs, Statistics, Data, & Guidelines,
https://www.cdc.gov/hepatitis/hcv/index.htm.
Chun-Tao Wai, Joel K. Greenson, Robert J. Fontana, John
D. Kalbfleisch, Jorge A. Marrero, Hari S. Conjeevaram,
and Anna S.-F. Lok (2003). A Simple Noninvasive
Index Can Predict Both Significant Fibrosis and
Cirrhosis in Patients with Chronic Hepatitis C.
Hepatology, 38(2), 518–526.
D. Dua and C. Graff, UCI Machine Learning Repository,
http://archive.ics.uci.edu/ml/index.php.
Giada Sebastiani, Konstantinos Gkouvatsos, and Kostas
Pantopoulos (2014). Chronic Hepatitis C and Liver
Fibrosis. World Journal of Gastroenterology, 20(32),
11033–11053.
Georg Hoffmann, Andreas Bietenbeck, Ralf
Lichtinghagen, and Frank Klawonn (2018). Using
Machine Learning Techniques to Generate Laboratory
Diagnostic Pathways—A Case Study. Journal of
Laboratory and Precision Medicine, 3(6), 58-67.
Georg Peschel, Jonathan Grimm, Karsten Gülow, Martina
Müller, Christa Buechler, and Kilian Weigand (2020).
Chemerin Is a Valuable Biomarker in Patients with
HCV Infection and Correlates with Liver Injury.
Diagnostics, 10(11).
Katharina Staufer, Mirko Dengler, Heidemarie Huber,
Rodrig Marculescu, Rudolf Stauber, Carolin Lackner,
Hans-Peter Dienes, et al. (2017). The Non-Invasive
Serum Biomarker Soluble AXL Accurately Detects
Advanced Liver Fibrosis and Cirrhosis. Cell Death &
Disease, 8(10), 1-10.
Koji Fujita, Noriyuki Kuroda, Asahiro Morishita, Kyoko
Oura, Tomoko Tadokoro, Takako Nomura, Hirohito
Yoneyama, et al. (2018). Fibrosis Staging Using Direct
Serum Biomarkers Is Influenced by Hepatitis Activity
Grading in Hepatitis C Virus Infection. Journal of
Clinical Medicine, 7(9), 1-13.
Lailis Syafa’ah, Zulfatman Zulfatman, Ilham Pakaya, and
Merinda Lestandy (2021). Comparison of Machine
Learning Classification Methods in Hepatitis C Virus.
Jurnal Online Informatika, 6(1), 73-78.
Maria. Grazia. Masucci and Gunilla. Karlsson. Hedestam,
Scientific Background: The Discovery of Hepatitis C
Virus, https://www.nobelprizemedicine.org/wp-
content/uploads/2020/10/advanced-
medicineprize2020-2.pdf.
Mousumi Khatun and Ratna Ray (2019). Mechanisms
Underlying Hepatitis C Virus-Associated Hepatic
Fibrosis. Cells, 8(10).
Muhammad Shahid, Muhammad Idrees, Bilal Nasir,
Arsalan Raja, Syed Raza, Iram Amin, Afza Rasul, and
Ghias Tayyab (2014). Correlation of Biochemical
Markers and HCV RNA Titers with Fibrosis Stages and
Grades in Chronic HCV-3A Patients. European Journal
of Gastroenterology & Hepatology, 26(7), 788–794.
Pamela Valva, Daniela Ríos, Elena De Matteo, and Maria
Preciado (2016). Chronic Hepatitis C Virus Infection:
Serum Biomarkers in Predicting Liver Damage. World
Journal of Gastroenterology, 22(4), 1367–1381.
Pamela Valva, Paola Casciato, Juan M. Diaz Carrasco,
Adrian Gadano, Omar Galdame, María Cristina
Galoppo, Eduardo Mullen, Elena De Matteo, and María
Victoria Preciado (2011). The Role of Serum
Biomarkers in Predicting Fibrosis Progression in
Pediatric and Adult Hepatitis C Virus Chronic
Infection. PLOS ONE, 6(8), 1-10.
Ralf. Lichtinghagen, Frank. Klawonn and Georg.
Hoffmann, HCV Data Data Set,
https://archive.ics.uci.edu/ml/datasets/HCV+data.
Sonia Alonso López, María Luisa Manzano, Francisco
Gea, María Luisa Gutiérrez, Adriana Maria Ahumada,
María José Devesa, Antonio Olveira, et al. (2020). A
Model Based on Noninvasive Markers Predicts Very
Low Hepatocellular Carcinoma Risk after Viral
A Statistical Analysis of Chronic Liver Disease Diagnosis with Noninvasive Biomarkers
81

Response in Hepatitis C Virus–Advanced Fibrosis.
Hepatology, 72(6), 1924–1934.
Xavier Forns, Sergi Ampurdanès, Josep M. Llovet, John
Aponte, Llorenç Quintó, Eva Martínez-Bauer, Miquel
Bruguera, Jose Maria Sánchez-Tapias, and Juan Rodés
(2002). Identification of Chronic Hepatitis C Patients
without Hepatic Fibrosis by a Simple Predictive Model.
Hepatology, 36(4), 986–992.
ICHIH 2022 - International Conference on Health Big Data and Intelligent Healthcare
82
