
Spatiotemporal Dynamic Evolution of Population and Economy in
Chongqing
LiYun Su
1,a
, MingLiang Yin
1,b
and FengLan Li
2,c
1
College of Science, Chongqing University of Technology, Chongqing, China
2
Library, Chongqing University of Technology, Chongqing, China
Keywords: Population Distribution, Economic Layout, Gravity Shift, Spatial Autocorrelation.
Abstract: Population change and economic development are closely related and interact. The coordinated development
of population and economy has increasingly become a hot topic in modern society. Based on the data of
resident population and GDP of 38 districts and counties in Chongqing from 2010 to 2019, this paper uses
ArcGIS and GeoDa, adopts gravity center method, geographic concentration, inconsistency index, spatial
autocorrelation and other research methods to systematically analyze the change of gravity center of
population and economy in Chongqing, the spatial distribution and agglomeration degree of population and
economy, the coordinated development of population and economy, and the spatial correlation of population
and economy. The results show that: (1) Chongqing's population and economic center of gravity show signs
of migration to the main urban area of Chongqing; (2)The geographical concentration of population and
economy shows that the population and economy of Chongqing are mainly concentrated in the main urban
area and its surrounding counties; (3) The inconsistency index between population and economy shows that
population agglomeration and economic agglomeration are coordinated in half districts and counties of
Chongqing; (4)The spatial autocorrelation analysis shows that the spatial distribution of Chongqing's
population and economy has a relatively obvious positive spatial correlation, and areas with similar population
and economic coordination tend to congregate in space.
1 INTRODUCTION
Population and economy are two key factors that
determine whether a region can develop rapidly.
They interact with each other. The growth,
agglomeration and flow of population can affect the
economic development of a region to a great extent.
Whether the economy of a region is prosperous,
whether the economy is developing rapidly, and
whether the market is prosperous will in turn play an
important role in the distribution and change of
population. The interaction, connection and
restriction between population and regional economy
is an important topic in the study of regional social
development. Population and economy are also two
important indicators reflecting the differences
between regions. Studying the relationship between
population and regional economy is helpful to
promote the development of regional economy and
society, construct a good pattern of regional
economic development, and realize the coordinated
development between regions. To explore the
relationship between regional population growth and
regional economic growth is of great practical
significance for the population development and
economic development of a region.
In recent years, many scholars at home and abroad
have done a lot of research on the relationship
between population and economy. Wesley E and
Klaus P analyzed the role of population growth in
economic growth (Wesley, 2017, Peterson, 2017,
Klaus, 2014); Oliver M studied the impact of
population aging on Japanese economy and the role
of population aging in economic growth (Mikiko,
2015); Luca S analyzed the economic problems
caused by population growth and the relationship
between population growth and economic crisis
(Luca, 2016, Luca, 2018). Domestic research on the
population and economy of provinces is mainly based
on the analysis of the dynamic evolution of
population and economy in time and space. (Huang
2016, Zhao 2016), (Liu, 2017, Zhang, 2017, Liu,
2017) and (Xu, 2013, Tang, 2013, Wei, 2013)
analyzed the change of population and economic
634
Su, L., Yin, M. and Li, F.
Spatiotemporal Dynamic Evolution of Population and Economy in Chongqing.
DOI: 10.5220/0011202000003440
In Proceedings of the International Conference on Big Data Economy and Digital Management (BDEDM 2022), pages 634-647
ISBN: 978-989-758-593-7
Copyright
c
2022 by SCITEPRESS – Science and Technology Publications, Lda. All rights reserved

gravity center in Guizhou Province, Liaoning
Province and Xi’an city by using regional population
and economic gravity center; (Cai, 2016, Lu, 2016,
Hua, 2016), (Ren, 2016, Zhu, 2016, Shou, 2016) and
(Wang, 2013, Qin, 2013) analyzed the coupling
relationship between population and economy in
Guangxi Province, Ningxia urban agglomeration
along the Yellow River and Shanxi Province by using
geographic concentration and inconsistency index;
(Bin 2018, Tang 2018, Li 2018), (Liu, 2013, Zheng,
2013) and (Ding, 2014, Gao, 2014, Gao, 2014) used
exploratory spatial data analysis and other methods to
study the spatial correlation between population and
economy in Hunan Province, Henan Province and
Qinghai Tibet Plateau; (Lian, 2018, Wu, 2018) and
(Zhang, 2018, Run, 2018) used the growth elasticity
of population and economy to analyze the impact of
economic growth on population size in northeast
China and Yangtze River Delta; Based on Cobb
Douglas function, (Chen, 2018, Li, 2018, Yao, 2018)
analyzed the impact of population agglomeration on
China’s urban economic growth. Some scholars have
also studied the mutual development of population
and economy in Chongqing (Guan, 2017, Tan, 2017,
Zhang, 2017, Zhou, 2011, Tu, 2011, Lu, 2011, Liu,
2013, Su, 2013, Guan, 2013), but some of them have
been studied for a long time, and there are few studies
on the change of Chongqing’s population and
economic gravity center.
This paper mainly uses the method of barycenter,
geographic concentration, inconsistency index and
spatial autocorrelation, and uses Moran statistics,
Moran scatter diagram and LISA cluster diagram,
analyzes the change of the center of gravity of
population and economy in Chongqing, the spatial
distribution and agglomeration degree of population
and economy in different districts and counties, the
coordinated development of population and
economy, and the spatial correlation of population
and economy, and reveals the aggregation and
coupling law of population and economy in
Chongqing in recent years, which has practical
significance for the coordinated development of
population and economy in all districts and counties
of Chongqing.
2 RESEARCH METHODS AND
DATA SOURCES
2.1 Research Methods
2.1.1 Barycentre Method
The center of gravity of population and economy is
the point to maintain regional balance and
coordination. Suppose that a region is composed of
n
subunits, then the calculation formula of the
barycenter coordinate
(,)QXY
is as follows:
()
11
11
,,
nn
ii ii
ii
nn
ii
ii
rx ry
QXY X Y
rr
==
==
== =
(1)
In equation (1),
(,)QXY
represents the center of
gravity coordinates of Chongqing's population or
GDP;
()
,
ii
x
y
represents the longitude and latitude
coordinates of the geometric centers of all regions in
Chongqing;
i
r represents a certain attribute value of
the statistical unit, that is, population or GDP.
2.1.2 Geographical Concentration
Geographical concentration is the data reflecting the
concentration degree of a certain factor in a certain
area, including population geographical
concentration and economic geographical
concentration, reflecting the spatial distribution of
population and economy.
/
/
i
ii
pop
ii
pop pop
R
SS
=
(2)
/
/
i
ii
GDP
ii
GDP GDP
R
SS
=
(3)
In formulas (2) and (3),
i
pop
R
and
i
GDP
R
respectively represent the geographical concentration
of population and economy in the
i
th region,
i
pop
and
i
GDP
respectively represent the population and
GDP in the
i
th region,
i
pop
and
i
GDP
respectively represent the total population and total
economy in Chongqing, and
i
S and
i
S
respectively
represent the area of the
i
th region and the total area
of Chongqing.
Spatiotemporal Dynamic Evolution of Population and Economy in Chongqing
635

2.1.3 Inconsistency Index of Population and
Economy
The inconsistency index of population and economy
is an important parameter to examine whether the
distribution of population and economy is balanced in
a region. The calculation formula is:
/
ii
pop GDP
IR R=
(4)
Where
I
is the inconsistency index, the closer
I
is
to 1, the more coordinated the population and
economic development of a region; the smaller
I
is,
the stronger the spatial aggregation ability of a
region's economy is; the greater
I
is, the greater the
agglomeration degree of population is.
2.1.4 Global Spatial Autocorrelation
We can use global Moran statistics to analyze the
autocorrelation and spatial agglomeration of
population and economy in Chongqing. Spatial
agglomeration means that the population and
economy between adjacent regions do not exist
independently, but show typical characteristics of
spatial spillover and spatial diffusion (Yang, 2021,
Zhang, 2021, Zhang, 2021). According to Moran's
research in 1948 (Moran, 1948), the calculation
formula is as follows:
11
2
11
()( )
nn
ij i j
ij
G
nn
ij
ij
wx xx x
I
Sw
==
==
−−
=
(5)
Where
G
I
is the global Moran statistics,
i
x
and
j
x
represent the population or GDP of district
i
and
district
j
respectively,
ij
w
is the adjacent weight of
spatial units. In the spatial correlation analysis part of
this paper, the queen adjacency matrix is used as the
spatial weight matrix.
22
1
1
=( )
n
i
i
Sxx
n
=
−
is the
variance of population or GDP. The value range of
G
I
is between -1 and 1, greater than 0 means that the
spatial distribution of population or GDP is positively
correlated; less than 0 means that the population or
GDP is negatively correlated in space; equal to 0
means that the population or GDP is not spatially
related.
2.1.5 Local Spatial Autocorrelation
The method of local spatial autocorrelation can be
used to analyze the spatial difference degree and
significance of population or economy between an
area and its adjacent areas (Anselin, 1995). The
definition of local Moran statistics is as follows:
1
n
ii ijj
j
I
zwz
=
=
(6)
Among them,
i
z
and
j
z
are the deviation of the
number of permanent residents or GDP of the
i
and
j
area from the mean, that is,
()
ii
zxx=−
,
()
jj
zxx=−
, if
0
i
I >
, it means that there is a
positive correlation between the population or
economy of the adjacent districts and counties;
0
i
I <
, it means that there is a negative correlation. Moran
scatter plot depicts the relationship between the
population or economy of each region and its spatial
lag term, and makes a visual two-dimensional display
of it, reflecting the spatial autocorrelation of the
investigated variables in the local region. Moran
scatter are divided into four types: high-high, low-
low, low-high and high-low. The point falling into a
high-high or low-low region indicates that the
population or economic agglomeration degree of a
region is high (low) and the population or economic
agglomeration degree of its adjacent regions is high
(low), with small spatial difference, which belongs to
spatial positive correlation; the point falling into a
low-high or high-low region indicates that the
population or economic agglomeration degree of a
region is low (high) and the population or economic
agglomeration degree of its adjacent regions is high
(low), large spatial difference, belonging to spatial
negative correlation.
2.2 Interpretation of Data
The resident population and GDP data of Chongqing
from 2010 to 2019 are all from Chongqing statistical
yearbook (Chongqing Statistics Bureau). Before
analyzing the data, the relevant data are standardized.
3 RESULTS AND DISCUSSION
3.1 Analysis on the Migration of
Gravity Center of Population and
Economy in Chongqing
3.1.1 Population Distribution Gravity
Center and Migration Change in
Chongqing
According to the resident population data of various
regions of Chongqing from 2010 to 2019, the
BDEDM 2022 - The International Conference on Big Data Economy and Digital Management
636
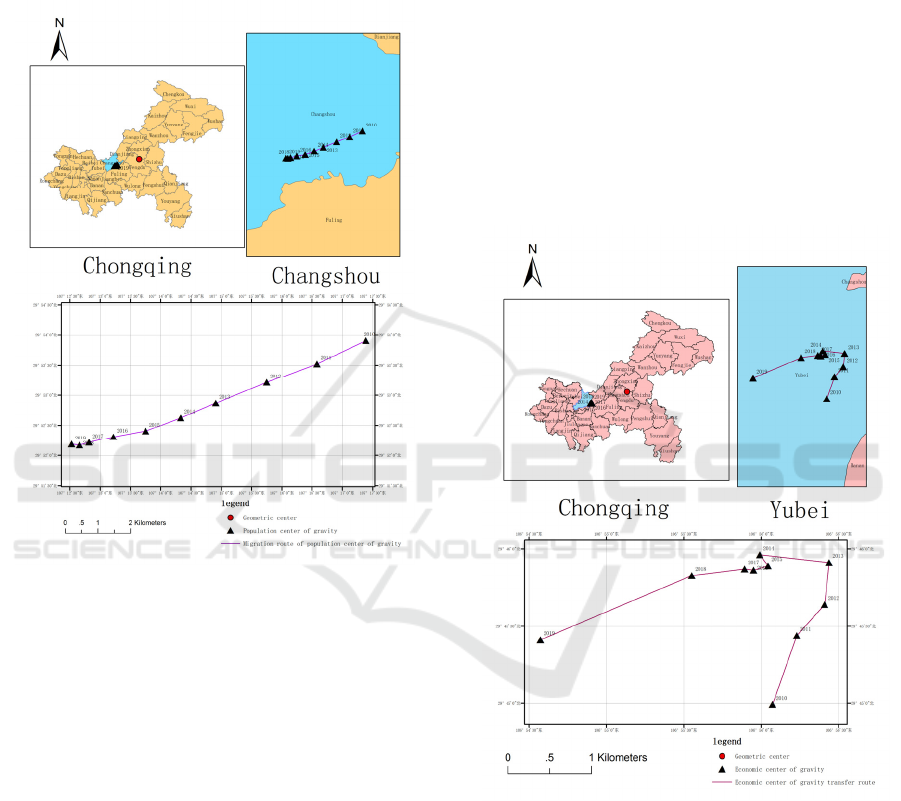
population distribution center of gravity (107.2088
E°
-107.2898
E°
, 29.8694
N°
-29.8984
N°
) and
geometric center coordinates (107.8744
E°
, 30.0572
N°
) are calculated, and the migration map of
population distribution center of gravity in
Chongqing is generated (Fig. 1)
Figure 1: Migration map of population distribution gravity
center in Chongqing.
From the migration map of population
distribution center of gravity, it can be seen that from
2010 to 2019, Chongqing’s population center of
gravity is distributed in Changshou District, which
has a large deviation from the geometric center of
Chongqing. In the past ten years, the population
gravity center of Chongqing has been distributed in
the southwest of the geometric center of Chongqing,
and it has moved from northeast to southwest, and is
farther and farther away from the geometric center of
Chongqing, and keep the trend of migration to the
southwest. This may be related to the good economic
development and high population attraction of the
main urban area in the southwest of Chongqing
geometric center. In 2010, the total population of
Chongqing main urban area is 7.4576 million,
accounting for 25.85% of the total population; in
2019, the total population of Chongqing main urban
area is 8.8439 million, accounting for 28.31% of the
total population of Chongqing. In the past ten years,
the proportion of population in the main urban area
has increased by nearly 3 percentage points, which is
enough to see the trend of population gravity center
moving to the southwest.
3.1.2 The Gravity Center of Economic
Distribution and Its Change in
Chongqing
According to the GDP data of each district and county
in Chongqing from 2010 to 2019, the annual
economic distribution gravity center (106.9095
E°
-
106.9345
E°
, 29.7498
N°
-29.7660
N°
) from 2010
to 2019 is calculated, and the economic distribution
gravity center migration map of Chongqing is
generated (Fig 2).
Figure 2: Chongqing economic distribution center of
gravity transfer map.
It can be seen from the transfer chart of economic
gravity center that the economic gravity center of
Chongqing is distributed in Yubei District from 2010
to 2019, which is quite different from the geometric
center of Chongqing. In the past ten years,
Chongqing’s economic center of gravity is located in
the southwest of Chongqing’s geometric center. From
2010 to 2013, Chongqing’s economic center of
gravity moved from south to north. From 2013 to
Spatiotemporal Dynamic Evolution of Population and Economy in Chongqing
637
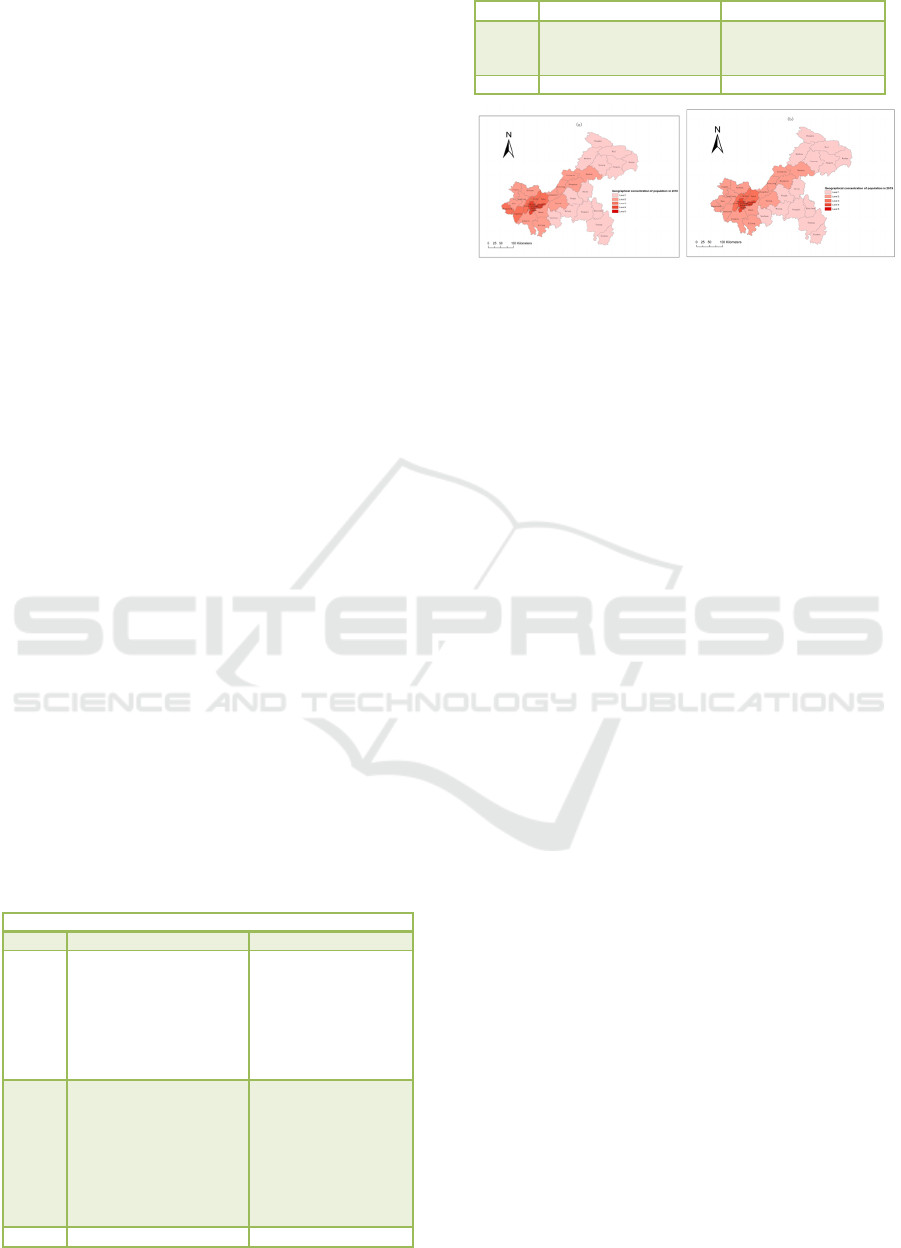
2019, Chongqing’s economic center of gravity
moved from northeast to southwest. From 2010 to
2013, Yubei District’s GDP increased greatly. In
2010, Yubei District’s GDP accounted for 7.14% of
Chongqing’s GDP, while in 2013, Yubei district’s
GDP accounted for 8.1%. Over the past few years, it
has increased by 1 percentage point, which is the
largest increase among all districts and counties in
Chongqing. Therefore, from 2010 to 2013,
Chongqing’s economic gravity center has been
moving northward. From 2013, the proportion of
GDP in Yubei District began to decrease, and the
GDP of Hechuan, Rongchang, Tongliang and other
districts and counties in southwest Chongqing began
to increase significantly. From 2017 to 2019, the
proportion of GDP in Hechuan, Rongchang,
Tongliang increased by 0.63%, 0.53% and 0.53%
respectively. Therefore, from 2013, the economic
distribution gravity center of Chongqing began to
move to the southwest.
3.2 Geographical Concentration
Analysis of Chongqing’s Population
and Economy
3.2.1 Analysis of Geographical
Concentration of Population in
Chongqing
Based on the data of resident population in 2010 and
2019, the geographic concentration index of
Chongqing’s population can be calculated according
to equation (2). The geographic concentration can be
divided into five grades. The higher the level is, the
more concentrated the population is. The
classification results are shown in Table 1.
Table 1: Classification of geographical concentration of
population in Chongqing in 2010 and 2019.
Geo
g
ra
p
hical concentration of
p
o
p
ulation
Grades 2010 2019
Level 1
Kaizhou、Chengkou、
Wuxi、Yunyang、
Fengjie、Wushan、
Shizhu、Fengdu、
Nanchuan、Wulong、
Pengshui、Qianjiang、
You y an g、Xiushan
Kaizhou、Chengkou、
Wuxi、Yunyang、
Fengjie、Wushan、
Shizhu、Fengdu、
Nanchuan、Wulong、
Pengshui、Qianjiang、
You y an g、Xiushan
Level 2
Tongnan、Hechuan、
Tongliang、Dazu、
Jiangjin、Banan、
Qijiang、Fuling、
Changshou、Dianjiang、
Liangping、Zhongxian、
Wanzhou
Tongnan、Hechuan、
Tongliang、Dazu、
Jiangjin、Banan、
Qijiang、Fuling、
Changshou、
Dianjiang、Liangping、
Zhongxian、Wanzhou、
Rongchang、Yongchuan
Level 3 Rongchang、Yongchuan、 Bishan、Beibei、Yu be i
Bishan、Beibei、Yu be i
Level 4
Shapingba、Dadukou、
Jiulongpo、Jiangbei、
Nan’an
Shapingba、Dadukou、
Jiulongpo、Jiangbei、
Nan’an
Level 5 Yuzhon
g
Yuzhon
g
Figure 3: Geographical concentration distribution of
Chongqing’s population in 2010(a) and 2019(b).
Fig 3 shows the distribution of population
geographical concentration in Chongqing in 2010 and
2019. As can be seen from Fig 3, the population
geographical concentration of Chongqing in 2010
showed a pattern of high in the West and low in the
East. The population geographical concentration
index decreases from the main city to the surrounding
districts and counties. In terms of the degree of
agglomeration, the main urban area has the most
dense population, among which Yuzhong has the
highest degree of population agglomeration, and the
population geographical concentration index is 75.97,
which is much larger than other regions. It is the only
one of the level 5 of agglomeration areas. The
population of the Nan’an and Jiangbei are also highly
concentrated, with an index greater than 7.18, which
are all areas of the fourth aggregation level. Some
areas in the north and west of the main urban area,
such as Bishan and Yongchuan, also have high
population density, with an index between 1.57 and
2.65. They belong to the third aggregation level.
Some areas south of the main urban area have
relatively small population aggregation, such as
Qijiang. Their indexes are between 0.84 and 1.57,
which is the second aggregation level area. However,
some areas in southeast and northeast Chongqing,
which are far away from the main urban area, have a
low degree of population aggregation, and the index
is below 0.84. By 2019, the population geographical
concentration of Chongqing has not changed much.
Only the population concentration in Rongchang and
Yongchuan has decreased, and the population
concentration in the main urban area is still very high.
Generally speaking, from 2010 to 2019, the main
urban area has always been the most densely
populated place in Chongqing, the degree of
aggregation is increasing year by year, and the area
with high population concentration tends to narrow.
The population geographical concentration in
Northeast and Southeast Chongqing remains at a low
BDEDM 2022 - The International Conference on Big Data Economy and Digital Management
638
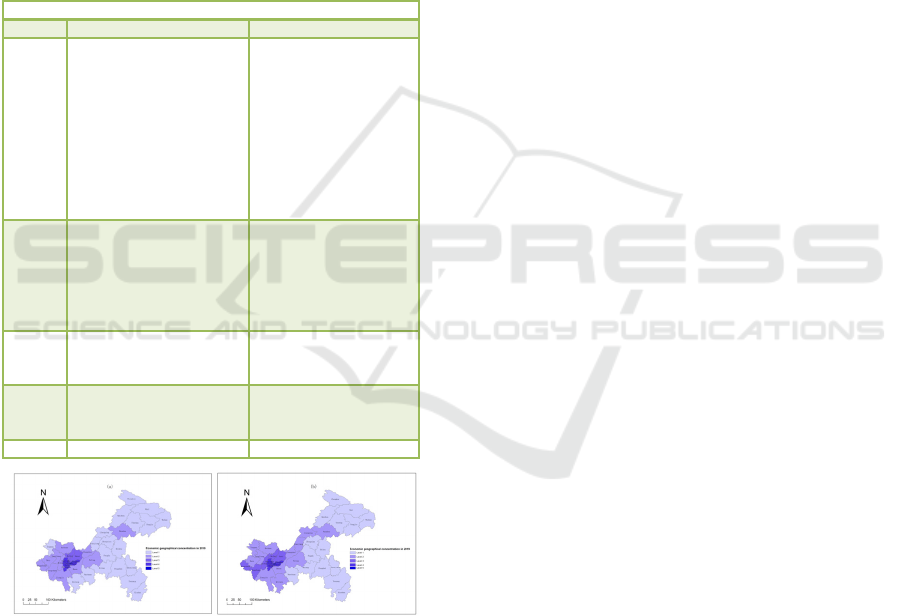
level, and the population concentration is gradually
weakening.
3.2.2 Analysis of Economic Geographical
Concentration in Chongqing
Based on the GDP data of Chongqing in 2010 and
2019, the economic geographical concentration index
in 2010 and 2019 is calculated. According to the
economic geographical concentration index, each
district and county is divided into five grades. The
higher the grade, the more concentrated the economy
is. The classification results are shown in Table 2.
Table 2: Classification of economic geographical
concentration degree of Chongqing in 2010 and 2019.
Economic
g
eo
g
ra
p
hical concentration
Grades
2010 2019
Level 1
Kaizhou、Chengkou、
Wuxi、Yunyang、
Fengjie、Wushan、
Qijiang、Shizhu、
Dianjiang、Liangping、
Zhongxian、Tongnan、
Fengdu、Nanchuan、
Wulong、Pengshui、
Qianjiang、Youyang、
Xiushan
Kaizhou、Chengkou、
Wuxi、Yunyang、
Fengjie、Wushan、
Shizhu、Wulong、
Fengdu、Nanchuan、
Xiushan、Yo uy ang 、
Pengshui、Qianjiang、
Zhongxian
Level 2
Hechuan、Banan、
Tongliang、Dazu、
Jiangjin、Fuling、
Changshou、Bishan、
Wanzho u、Rongchang、
Yongchuan
Banan、Wanzhou、
Changshou、Dazu、
Jiangjin、Dianjiang、
Liangping、Tongnan、
Hechuan、Tongliang、
Fuling、Qijiang
Level 3
Beibei、Yu be i
Bishan、Beibei、
Yub ei 、Rongchang、
Yon
g
chuan
Level 4
Shapingba、Dadukou、
Jiulongpo、Jiangbei、
Nan’an
Shapingba、Dadukou、
Jiulongpo、Jiangbei、
Nan’an
Level 5
Yuzhon
g
Yuzhon
g
Figure 4: Distribution of economic geographical
concentration of Chongqing in 2010(a) and 2019(b).
Fig 4 shows the distribution of economic
geographical concentration of Chongqing in 2010
and 2019. In terms of the degree of agglomeration, in
2010, the economic distribution in the main urban
area was the most intensive, among which Yuzhong
District had the highest degree of economic
concentration, and the economic geographical
concentration index was 239.44, which was the area
with the strongest degree of economic agglomeration.
The index of Jiangbei, Nan’an and other regions is
greater than 13.70, belonging to the fourth level of
economic agglomeration. The index of Yubei and
Beibei are 4.06 and 3.16 respectively, belonging to
the third-class economic agglomeration area. Bishan,
Tongliang and other regional around the main urban
area index are between 0.81 and 1.95, belonging to
the second level economic agglomeration area. The
index of Southeast Chongqing and Northeast
Chongqing, which are far away from the main urban
area, are less than 0.81, belonging to the area with the
weakest degree of economic agglomeration. By 2019,
Yuzhong District will still maintain the highest
degree of economic agglomeration, and the degree of
economic agglomeration in Bishan, Rongchang and
other regions has increased. On the whole, the
economic geographical concentration of Chongqing,
like the population geographical concentration,
shows an unbalanced pattern of high in the West and
low in the East. The trend of economic geographical
concentration decreasing from the main city to the
surrounding districts and counties is very obvious.
The main urban area has always been the most
concentrated place of economic agglomeration in
Chongqing, and the degree of economic
agglomeration is becoming stronger and stronger.
However, in the area far away from the main urban
area with sparse population and vast area, the
concentration of economic geography is very small.
It can be seen that the economic development of
Chongqing is mainly concentrated in the main urban
area and its surrounding areas, while the economic
development of some districts and counties on the
edge of Chongqing is relatively slow, and the
economic gap is gradually expanding.
3.3 Analysis on the Inconsistent Index
of Population and Economy in
Chongqing
In order to analyze whether the distribution of
population and economy in various regions of
Chongqing is consistent, According to formula (4),
the inconsistency index of population and economy
in Chongqing in 2010 and 2019 can be calculated, and
the coordinated development of population and
economy in various regions can be divided into three
types: first, second and third, which respectively
represent that the degree of population agglomeration
is less than the degree of economic agglomeration,
the degree of population agglomeration is consistent
with the degree of economic agglomeration, and the
Spatiotemporal Dynamic Evolution of Population and Economy in Chongqing
639
degree of population agglomeration is greater than
the degree of economic agglomeration.
Figure 5: Spatial consistency pattern of population and
economic distribution in Chongqing in 2010(a) and
2019(b).
As can be seen from Figure 5, the areas where
population agglomeration was greater than economic
agglomeration in 2010 were mainly concentrated in
Northeast Chongqing and Southeast Chongqing. The
degree of population and economic agglomeration in
Changshou, Wanzhou and other regions is relatively
consistent. In the main urban area, Bishan and Fuling,
there is a trend that population agglomeration lags
behind economic agglomeration. By 2019,
population agglomeration and economic
agglomeration in Tongnan, Hechuan and other
regions tend to be coordinated. The degree of
population agglomeration in most areas of Southeast
and Northeast Chongqing is still higher than that of
economic agglomeration. In general, only some areas
of the main urban area have higher economic
agglomeration than population agglomeration, and
most other areas have greater population
agglomeration than economic agglomeration or
population agglomeration is consistent with
economic agglomeration. From 2010 to 2019, the
spatial differentiation pattern of the relationship
between population and economic distribution in
Chongqing has changed significantly, indicating that
the economy of Chongqing has developed rapidly in
recent years, and the GDP of many regions has
increased rapidly, which has promoted the
concentration of economy, thus promoting the
coordinated development of population and economy
in places with excessive population agglomeration.
3.4 Spatial Autocorrelation Analysis of
Population and Economy in
Chongqing
3.4.1 Spatial Autocorrelation Analysis of
Chongqing’s Population
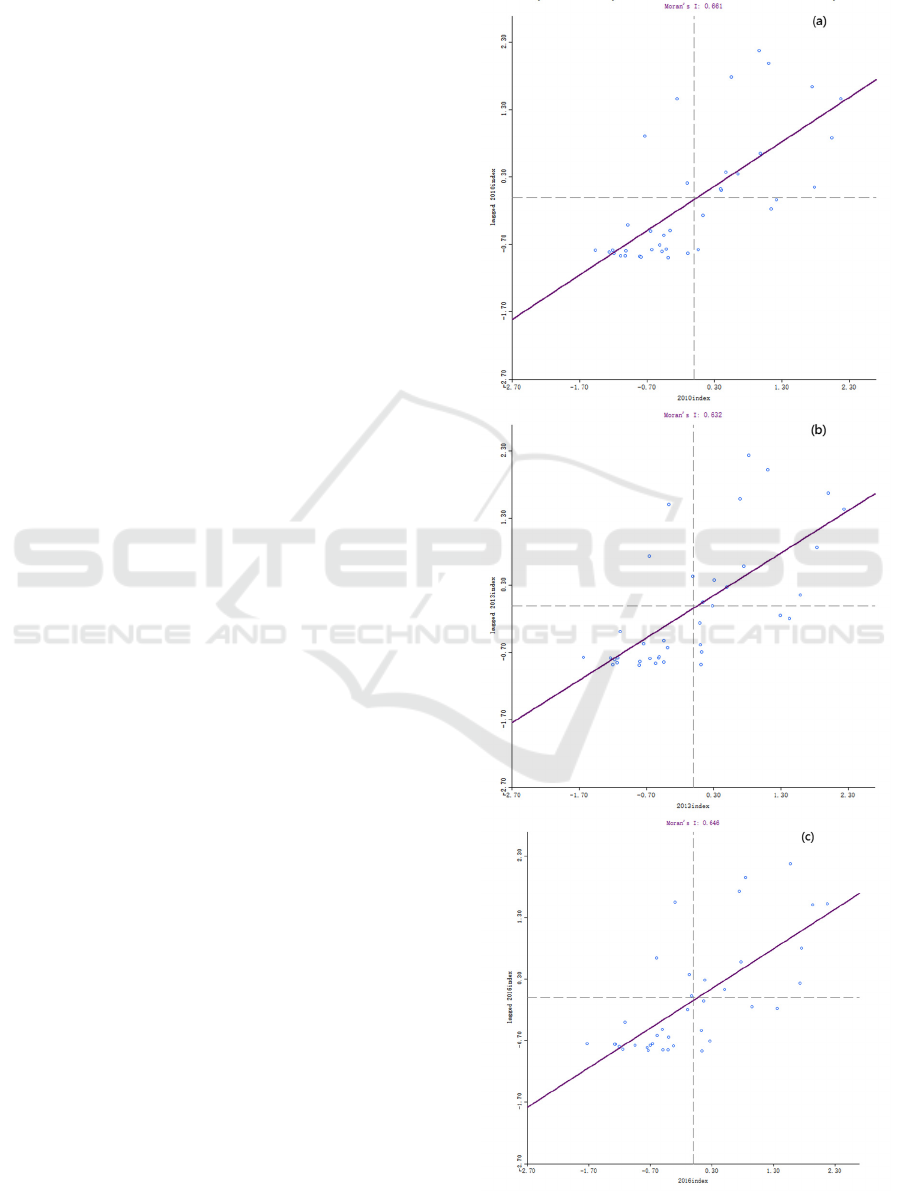
In order to effectively measure the spatial correlation
of Chongqing’s population distribution, the global
Moran statistics of Chongqing’s population from
2010 to 2019 are calculated and tested, as shown in
Table 3.
Table 3: Global Moran statistics of Chongqing’s
population.
20
10
20
11
20
12
20
13
20
14
20
15
20
16
20
17
20
18
20
19
I
G
0.
19
4
0.
20
5
0.
22
0
0.
22
9
0.
23
6
0.
24
6
0.
25
6
0.
26
4
0.
26
5
0.
26
7
Z 2.
24
0
2.
33
5
2.
48
1
2.
64
1
2.
71
1
2.
74
0
2.
83
4
2.
91
7
2.
91
3
2.
92
8
P
va
lu
e
0.
01
9
0.
01
6
0.
00
9
0.
00
6
0.
00
8
0.
00
6
0.
00
4
0.
00
4
0.
00
4
0.
00
3
In Table 3, I
G
values are greater than zero,
indicating that the population distribution in
Chongqing has a spatial positive correlation globally.
The Moran scatter map of Chongqing’s population in
2010, 2013, 2016 and 2019 is drawn, as shown in Fig
6.
Figure 6: Moran scatter of Chongqing population in
2010(a), 2013(b), 2016(c), 2019(d).
As can be seen from Fig 6, the global Moran
statistical value is greater than zero, indicating that
there is a significant global spatial positive
correlation between the population in various regions
of Chongqing, and the population basically presents
the characteristics of relatively stable spatial
agglomeration, that is, the population in the
surrounding areas is also more concentrated, where
the population is more concentrated, and vice versa.
But the global Moran statistics is low, which indicates
that the agglomeration characteristics of population
BDEDM 2022 - The International Conference on Big Data Economy and Digital Management
640
distribution in Chongqing is not very strong and the
correlation is relatively weak. From the Moran scatter
diagram, we can see that most districts and counties
in Chongqing are located in the first, second and third
quadrants, and the distribution is relatively average,
which indicates that the distribution of population
does not show a very obvious high-high distribution
or low-low distribution. It further shows that although
there is a positive spatial autocorrelation between the
population in various regions of Chongqing, the
agglomeration trend is not strong and the positive
correlation is weak. In Fig 6, since 2010, the global
Moran statistics of the population in all districts and
counties of Chongqing has been gradually increasing,
which indicates that the spatial agglomeration of
Chongqing’s population is becoming more and more
significant, and the polarization effect is increasing.
Lisa agglomeration map can be used to analyze
the local spatial agglomeration characteristics of
Chongqing population. Fig 7 shows the local spatial
agglomeration of population in different years.
Figure 7. Local spatial autocorrelation agglomeration map
of Chongqing’s population in 2010(a), 2013(b), 2016(c),
2019(d).
It can be seen from Fig 7 that the population
distribution of Chongqing has no obvious spatial
agglomeration characteristics, and only a few areas
belong to high-high type and low-low type. In
general, the distribution pattern of population spatial
agglomeration in Chongqing has changed to some
extent. The number of high-high type areas of
population spatial distribution has been increasing,
from one in 2010 to seven in 2019; similarly, the
number of low-high type areas of population spatial
distribution is also increasing, from three in 2010 to
five in 2019. It can be seen that the agglomeration
characteristics of Chongqing’s population spatial
distribution are more and more strong, especially in
the main urban area. Six of the seven high-high type
areas are in the main urban area, which indicates that
the population growth of the main urban area is fast
and the population is relatively dense in recent ten
years. With the economic development, the main
urban area can attract more people to immigrate.
3.4.2 Spatial Autocorrelation Analysis of
Chongqing’s Economy
In order to effectively measure the spatial correlation
of Chongqing’s economic distribution, Moran
statistics of Chongqing’s economy are calculated, as
shown in Table 4. It can be seen from table 4 that the
Moran statistics of the economies of all districts in
Chongqing from 2010 to 2019 passed the significance
test at the confidence level of 0.01, and the global
Moran statistics are greater than zero, indicating that
the economic distribution of Chongqing has obvious
positive spatial correlation in the world.
Table 4: Global Moran statistics of Chongqing’s economy.
20
10
20
11
20
12
20
13
20
14
20
15
20
16
20
17
20
18
20
19
I
G
0.
36
7
0.
36
1
0.
35
2
0.
36
4
0.
37
1
0.
37
3
0.
38
2
0.
38
7
0.
41
5
0.
45
3
Z 3.
72
6
3.
68
6
3.
61
1
3.
75
9
3.
84
2
3.
86
3
3.
94
6
3.
99
3
4.
26
7
4.
71
5
P
va
lu
e
0.
00
2
0.
00
2
0.
00
2
0.
00
1
0.
00
1
0.
00
1
0.
00
1
0.
00
1
0.
00
1
0.
00
1
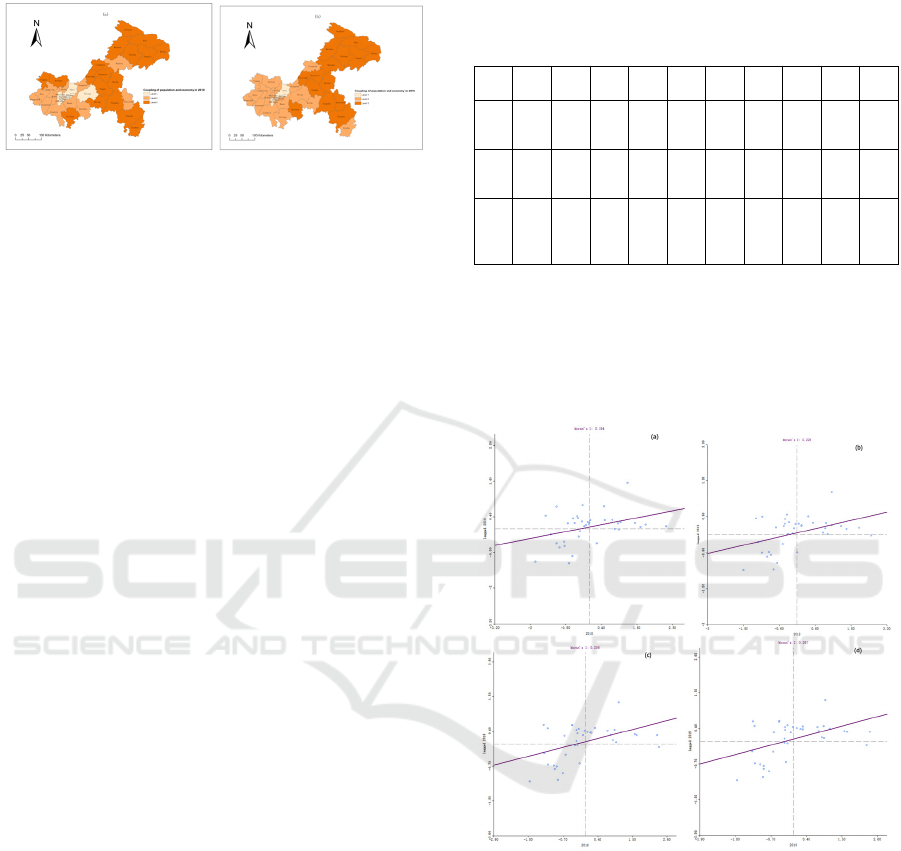
In Fig 8, the GDP of most districts and counties in
Chongqing is distributed in the first quadrant and the
third quadrant, indicating that the GDP distribution of
each district and county presents a relatively obvious
high-high or low-low distribution.
Spatiotemporal Dynamic Evolution of Population and Economy in Chongqing
641
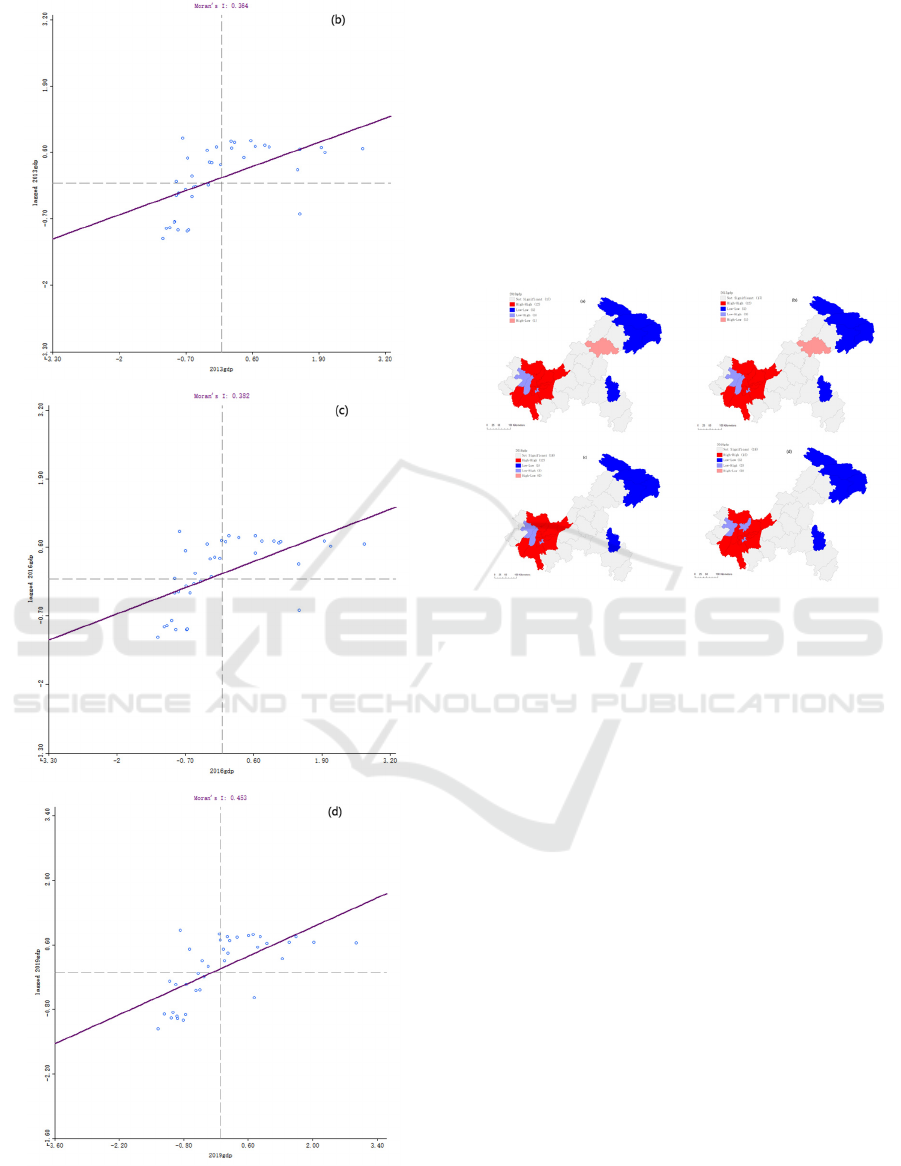
Figure 8. Moran scatter diagram of Chongqing’s economy
in 2010(a), 2013(b), 2016(c), 2019(d).
From 2010 to 2013, the overall Moran index of
Chongqing’s GDP has slightly decreased, but
Chongqing’s GDP is increasing every year. The
reason for the decrease of Moran index may be that
the regional economic development policies have a
certain impact on the differences of economic spatial
distribution. Since 2013, the overall Moran index of
the economy of Chongqing has been gradually
increasing, which indicates that the spatial
agglomeration of Chongqing’s economy is becoming
more and more significant, and the polarization effect
is increasing.
Figure 9: Local spatial autocorrelation agglomeration map
of Chongqing’s economy in 2010(a), 2013(b), 2016(c),
2019(d).
Fig 9 is the LISA spatial agglomeration map of
economy in 2010, 2013, 2016 and 2019. It can be
seen from Fig 9 that the spatial agglomeration
characteristics of Chongqing economy are obvious,
showing the basic pattern of high-high agglomeration
in the main urban area and its surrounding areas, and
low-low agglomeration in northeast Chongqing.
Among them, the districts and counties with
significant high-high type are Yubei, Jiangbei,
Yuzhong and Nan’an in the main urban area,
Hechuan, Changshou in the north of the main urban
area, and Jiangjin, Yongchuan in the south of the
main urban area. The main urban area is the economic
center of Chongqing, with rapid economic
development and strong spatial agglomeration. The
significant low-low types of districts and counties are
mainly Chengkou, Wuxi, Wushan and Fengjie in
northeast Chongqing and Qianjiang in southeast
Chongqing. Most of these areas are mountainous
areas. Due to the poor geographical conditions, the
economic development of these areas is relatively
slow, and the overall level belongs to the less
developed areas of the city. The significant low-high
type areas are Dadukou district and Tongliang district
BDEDM 2022 - The International Conference on Big Data Economy and Digital Management
642
in the west of the main urban area, which shows that
there is a relatively large spatial difference between
the economic development of these two areas and the
surrounding districts and counties, and there is a
relatively strong negative spatial correlation.
Although Dadukou District belongs to the main urban
area, the population of Dadukou District is the least
among the nine main urban areas, and the GDP is also
the least among the nine main urban areas, which is
several times lower than the other eight areas.
Therefore, although Dadukou District belongs to the
main urban area, the economic spatial distribution of
Dadukou District does not show obvious high-high
distribution, but low-high distribution. In general, the
change of economic spatial agglomeration
characteristics of Chongqing’s districts and counties
is not particularly large. From 2010 to 2019, the
number of high-high type areas has remained stable
at 12. Moreover, the basic pattern of high-high
agglomeration in the main urban area and its
surrounding areas and low-low agglomeration in the
northeast of Chongqing has not changed much, which
indicates that the change of economic agglomeration
characteristics in various regions of Chongqing is
basically stable.
3.4.3 Spatial Autocorrelation Analysis of
Coordinated Development of
Population and Economy in
Chongqing
Based on the inconsistent index data of Chongqing in
2010, 2013, 2016 and 2019, this paper analyzes the
spatial correlation between the coordinated
development of population and economy in
Chongqing. Use 10eode to draw the global Moran
scatter diagram, as shown in Fig 10.
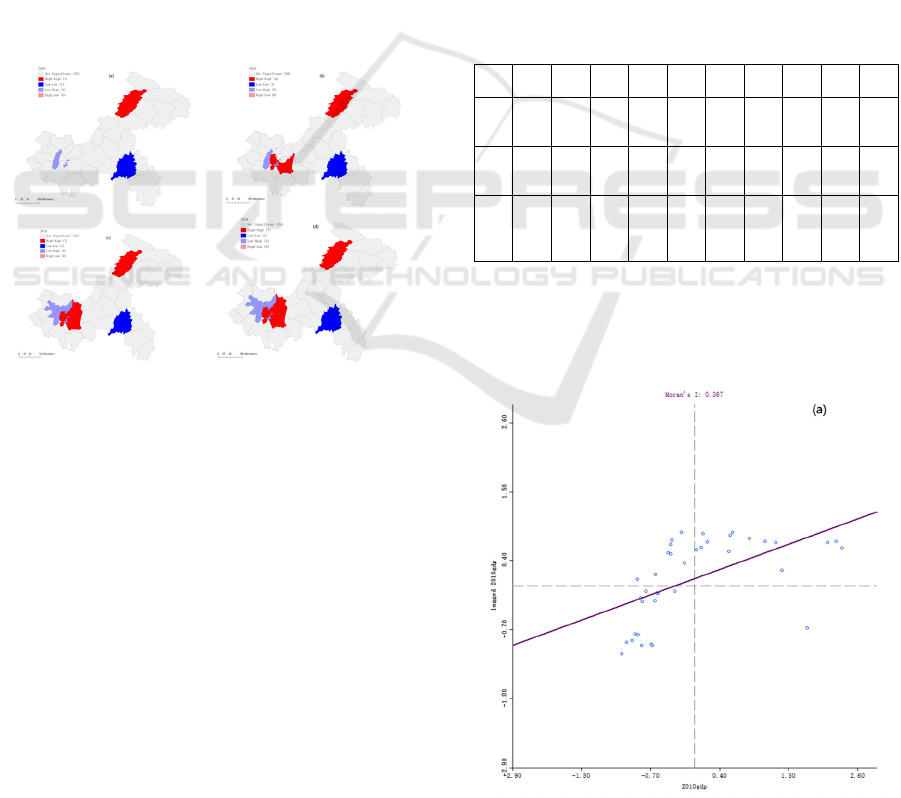
As can be seen from Fig 10, the global Moran
autocorrelation coefficient of the inconsistency index
within four years is significantly greater than zero,
and most areas are located in the first quadrant and
the third quadrant. The results show that there is a
significant positive correlation between the
population and economic disharmony index in
Chongqing, showing obvious high-high distribution
and low-low distribution. The regions with similar
degree of population and economic coordination tend
to gather in spatial distribution. Since 2013, the
Moran value has been rising, which indicates that the
spatial agglomeration degree of areas with similar
population and economic coordination in Chongqing
has become higher. In order to more intuitively reflect
the difference and change process of the
inconsistency index of local population and economic
spatial distribution in Chongqing, the Lisa cluster
diagram of the inconsistency index of population and
economy in four years can be drawn for analysis.
Spatiotemporal Dynamic Evolution of Population and Economy in Chongqing
643
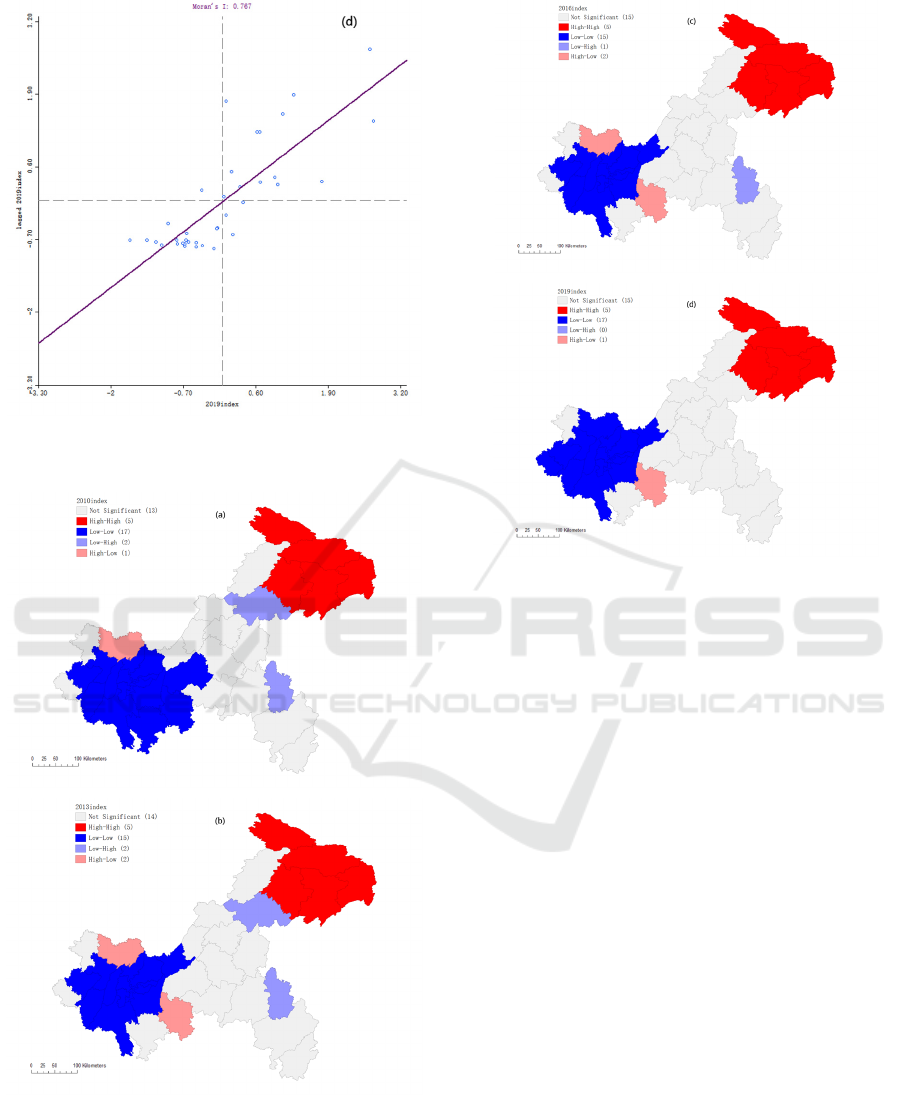
Figure 10: Moran scatter of inconsistency index of
Chongqing in 2010(a), 2013(b), 2016(c), 2019(d).
Figure 11: LISA cluster diagram of the inconsistency index
in 2010(a), 2013(b), 2016(c), 2019(d).
Fig 11 is the LISA clustering map of the
inconsistency index of population and economy. It
can be seen from the map that in 2010, the main urban
area and its surrounding areas were low-low
agglomeration areas in the spatial distribution of
population and economic inconsistency index;
Wushan, Wuxi, Chengkou in northeast Chongqing
are the regions with high-high agglomeration type of
inconsistency index; Wanzhou and Qianjiang belong
to low-high agglomeration type; Hechuan belongs to
high-low agglomeration type. In 2019, the spatial
agglomeration characteristics of Chongqing’s
population and economic inconsistency index did not
change much. Generally speaking, the regions with
low-low distribution of the inconsistency index are
mainly concentrated in the main urban areas with
better economic development and some areas around
the main urban areas. The regions with obvious high-
high distribution of inconsistency index are mainly
concentrated in the remote areas and counties of
northeast Chongqing where the economic
development conditions are poor. It can be seen that
Chongqing’s population and economic development
situation has obvious regional imbalance. The main
urban area and its surrounding areas have a very good
development foundation and conditions, and they are
also in a relatively obvious advantage in the
BDEDM 2022 - The International Conference on Big Data Economy and Digital Management
644

economic competition of various regions in
Chongqing, which promotes the economic
agglomeration of the main urban area and its
surrounding counties to be higher than the population
agglomeration, and the inconsistency index of
population and economy is significantly less than 1.
Because of the terrain, the economic development of
northeast Chongqing is relatively slow, and the
natural resources and labor resources are not rich
enough, which leads to the backward economy. The
economic agglomeration lags behind the population
agglomeration, and the Inconsistency index of
population and economy is significantly greater than
1.
4 CONCLUSIONS
Through the analysis of the development pattern and
spatial relationship between population and economic
distribution in Chongqing, the following conclusions
can be drawn: (1) The population and economic
center of gravity has moved to the main urban area;
(2)The population and economy are mainly
concentrated in the main urban area and its
surrounding counties; (3)Population agglomeration
and economic agglomeration are coordinated in half
of Chongqing; (4)The spatial distribution of
Chongqing's population and economy has a relatively
obvious positive spatial correlation.
First of all, from the perspective of the gravity
center and migration route of Chongqing's population
and economy, the gravity center of Chongqing's
population and economy is located in the southwest
of Chongqing's geometric center, which is consistent
with the fact that the main urban area of Chongqing
is located in the southwest of Chongqing. From 2010
to 2019, Chongqing's population gravity center has
been located in Changshou District, and it is moving
to the southwest every year. The economic center of
gravity has always been located in Yubei district.
From 2010 to 2013, the economic center of gravity
has the trend of moving northward, but from 2013,
the economic center of gravity has gradually moved
to the southwest. On the whole, the population and
economic center of Chongqing is gradually moving
to the main urban area of Chongqing.
Secondly, from the spatial agglomeration degree
and distribution of Chongqing's population and
economy, the geographical concentration degree of
population and economic show that the spatial
distribution of Chongqing's population and economy
presents a significant unbalanced distribution pattern
of high agglomeration degree in "one circle" and low
agglomeration degree in "two wings". "One circle"
refers to the "one hour economic circle" in the main
urban area and surrounding areas of Chongqing, and
"two wings" refers to the remote areas in the
southeast and northeast of Chongqing from the main
urban area. The main urban area of Chongqing is the
political, economic, cultural and financial center of
the city. Due to the terrain, the main urban area of
Chongqing and its surrounding areas are mainly low
mountains and hills. It is rich in natural resources and
has strong carrying capacity of resources and
environment, which can attract more foreign
population to the main urban area for development
and further promote the economic development of the
main urban area. As a result, the population and
economy of the main urban area are highly
concentrated, and the distribution density of
population and economy is also very high. The "two
wings" of southeast Chongqing and northeast
Chongqing are located in Wuling mountain area and
Daba mountain area, with steep and complex terrain,
low environmental carrying capacity of resources,
and poor economic development, which leads to the
outflow of population. Therefore, the degree of
population and economy aggregation in this part of
the area is not obvious, and the distribution density of
population and economy is relatively low.
Thirdly, from the perspective of the coordination
of Chongqing's population and economic
development, with the economic growth of all
districts and counties in Chongqing, there are some
changes in the coordinated development of
Chongqing's population and economy from 2010 to
2019. For example, Tongnan and Hechuan to the
north of the main urban area and Qijiang to the south
of the main urban area have changed from the area
where population concentration is ahead of economic
concentration to the area where population
concentration and economic concentration are
coordinated. On the whole, population agglomeration
and economic agglomeration are coordinated in half
of Chongqing, while only a few areas have economic
agglomeration ahead of population agglomeration.
Finally, from the perspective of spatial correlation
of Chongqing’s population and economy, the Moran
global scatter diagram shows that the spatial
distribution of Chongqing’s population and economy
shows a relatively obvious positive correlation, and
the correlation is becoming stronger and stronger.
LISA cluster diagram shows that the spatial
agglomeration of Chongqing's population and
economy in the "one circle" presents an obvious high-
high distribution, and the low-low distribution is
mainly concentrated in the "two wings" area. The
Spatiotemporal Dynamic Evolution of Population and Economy in Chongqing
645

global Moran scatter diagram and LISA cluster
diagram of the inconsistency index of population and
economic distribution in Chongqing show that the
inconsistency index has a significant positive spatial
correlation, and regions with similar population and
economic coordination tend to cluster in space. The
specific performance is that the low-low
agglomeration distribution of population and
economic inconsistency index is always in the main
urban area and some surrounding areas, while the
high-high spatial agglomeration distribution area is
always in northeast Chongqing, and has not changed
much in the past decade.
The coupling development of population and
economy is a complex and continuous evolution
process. Due to the limitation of data source and
quality, it is obviously limited to conduct in-depth
research on the population and economic
development of Chongqing only based on the
population and GDP data of Chongqing from 2010 to
2019. However, in view of the certain characteristics
of population migration and economic development
in Chongqing, although this paper is a preliminary
study, based on the research ideas and conclusions of
this paper, it can provide an important basis for
further in-depth analysis in the future. In future
research, in-depth analysis and research can be
carried out from the following aspects: (1) Select the
data with longer time span and the latest data to
deeply grasp the development law and latest
development of population and economic in
Chongqing; (2)Deeply analyze the impact of the
differences of human capital structure and age
structure on the migration of gravity center of
population and economic growth in Chongqing; (3)
Construct the index of influencing factors of GDP,
and analyze the influencing factors of economic
differences among regions in Chongqing and the
spatial spillover effect of economic development.
ACKNOWLEDGMENTS
This research was funded by Humanities and Social
Sciences Research Project of Chongqing Municipal
Commission of Education of China in 2020
(20SKGH174)
REFERENCES
Anselin L. (1995) Local indicators of spatial association -
LISA. Geographical Analysis, 27: 93-115.
Bin J.Y, Tang X.B, Li M. (2018) On the Spatial Coupling
Distribution Between Population and Economic
Development in the Counties of Hunan Province.
Journal of Natural Science of Hunan Normal
University, 41: 1-8.
Cai Z.J, Lu Y, Hua C. (2016) Spatial and Temporal
Evolution of County Population and Economic
Agglomeration in Guangxi. Geospatial Information,
14: 13-16.
Chen L, Li X, Yao Y. (2018) Effects of population
agglomeration on urban economic growth in China.
Acta Geographica Sinica, 73: 1107-1120.
Chongqing Statistics Bureau, Chongqing Statistical
Yearbook http://www.cqdata.gov.cn/.
Ding X.H, Gao X.Y, Gao X.C. (2014) On the Spatial
Pattern and Coupling between the Population and
Economy of Qinghai—Tibetan Plateau from 2000 to
2010. Journal of Tibet University, 29: 34-42.
Guan D.J, Tan J, Zhang M.J. (2017) Spatial Coupling
Distribution of population and Economic Development
In Chongqing. Human Geography, 2017(02): 122-128.
Huang D.K, Zhao Y.L. (2016) Spatial-temporal evolution
of county population and economic disparities in
Guizhou province. Journal of Guizhou Normal
University (Natural Sciences), 34: 16-25.
Klaus P. (2014) The non-monotonous impact of population
growth on economic prosperity. Economics
Letters,2014,124(1).
Lian X.M, Wu J.H. (2018) Dynamics of Spatial Pattern
between Population and Economies in Northeast
China[J]. Population Journal,2018(01):45-55.
Liu G.C, Zhang H, Liu Z.C. (2017) A Study on the Spatial
and Temporal Evolution of Population Focus and
Economic Center of Gravity. Jounrnal of Harbin
University of Commerce, 2017(05): 58-67.
Liu X.M, Su W.C, Guan D.J. (2013) On Spatial Coupling
Distribution between Population and Economic in the
Three Gorges Reservoir Area of Chongqing. Journal of
Chongqing Normal University (Natural Science), 30:
37-43.
Liu Z.B, Zheng L.X. (2013) The Analysis of Distribution
of Population and Economy for Henan Province.
Journal of Anyang Teachers College, 2013(5): 73-79.
Luca S. (2016) From sprawl to compactness and back:
population dynamics (1848–2011) and the economic
structure of a Mediterranean city.
GeoJournal,2016,81(2).
Luca S. (2018) Population growth and the economic crisis:
understanding latent patterns of change in Greece,
2002–2016. Letters in Spatial and Resource
Sciences,2018,11(2).
Mikiko O. (2015) Population ageing and economic growth
in Japan. International Journal of Sociology and Social
Policy,2015,35(11/12).
P. A. P. Moran. (1948) The Interpretation of Statistical
Maps. Journal of the Royal Statistical Society. Series B
(Methodological), 10: 243-251.
Ren K.L, Zhu Z.L, Shou M.T. (2016) Study on the Space-
time Coupling between Population and Economic in
BDEDM 2022 - The International Conference on Big Data Economy and Digital Management
646

Urban Agglomerations along the Yellow River in
Ningxi. Modern Urban Research, 2016(10): 91-96.
Wang G.X, Qin Z.Q. (2013) Study on the Change of the
Spatial Relation between Population and Economy in
Shanxi Province. Economic Geography, 33: 29-35.
Wesley E, Peterson F. (2017) The Role of Population in
Economic Growth[J]. SAGE Open,2017,7(4).
Xu S, Tang N, Wei D. (2013) The evolution of population
gravity center and economy gravity center in Xian
based on GIS. Journal of Northwest University (Natural
Science Edition), 46: 985-989.
Yang G.M, Zhang F, Zhang F.T. (2021) Spatiotemporal
changes in efficiency and influencing factors of China’s
industrial carbon emissions. Environmental Science
and Pollution Research, 28: 36288–36302.
Zhang J, Run D.S. (2018) Study on the Evolution Law and
Driving Factors of the Synergistic Evolution of
Population and Economy in the Yangtze River Delta.
Modern Economic Research, 2018(12): 84-92.
Zhou Y, Tu J.J, Lu D.B. (2011) Study On The Relationship
Between Population And Economic Spatial
Distribution And Its Dynamic In Chongqing[J].
Economic Geography,11: 1781-1785.
Spatiotemporal Dynamic Evolution of Population and Economy in Chongqing
647
