
The Activity of Microalgae in Ballast Water based on Microfluidic
Chip Electrokinetic Technology
Runzhe Sun
1a
, Zhen Li
2b
, Zhen Liu
3c
, Na Li
3d
and Yongxin Song
3e
1
China Classification Society Tianjin Office, Tianjin 300457, China
2
CRRC Changchun Railway Vehicles CO., LTD, Changchun 130000, China
3
Department of Marine Engineering, Dalian Maritime University, Dalian 116026, China
Keywords: Ballast Water, Detection of Microalgae Activity, Contour Detection, Optical Flow.
Abstract: To control the marine bio-invasions in ballast water, the regulatory discharge standards specify the number
of viable organisms in ballast water treatment. It is an important task to determine the activity of microalgae
after ballast water treatment. In the current study, five kinds of microalgae were detected on microfluidic
chip. The electrokinetic velocity (EV) and diameter of microalgae were measured manually using an optical
microscope. Finally, the contour detection and Lucas-Kanada (L-K) Optical Flow technique were used to
calculate the diameter and velocity of microalgae, respectively. The result found that the EV of different
species of living microalgae decreases with increasing diameter. The EV of dead Pyramimonas sp.,
Platymonas and Prorocentrum donghaiense decreased to 0 μm/s. In addition, the L-K optical flow
technique can obtain the movement velocity of microalgae at any time, which can improve the detection
accuracy. Those study demonstrate that the development of a new field ballast water analysis instrument
based on contour detection and L-K optical flow technique is of great significance.
1 INTRODUCTION
1
During the daily operation, the ships have a large
number of ballast water in addition to transporting a
variety of cargo. However, the ballast water contains
large amounts of biological communities and
pathogens, which are the main sources of invasive
species in freshwater and marine ecosystems
(Sieracki et al., 2014). According to statistics, 3,000
species migrate with ballast water every day. The
foreign biological invasion will not only destroy the
biodiversity and ecological environment of the
original waters, but also have a serious negative
impact on the utilization of Marine resources and
Marine economy worldwide (Lymperopoulou and
Dobbs, 2017). In addition, the biological
characteristics of many microorganisms can promote
intrusion in ballast water. Because they have a high
ability to reproduce asexually and form dormancy
a
https://orcid.org/0000-0002-7696-1962
b
https://orcid.org/0000-0002-8071-8068
c
https://orcid.org/0000-0002-2504-7062
d
https://orcid.org/0000-0002-0621-2720
e
https://orcid.org/0000-0001-9877-4335
stages, which will increase the chance of successful
invasion(Ruiz et al., 2000). The microalgae were the
main phytoplankton to be detected in ballast water.
Therefore, detection of microalgae activity after
ballast water treatment is an important part of the
inspection process. Currently, the main technology
to detect algae activity include flow cytometry,
chlorophyll fluorescence and cell staining (Song et
al., 2021).
Flow cytometry is an instrument for analysing
cell parameters based on optical principles. The
main principle is to disperse the samples to be
detected into suspension and dye with fluorescent
reagent. Under the irradiation of excitation light
source, the living cells will emit fluorescence, and
the photodetector can judge the activity of
microalgae by detecting the fluorescence intensity of
the cells (Joachimsthal et al., 2004). Compared with
epifluorescence direct counting, flow cytometry has
a higher degree of automation (Joachimsthal et al.,
2003). However, flow cytometry has limited
accuracy in detecting low concentrations of cells.
The technicians required to have certain technical
capacity, which led to some limitations of flow
cytometry in the detection of ship ballast water.
Sun, R., Li, Z., Liu, Z., Li, N. and Song, Y.
The Activity of Microalgae in Ballast Water based on Microfluidic Chip Electrokinetic Technology.
DOI: 10.5220/0011201100003443
In Proceedings of the 4th International Conference on Biomedical Engineering and Bioinformatics (ICBEB 2022), pages 283-287
ISBN: 978-989-758-595-1
Copyright
c
2022 by SCITEPRESS – Science and Technology Publications, Lda. All rights reserved
283
Microalgae contain chlorophyll for
photosynthesis (Li et al., 2021). When the
chlorophyll is irradiated by an external laser, its
internal energy is in an unstable state. During the
transition from the ground state to excited state,
chlorophyll absorbs the energy brought by the
external laser. Eventually, the electrons return to
their ground state and the excess energy is released
outward as fluorescence. Therefore, the activity of
microalgae can be characterized by measuring
the intensity of fluorescence. However, some
microalgae do not
have chlorophyll, such as
microalgae living in the deep sea, cyanobacteria and
heterotrophs, which cannot be detected by
chlorophyll fluorescence technology (Steinberg et
al., 2011).
The cell staining can be divided into non-
fluorescent staining and fluorescent staining. Neutral
red and Trypan blue are commonly used in non-
fluorescent staining. Neutral red or Trypan blue dyes
can only stain living or dead algae, respectively
(Bradie et al., 2017; Stehouwer et al., 2013).
Fluorescence staining with fluorescein diacetate
(FDA) is a popular method for phytoplankton
vitality assessment. However, FDA could not stain
all living microalgae, which underestimated the true
number of viable microalgae (Hyun et al., 2018). In
addition, this method can only estimate the number
of microalgae by the total fluorescence intensity,
rather than accurately calculate the number of
microalgae (Song et al., 2021).
As mentioned above, all three methods have
certain limitations. Therefore, it is still necessary to
develop new technologies for microalgae activity
detection. For most microalgae, the negative charge
on cell surface is due to the presence of carboxyl,
amino, hydroxyl and phosphate anionic groups
(Keller et al., 2015). The surface charge and Zeta
potential of microalgae changed with the species and
growth process (Ives, 1959). In this study, we first
inactivated the algae with sodium hypochlorite.
Then, the electrokinetic velocity (EV) of live and
dead microalgae in ballast water was measured.
Meanwhile, image processing methods such as edge
detection and Lucas-Kanada (L-K) Optical Flow
technique are used to optimize the measured
parameters in the process of electric motion. A
method of microalgae activity detection based on
flow velocity is proposed, and the core objective is
to provide a method basis for ballast water
compliance.
2 MANUSCRIPT PREPARATION
2.1 Preparation of Microalgae
Chlorella vulgaris (C. vulgaris), Dunaliella salina
(D. salina), Pyramimonas sp., Platymonas and
Prorocentrum donghaiense (P. donghaiense) were
used in the experiments. The experiments need
living and death of algae. So, we inactivated
microalgae by treating them with 10 mg/L sodium
hypochlorite for 5min. Then, the method of neutral
red was used to stain microalgae in vivo to verify the
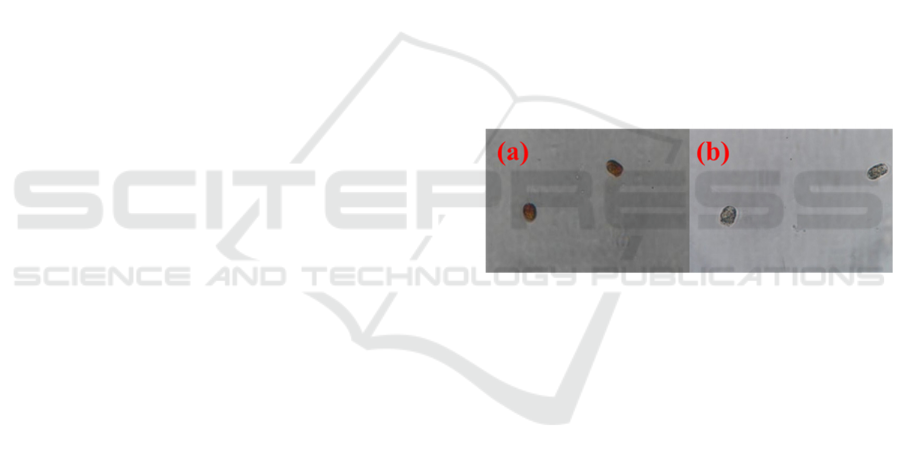
cell activity (Olsen et al., 2015). According to the
staining results, microalgae have been inactivated
after sodium hypochlorite treatments (Figure. 1). To
enable microalgae to be added to the microfluidic
chip, the living or dead algae were centrifuged for 3
min at 4000 rpm with a centrifuge (Eppendorf 5424,
GER). After abandoning the supernatant, 10% PEG
was added into the 1.5 mL centrifuge tube and
centrifuged again. PEG-living microalgae mixture
and PEG-dead microalgae mixture were obtained
respectively.
Figure 1: Illustration of neutral red staining for
Pyramimonas sp. (a) living algae and (b) dead algae.
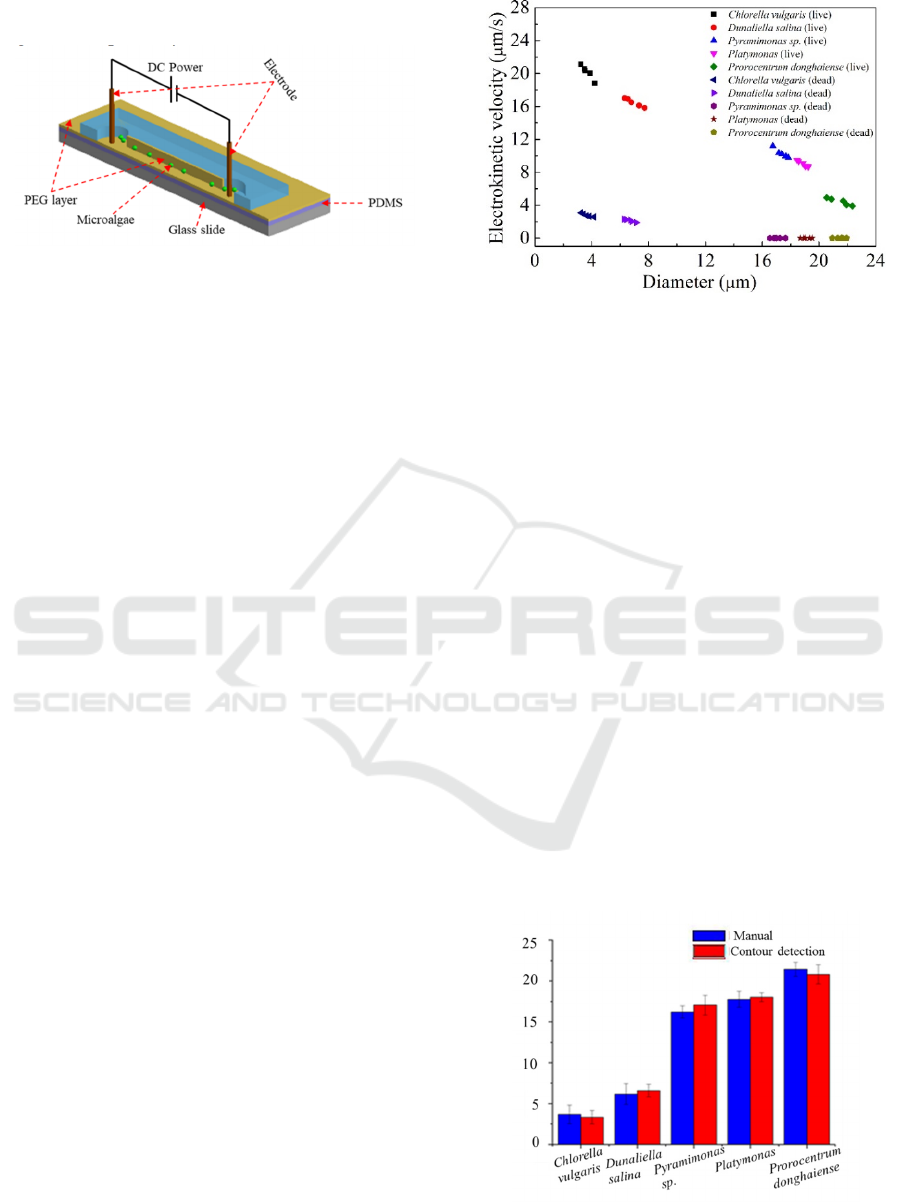
2.2 Microchannel System
The microchannel (1 cm×100 µm×25 µm, length ×
width × height) and the slide coated with PDMS
were immersed in 10% PEG solution for 10 min.
Afterwards, the excess solution on the microfluidic
chip was dried and at 80 °C for more than 10 h in the
drying oven. Finally, the modified microfluidic chip
was obtained (Song et al., 2021) (Figure. 2).
The positive and negative platinum electrodes
are placed at the exit and entrance of the
microchannel, respectively. Add 10 μL PEG-
microalgae mixture and 10 μL 10% PEG solution to
the inlet and outlet of the channel, respectively.
Meanwhile, adjust the liquid level at both ends of
the channel and apply an electric field of 50 V/cm
after keeping the microalgae stationary. The
movement distance of microalgae was recorded
under the inverted optical microscope imaging
system (TI-E, Nikon, Japan). The diameter and EV
ICBEB 2022 - The International Conference on Biomedical Engineering and Bioinformatics
284
of microalgae were calculated by manual and
algorithm respectively.
Figure 2: Schematics of microfluidic chip.
2.3 Second Section
The target microalgae were extracted by background
subtraction method to eliminate the influence of
background. Then, we used the OTSU method to
binarize the extracted target microalgae to reduce the
internal texture. Finally, Canny operator is used to
detect its edge. To remove the contour error caused
by texture, the erode function in OpenCV is used to
corrode the image. The L-K optical flow technique
based on image pyramid is realized by
calcopticFlowpyrLK function, and the optical flow
of corresponding corner points is predicted.
3 RESULT AND DISCUSSION
3.1 Manual Measurement of
Electrokinetic Velocity and
Diameter in Algae
The relationship between EV and diameter of living
microalgae in this experiment is shown in Figure. 3.
The EV of different species of microalgae decreases
with increasing diameter. For instance, the EV of C.
vulgaris is found from 21.13 μm/s to 18.83 μm/s
when the diameter ranges from 3.23 μm to 4.21 μm.
In general, the EV is related to the number of
anionic groups on the cell surface, gravity effect and
friction effect on the channel wall. Therefore, the
different sizes of microalgae are affected to different
degrees, resulting in differences in EV. According to
the dead microalgae, the average EV of C. vulgaris,
D. salina, Pyramimonas sp., Platymonas and P.
donghaiense decreased to 2.79 μm/s, 2.13 μm/s, 0
μm/s, 0 μm/s, and 0 μm/s with the inactivation,
respectively (Figure. 3).
Figure 3: The relationship between algae diameter and EV
measured by manual measurements.
The main reason for the decrease of velocity may
be that the stop of algae metabolism and the
passivation of surface anionic groups lead to the
decrease of Zeta potential.
3.2 Contour Detection
The contour detection method was used to measure
the size of 50 randomly selected microalgae
samples. The results were compared with the manual
measurement, as shown in Figure. 4. The size of C.
vulgaris, D. salina, Pyramimonas sp., Platymonas
and P. donghaiense differed by 0.35 μm, 0.41 μm,
0.84 μm, 0.27 μm and 0.62 μm from that measured
manual measurement, respectively. It was found that
manual measurement had a better effect on large
microalgae (Pyramimonas sp., Platymonas and P.
donghaiense), while contour detection was more
advantageous for small microalgae (C. vulgaris and
D. salina). Therefore, the technology of contour
detection can not only improve the detection
accuracy of diameter parameters in algae, but also
reduce the work of experiments.
Figure 4: Detection results of algae by contour detection
and manual measurements.
The Activity of Microalgae in Ballast Water based on Microfluidic Chip Electrokinetic Technology
285

3.3 Lucas-Kanada Optical Flow
Technique
As shown in Table 1, the EV of living microalgae
was measured by L-K Optical Flow technique. The
same species of microalgae had similar EV at
different locations in the culture medium. The
average EV of C. vulgaris, D. salina, Pyramimonas
sp., Platymonas and Prorocentrum donghaiense was
21.81 μm/s, 15.36 μm/s, 10.24 μm/s, 8.45 μm/s and
4.77 μm/s, respectively. In addition, we also
measured the EV of dead microalgae, in which we
found that the average EV of Pyramimonas sp.,
Platymonas and P. donghaiense decreased to 0 μm/s
(Table 1). For small microalgae, the velocity of C.
vulgaris and D. salina decreased to 2.84 μm/s and
2.36 μm/s, respectively.
In order to verify the reliability of the L-K
Optical Flow technique, the results are compared
with the manual measurements. The EV deviation of
living C. vulgaris, D. salina, Pyramimonas sp.,
Platymonas and P. donghaiense measured by the
above two methods was 0.91 μm/s, 0.96 μm/s, 0.52
μm/s, 0.76 μm/s and 0.42 μm/s, respectively. In
addition, the velocity deviation of dead C. vulgaris
and D. salina was 0.24 μm/s and 0.22 μm/s,
respectively (Table 1). The main reason for the
above deviation is that the measurement result of L-
K Optical Flow technique depends on tracking the
movement displacement of the marked pixel level
corner point between two frames. Then, calculate the
instantaneous velocity from the displacement.
However, manual measurement may have artificial
errors in the process of distance marking and timing.
In contrast, the L-K Optical Flow technique can get
the speed at any time and more accurate velocity
results.
Table 1: EV of algae was measured by L-K optical flow technique and manual measurements.
C. vulgaris D. salina Pyramimonas sp. Platymonas
P. donghaiense
Live Dea
d
Live Dea
d
Live Dea
d
Live Dea
d
Live Dea
d
L-K Optical Flow 21.81 2.84 15.36 2.36 10.24 0 8.45 0 4.77 0
Manual 20.90 2.60 16.32 2.14 10.76 0 9.21 0 4.35 0
Deviation 0.91 0.24 0.96 0.22 0.52 0 0 0 0 0
4 CONCLUSIONS
In this study, we propose a method to judge
microalgae activity based on EV for evaluating the
viability of algae after ballast water treatment. The
EV of five different species of microalgae was
measured manually by using a microfluidic chip.
The result showed that the EV of different species of
living microalgae decreases with increasing
diameter. The EV of dead large microalgae
(Pyramimonas sp., Platymonas and P. donghaiense)
decreased to 0 μm/s, while the small algae of C.
vulgaris and D. salina decreased to 2.84 μm/s and
2.36 μm/s, respectively. In addition, to avoid time-
consuming and susceptible to human factors in the
process of manual measurement, the EV parameters
of microalgae are optimized by contour detection
and L-K Optical Flow technique. It reduces the
influence of human factors on EV measurement and
improves accuracy.
ACKNOWLEDGEMENTS
This work was supported by the financial support of
the National Natural Science Foundation of China
(51679023, 51979019) to Y. Song.
REFERENCES
Bradie, J., Gianoli, C., He, J., Lo Curto, A., Stehouwer, P.,
Veldhuis, M., Welschmeyer, N., Younan, L., Zaake,
A., and Bailey, S. (2017). Detection of UV-treatment
effects on plankton by rapid analytic tools for ballast
water compliance monitoring immediately following
treatment. Journal of Sea Research 133, 177-184.
Hyun, B., Cha, H.-G., Lee, N., Yum, S., Baek, S.H., and
Shin, K. (2018). Development of an ATP assay for
rapid onboard testing to detect living microorganisms
in ballast water. Journal of Sea Research 133, 73-80.
Ives, K.J. (1959). The significance of surface electric
charge on algae in water purification. Journal of
Biochemical & Microbiological Technology &
Engineering 1, 37-47.
Joachimsthal, E.L., Ivanov, V., Tay, J.-H., and Tay, S.T.L.
(2003). Flow cytometry and conventional enumeration
ICBEB 2022 - The International Conference on Biomedical Engineering and Bioinformatics
286

of microorganisms in ships’ ballast water and marine
samples. Marine Pollution Bulletin 46, 308-313.
Joachimsthal, E.L., Ivanov, V., Tay, S.T.L., and Tay, J.H.
(2004). Bacteriological examination of ballast water in
Singapore Harbour by flow cytometry with FISH.
Marine Pollution Bulletin 49, 334-343.
Keller, R.P., Drake, J.M., Drew, M.B., and Lodge, D.M.
(2015). Linking environmental conditions and ship
movements to estimate invasive species transport
across the global shipping network. Diversity and
Distributions 17, 93-102.
Li, N., Liu, Y., Liang, Z., Lou, Y., Liu, Y., Zhao, X., and
Wang, G. (2021). Influence of fuel oil on Platymonas
helgolandica: An acute toxicity evaluation to amino
acids. Environmental Pollution 271, 116226.
Lymperopoulou, D.S., and Dobbs, F.C. (2017). Bacterial
Diversity in Ships’ Ballast Water, Ballast-Water
Exchange, and Implications for Ship-Mediated
Dispersal of Microorganisms. Environmental Science
& Technology 51, 1962-1972.
Olsen, R.O., Hess-Erga, O.K., Larsen, A., Thuestad, G.,
Tobiesen, A., and Hoell, I.A. (2015). Flow cytometric
applicability to evaluate UV inactivation of
phytoplankton in marine water samples. Marine
Pollution Bulletin 96, 279-285.
Ruiz, G.M., Fofonoff, P.W., Carlton, J.T., Wonham, M.J.,
and Hines, A.H. (2000). Invasion of coastal marine
communities in North America: Apparent patterns,
processes, and biases. Annual Review of Ecology &
Systematics 31, 481-531.
Sieracki, J.L., Bossenbroek, J.M., Lindsay, C.W., and
Mckindsey, C.W. (2014). A Spatial Modeling
Approach to Predicting the Secondary Spread of
Invasive Species Due to Ballast Water Discharge. Plos
One 9, e114217.
Song, Y., Li, Z., Feng, A., Zhang, J., Liu, Z., and Li, D.
(2021). Electrokinetic detection and separation of
living algae in a microfluidic chip: implication for
ship’s ballast water analysis. Environmental Science
and Pollution Research 28, 22853-22863.
Stehouwer, P.P., Liebich, V., and Peperzak, L. (2013).
Flow cytometry, microscopy, and DNA analysis as
complementary phytoplankton screening methods in
ballast water treatment studies. Journal of Applied
Phycology 25, 1047-1053.
Steinberg, M.K., Lemieux, E.J., and Drake, L.A. (2011).
Determining the viability of marine protists using a
combination of vital, fluorescent stains. Marine
Biology 158, 1431-1437.
The Activity of Microalgae in Ballast Water based on Microfluidic Chip Electrokinetic Technology
287
