
Construction of Symptom-cause Knowledge Graph based on Named
Entity Recognition and Relation Extraction
Pengcheng Zhou
1a
, Honghai Feng
1,* b
, Jun Li
1c
, Yaju Wei
1d
, Ruihui Hou
1e
and Yanyan Chen
2f
1
Computer and Information Engineering College, Henan University, Jinming Street, Kaifeng, China
2
Henan University Library, Henan University, Kaifeng, China
cyy_2010@126.com
Keywords: The Symptom, Relation Extraction, Knowledge Graph, Natural Language Processingd.
Abstract: The symptom-cause knowledge graph can provide great helps for doctors and machines to diagnose
diseases. However, the existing web texts that include the causes of symptoms are too trivial and complex.
This paper uses the entity recognition and relation extraction methods and proposes a algorithm to extract
the causes of symptoms by semantic rules. According to the relationships of semantic elements in sentences
a knowledge graph of symptom-cause is built. The process is as follows: Firstly, a large number of texts that
include cause-symptom are obtained. Secondly, the high-frequency sentence patterns of the symptom-cause
relationships are summarized. Thirdly, an algorithm for extracting the cause information of the
corresponding symptoms according to the sentence rules are designed. From the obtained 2856331 web
pages, 108693 of the causes corresponding to 40236 symptoms are obtained.
1 INTRODUCTION
1
With the development and application of
information techniques, a large amount of medical
knowledge such as the causes of symptoms exist in
massive medical texts. Either the doctors or the
machines all need the causes of symptoms to
diagnose the diseases. If we can extract the
corresponding causes of symptoms from the texts,
then an accurate and comprehensive knowledge
graph can be established and the knowledge graph
will provide a better diagnosis of diagnosis.
At present, many scholars have studied the
medical knowledge graph. Based on the intelligent
guidance algorithm of multi-source knowledge
graph fusion, Liu Daowen constructed a symptom-
disease knowledge graph (Liu 2021). The symptom-
disease knowledge graph currently includes 38
hospitals, 6220 symptoms and 60736 symptom-
a
https://orcid.org/0000-0003-3152-9743
b
https://orcid.org/0000-0002-5821-3872
c
https://orcid.org/0000-0003-3152-9743
d
https://orcid.org/0000-0002-1300-1139
e
https://orcid.org/0000-0002-7279-1505
f
https://orcid.org/0000-0002-8820-9049
related disease relationships. Scholar Hongying Zan
used two methods that are based on rules and deep
learning to extract knowledge from multi-sources
medical texts that include 6310 diseases, 19853
drugs, and 1237 diagnostics, treatments and devices
(Zan 2020). Yang Fu combined top-down and
bottom-up methods to semi-automatically construct
a heart disease knowledge graph from Chinese texts
(Fu 2020). Zhao Xuejiao (Zhao 2019) constructed a
knowledge graph of obstetrics and gynecology by
using entity classification and relationship extraction
technology, but the data was relatively sparse.
DiseaseKG
is a disease information knowledge
graph generated by OpenKG technology.
DiseaseKG contains 8808 disease nodes, 6047
symptom nodes and 14963 disease symptom
relationships. The DrugBank database (Medical
prescription 2018) established in Canada in 2006 is
an online accessible drug information database that
currently included 14348 drug terms, 2679 approved
small molecule drugs, 1427 approved biological
agents, etc.
Some symptoms may be caused by diseases or
diets in daily life. For example, there are at least two
causes of bellyache, the first is disease enteritis, and
the second is that the human eat a pear after eating
Zhou, P., Feng, H., Li, J., Wei, Y., Hou, R. and Chen, Y.
Construction of Symptom-cause Knowledge Graph based on Named Entity Recognition and Relation Extraction.
DOI: 10.5220/0011200500003438
In Proceedings of the 1st International Conference on Health Big Data and Intelligent Healthcare (ICHIH 2022), pages 17-24
ISBN: 978-989-758-596-8
Copyright
c
2022 by SCITEPRESS – Science and Technology Publications, Lda. All rights reserved
17
much mutton. So the causes of symptoms are very
complex. The symptom-cause knowledge graph
should be constructed to help doctors or machines to
diagnose the patients.
2 TEXT DATA ACQUISITION
2.1 Page Setup
There is a lot of information about the causes of
symptoms on the Internet. Many professional
websites contain information about the causes
summarized by doctors. For example, the website of
seeking medical advice, 39 Health Net, global
hospital and other professional websites provides a
lot of data and reference for this design. These data
are widely distributed and not systematically
summarized. It is difficult for people to obtain and
learn, and it is more cumbersome for computers.
Therefore, we first need to crawl the symptom cause
information from the Internet, and then normalize
and structurize the data through natural language
processing.
Crawler is an automatic method of getting texts
from the network. This paper selects Java crawler to
crawl network data, and uses Jsoup to parse URL
addresses, HTML text contents and multithreading
technologies to process crawled data.
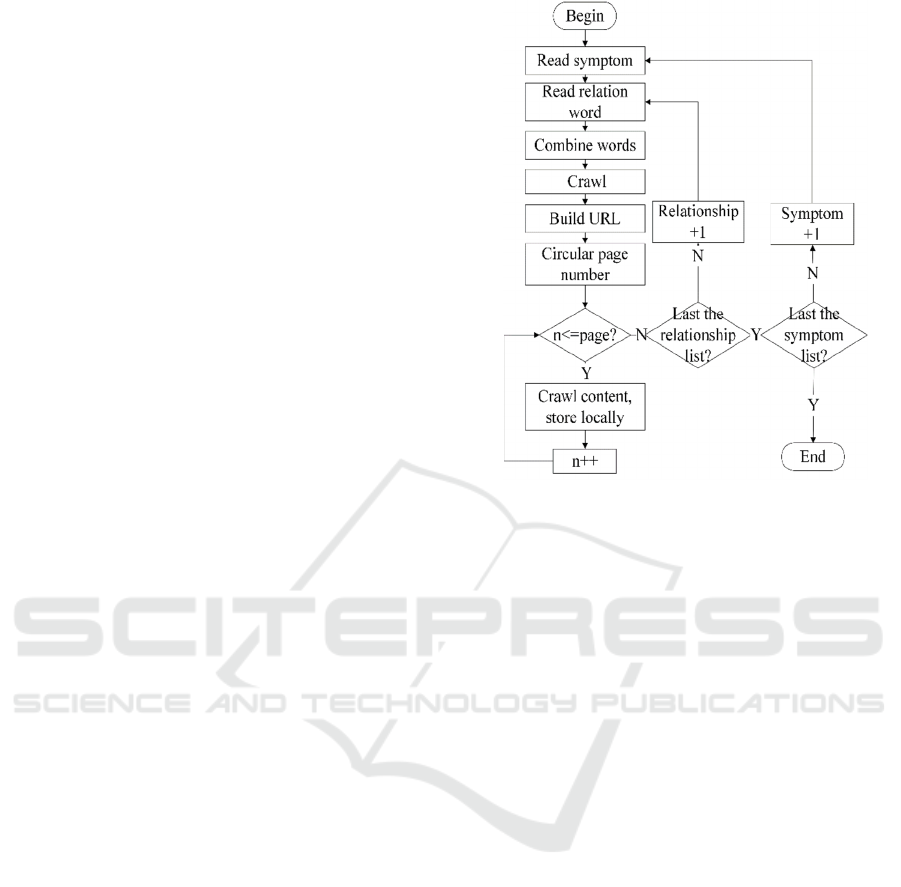
The design process of a crawler is as follows:
Step 1: read the existing 83694 symptom list
from the local disk, and use the symptom list as the
key words.
Step 2: determine the number of pages crawled
for each symptom, and carry out multi-pages cyclic
crawling web pages.
Step 3: Through the relationship words and
symptoms building URL.
Step 4: get the secondary link according to the
URL, iterate enter the secondary link, crawl and
store the web page locally.
Because of the huge amount of data, the
multithreads technique is used. With the
multithreads technique the crawled data are written
to the local disk and the crawling efficiency is
greatly improved. The crawling process is shown in
the flow chart (Figure 1).
Figure 1: Crawling process.
2.2 Algorithm for Extracting Cause
List of Symptoms
The crawled HTML files include various formats, so
if processed directly, there will be many impurities.
Therefore, Jsoup is used to remove the tags in the
web pages. The HTML content in some fixed
websites is relatively standard, so different tags have
different meanings. After checking up the HTML
source codes, it is found that the main tags of body
information are < title > < / Title >, < head > < /
head >, < p > < / p>, etc. According to tags of the
title in the article and regular expression, the cause
list of a symptom can be extracted from the article.
The following example describes the cause list of
the chronic diarrhea:
"Chronic diarrhea:
1:Intestinal infectious diseases: ① chronic
amoebic dysentery; ②chronic bacterial diseases.
2:Intestinal non-infectious inflammation: ①
inflammatory. bowel disease (Crohn's disease and
ulcerative colitis); ②radiation enteritis.
3:Tumors: ① colorectal cancer; ② colonic
adenomatosis (polyp); ③ malignant lymphoma of
the small intestine. "
The information in the first-level list can be
extracted with the regular expressions "[1-3]:. {1,}:".
and the information in the second-level list with "[①
|②|③].{1,}?;" . Additionally, from the above list the
upper concept "tumor" and the lower concepts
ICHIH 2022 - International Conference on Health Big Data and Intelligent Healthcare
18
"colorectal cancer" and "small intestinal malignant
lymphoma" can be obtained.
In order to build a list extraction algorithm to
process the text that includes a list, the list semantic
element set should be defined at first. The algorithm
is shown in Table 1.
Table 1: List semantic elements algorithms.
Grou
p
Serial number
1 One,two,three,four,five,six,seven
2 Ⅰ,Ⅱ, Ⅲ, Ⅳ, Ⅴ, Ⅵ, Ⅶ, Ⅷ, Ⅸ, Ⅹ
3 1, 2, 3, 4, 5, 6, 7, 8, 9, 10
4 (1), (2), (3), (4), (5), (6), (7), (8)
5 1), 2), 3), 4), 5), 6), 7), 8)
6
①, ②, ③, ④, ⑤, ⑥, ⑦, ⑧, ⑨, ⑩
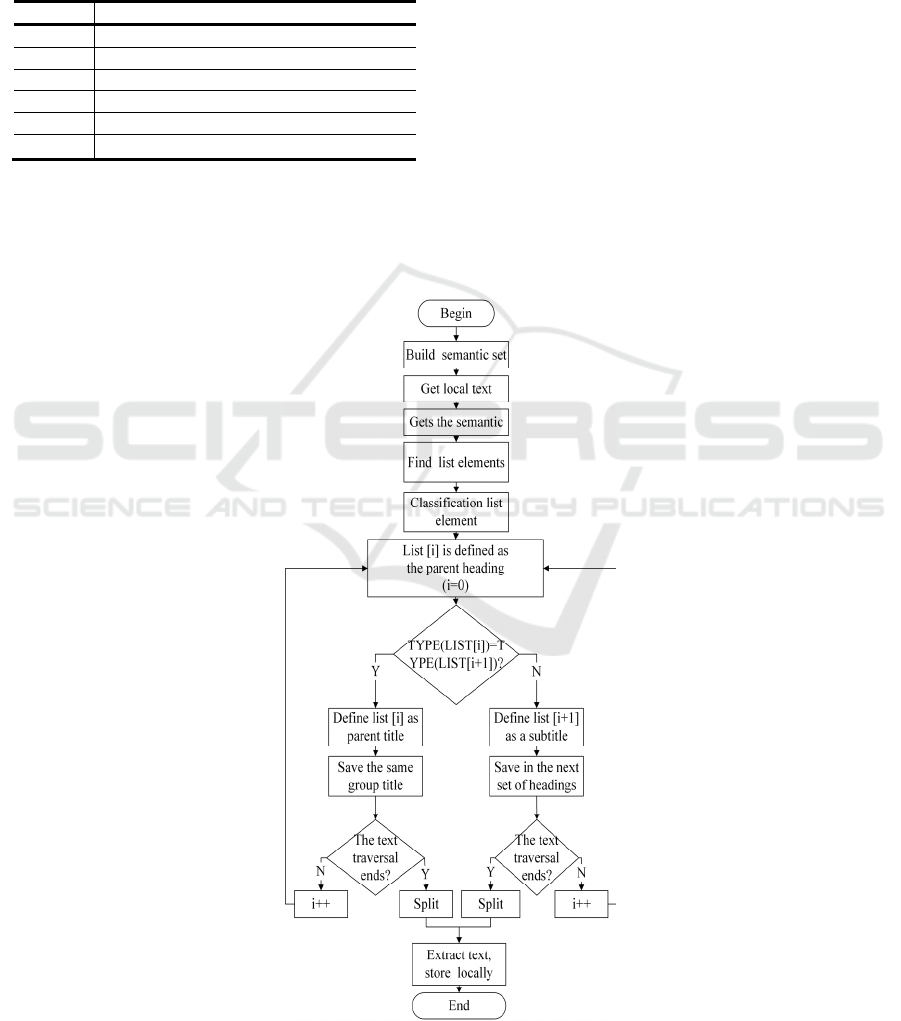
Each group is regarded as the same level title,
and the list extraction algorithm is as follows:
Get local text.
Gets the collection of semantic elements for
the list in the above table.
Find all list elements in the texts.
Categorize and index all list elements in the
text according to the 1-6 groups constructed
from the table above.
The serial number that appears at first is
regarded as the first-level title.
Increases the index of the list element in the
text by one.
Contrast the element after the subscript is
incremented by one with the previous element.
In the same group, it is the same level title,
otherwise it is defined as the next level title.
Loop through the last three steps until all the
list elements in the text are traversed.
Each level of title is divided according to the
list elements completed by classification.
Finally, regular expression is added to extract
the title of each level.
The flow chart of the specific algorithm for
extracting cause list of a symptom is shown in the
Figure 2.
Figure 2: Algorithm for extracting cause list of symptoms.
Construction of Symptom-cause Knowledge Graph based on Named Entity Recognition and Relation Extraction
19
Additionally, there are a large number of
impurity marker words in most of the crawled web
pages such as "answer", "advertisement",
"consultation". The sentences with these impurity
marker words should not be included in the
information extraction process.
3 SENTENCES OF SYMPTOMS
3.1 Semantic Element Sets
The sentences that describe the causes of symptoms
have their fixed patterns, and the patterns have their
fixed semantic elements.
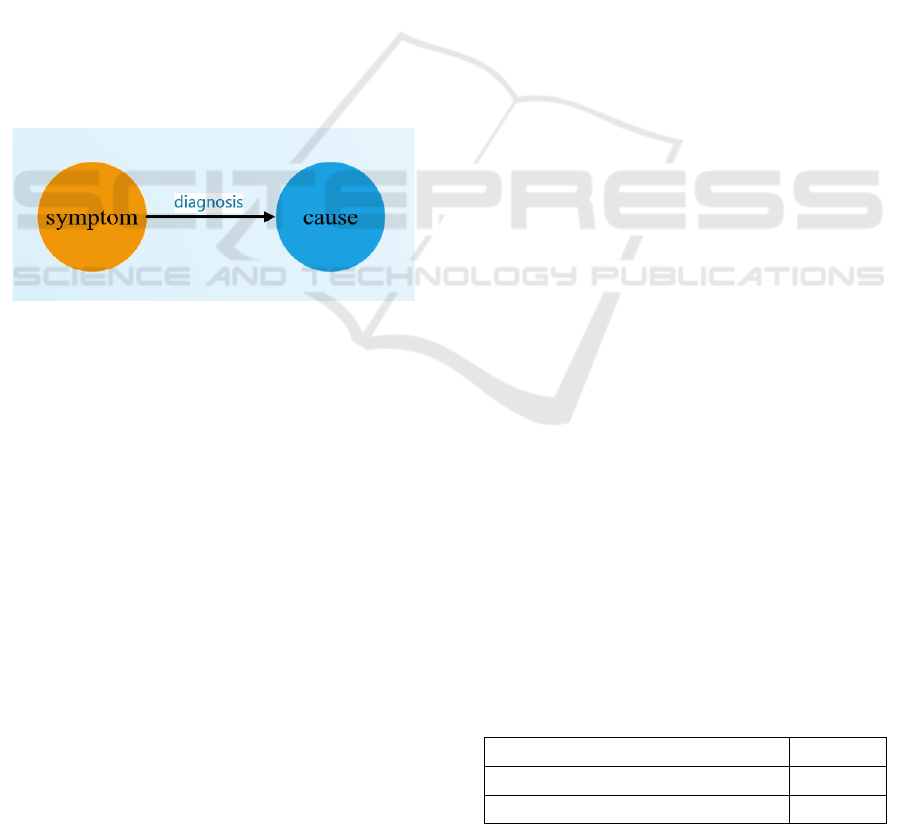
In order to summarize a sentences, sentence
patterns can be found, and the semantic elements in
the sentence patterns can be obtained too. The entity
words can roughly be divided into two types or
semantic elements, namely symptoms and causes,
and the relationship between them is relational
words. As shown in Figure 3, we constructed the
(symptom, diagnosis, cause) triplet.
Figure 3: (symptom, diagnosis, cause) Triplet.
For example, the sentence " (Weakness in both
legs is caused by osteoporosis)"."(weakness in both
legs)"," (osteoporosis)"are entity words. " (is caused
by)"is a relation word. After studying a large
number of sentences that describe the symptoms and
their causes, Some semantic elements are induced,
and below gives some examples.
Concrete causes of symptoms=
{osteoporosis,amoebic dysentery,...}.
Upper concepts of concrete causes={causes,
factors, reasons, …}.
Preposition words={because, by, since, due to,
with,...}.
Relation words={cause, induce, bring out,
form,...}.
Patients={patients, invalid, sick,...}.
List item={one,two,three,1,2,(1),(2),1), ① , ②
,follows,...}.
Punctuation marks or words that embody peer
or parallel meaning{comma, or, and, in
addition, also,...}.
Adverbs={will, often, generally, more, can,
very, also can, possibly,...}.
Impurity words{ Question, choice, multiple
choice, single choice, answer, advertisement,
consultation,…}.
3.2 Sentence Structure
Some sentence patterns are summarized from a large
number of web texts. Below are some examples.
Every pattern is on a separate line and a example
follows on the below line.
A+B1+C+B2:A(polyuria)B1(by)C(diabetes)B
2(caused).
C+B2+A:C(diabetes)B2(bring out) A
(polyuria).
C+ X+B2 + A + S:C(diabetes) X (is)
B2(bringout) A (polyuria)S(factor).
(B2+)A+S+X+C:B2 (bringout) A(polyuria)
S(reason) X(is) C(diabetes).
C+P+B2+A:C(diabetes)P(patient)B2(fell)A(th
irsty).
There will be more than one cause after
(factor)S, and only part of the cause can be obtained
with a single sentence pattern. Therefore, when
constructing sentence pattern rules after the
completion of clauses, the semantic elements after
(factor) S cannot be classified as a entity word, the
different causes need to be distinguished according
to the punctuation marks or words that embody peer
or parallel meaning above.
A+S:c1+c2+c3:A(polyuria)S(factor):c1(diabet
es), c2(prostatitis), c3 (bladder tumor).
c1+c2+c3+ B2+A:c1(innutrition),c2(habits
and customs), c3(Poor working environment)
B1 (cause) A (Swallowing pain).
The sentence pattern will cover most of the
syntax in describing symptom-cause relations. The
more perfect and comprehensive the sentence
patterns are, the higher the information extraction
recall rate is.
After statistics, we find that the above 9 sentence
patterns have the highest occurrence frequency, and
the specific occurrence frequency is shown in the
table2 below.
Table 2: Sentence rule frequency table.
Sentence structure Frequency
A+B1+C+B2 385
C+B2+A 40
ICHIH 2022 - International Conference on Health Big Data and Intelligent Healthcare
20
C+ X+B2 + A + S 128
(B2+)A+S+X+C 315
A+S:c1+c2+c3 120
A+F+S:c1+c2+c3 99
c1+c2+c3+F+B2+A 268
C+P+B2+A 92
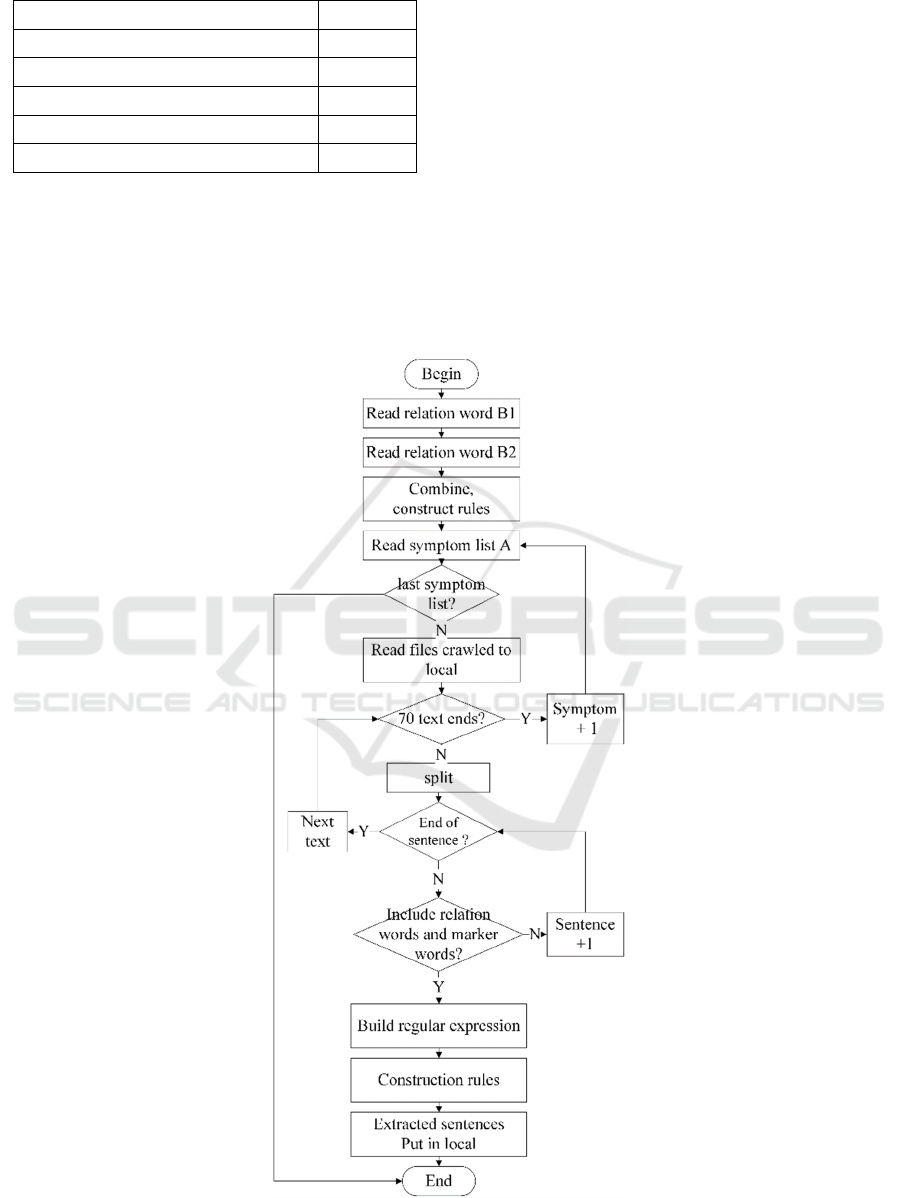
3.3 Extraction of Reasons of Symptoms
The extraction algorithm can be applied to all the
sentence patterns mentioned above, but this section
uses one of the sentence patterns, A+B1+C+B2, to
introduce the extraction algorithm.
Summarizes the sentence patterns.
Construct symptom set A, relational word set
B1+B2.
Determine whether the crawled data is empty
or garbage file.
Read text data, split sentences with periods.
Judge whether the sentence contains
symptoms, key words and markers.
Constructing regular expression based on
relation words B1 + B2.
According to the regular expression, each
short sentence is processed to extract the
causes.
Store the cause of the symptom locally.
The flow chart of extraction algorithm is shown
in Figure 4.
Figure 4: Flow chart of extraction algorithm.
Construction of Symptom-cause Knowledge Graph based on Named Entity Recognition and Relation Extraction
21
The symptom causes extracted by symptom
entity words and relational words include both
disease causes and non disease causes, so we can
distinguish them by disease word formation. Make
the cause more accurate and perfect.
Through a large vocabulary of disease, we
statistics out disease started to the highest frequen
and B to extract the disease causes, We can
distinguish a cause from a disease by the beginning
and end of disease formation.
When we learn relation word B through
symptom entity word A and symptom entity word C,
we find that the words with high frequency are the
relational words we want, while the words with less
frequency are usually impurities. Therefore, we can
build an array based on B learned by A + C to store
relational word B and frequency at the same time,
According to the results, the threshold value is set to
20, that is, the relation words with frequency more
than 20 are needed, and frequency less than 20 is
impurities.
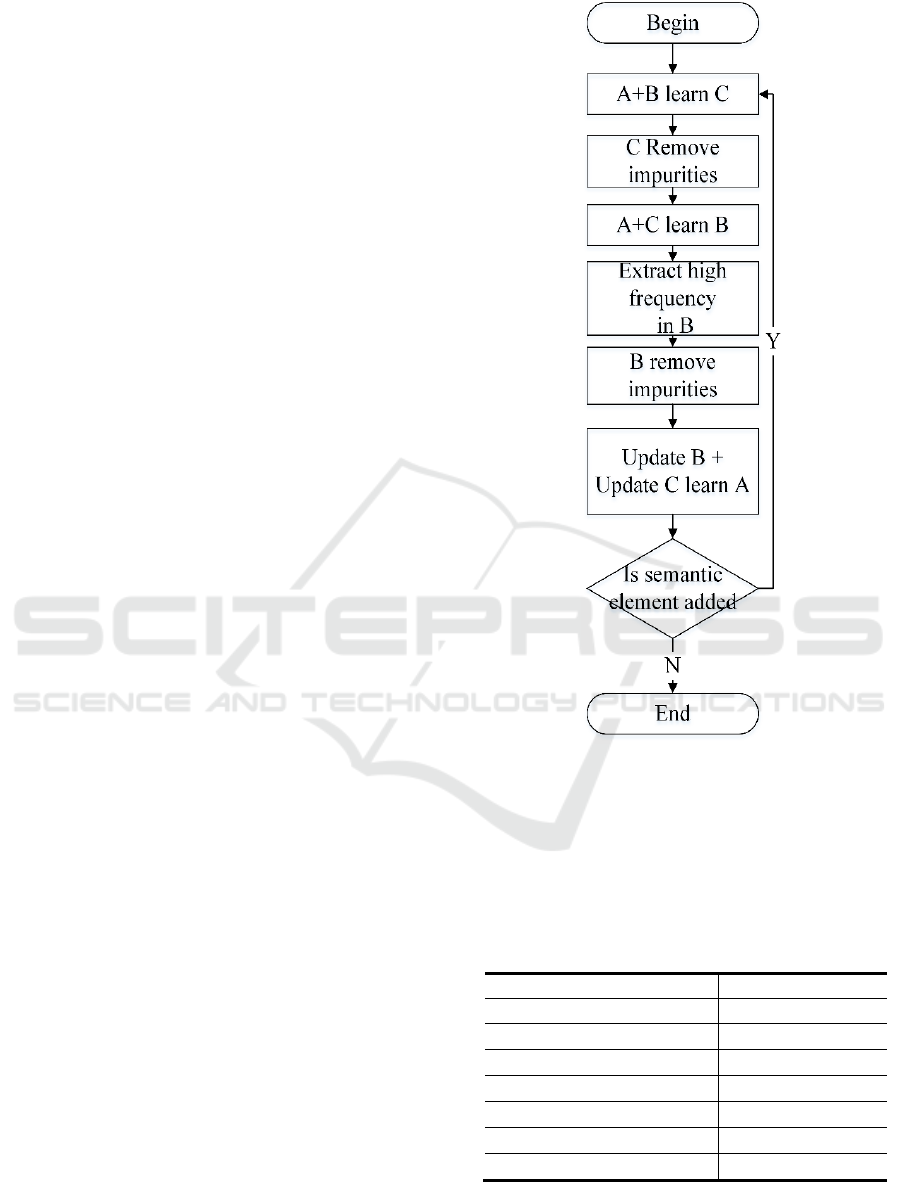
3.4 Mutual Extraction of Two Entity
Words and Their Relation Words
Iteratively
With the extraction algorithm, the corresponding
causes C can be learned by symptom A and relation
word B1 + B2, and if B1 + B2 is regarded as B, C
can be induced by in putting A and B. Similarly, B
can be learned by in putting A and C, and A can be
extracted by in putting B and C. The iteration flow
chart is shown in Figure 5.
Learn cause set C with the symptom A and
relation word B.
Update C: delete duplicate causes in set C;
delete impurities artificially and automatically
with algorithms.
Learn relation word set B with A and updated
C.
Update B: delete duplicate relation words in
set B; delete impurities artificially and
automatically with algorithms.
Learn symptom set A with updated B and
updated C.
Update A: delete duplicate symptoms in set A;
delete impurities artificially and automatically
with algorithms.
Return 1) with updated A, B, and C iteratively
until A, B, and C can not be updated.
Figure 5: Flow chart of Iteration.
Through the results of mutual learning, we get
the following conclusions:
By learning symptom entity word A and
symptom entity word C, we can get relation word
B1, as shown in Table 3.
Table 3: The frequencies of relation words b1 table.
Relation words B1 Frequency
( due to) 135
( because of) 98
caused by (by) 82
affected by (by) 43
is about (is) 72
is related to(is) 67
is a connection with 61
ICHIH 2022 - International Conference on Health Big Data and Intelligent Healthcare
22
By learning symptom entity word A and
symptom entity word C, we can get relation word
B2, as shown in Table 4.
Table 4: The frequencies of relation words b2 table.
Relation words B2 Frequency
induced 83
arouse 81
lead 76
effect 52
relate 25
associated 38
cause 44
developed 33
resulting 25
By learning symptom entity word A and relation
word B2, We can get cause entity word C ,the
highest frequency of impurities as shown in Table 5.
Table 5: The frequencies of Impurities in causes C.
Impurities in causes C
Frequency
pathology
86
analyse
77
Not yet
63
clear
32
sure
24
explicit 23
unknown 21
factor 20
theory
20
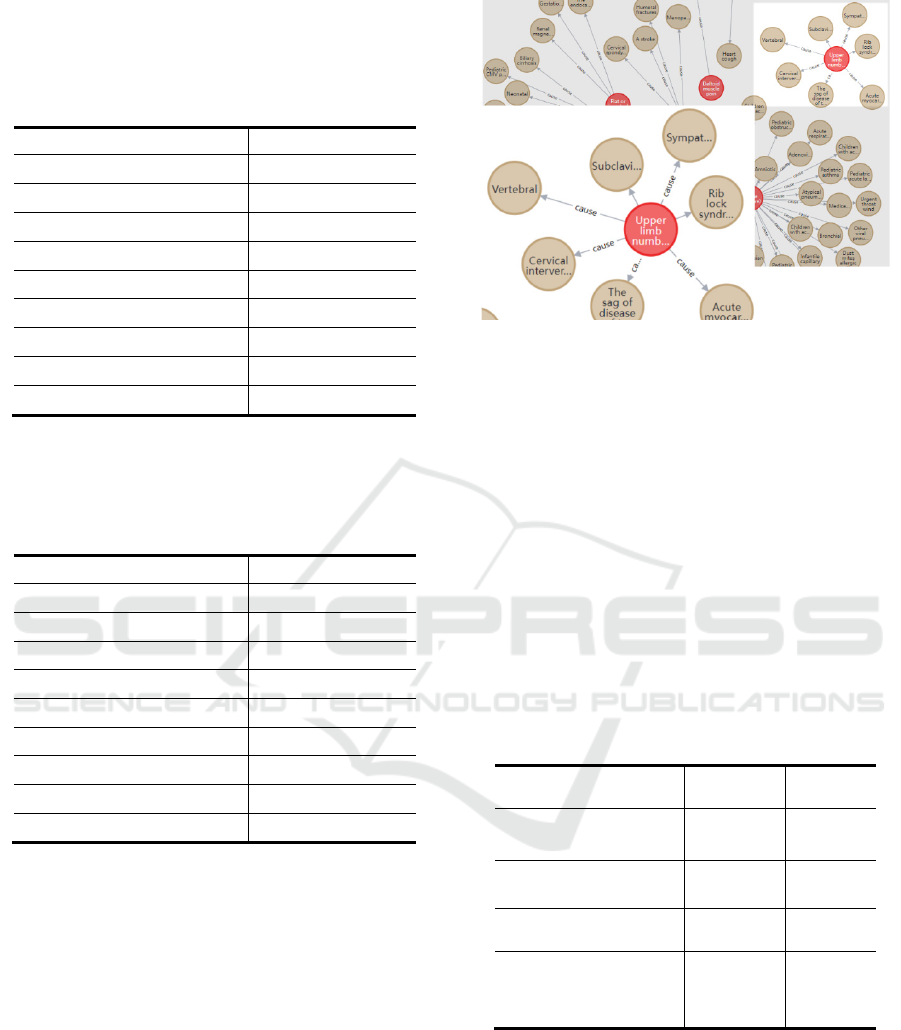
3.5 Construction of Knowledge Graph
Knowledge graph is kind of graphic database, the
graphic database is a kind of database. Based on
graph theory, it gives and shows the relations
between entities. It can be widely used in large and
complex data storage scenarios. Neo4j is the most
commonly used graphics database because of its
high performance, practicality, lightweight and other
advantages.
In this paper, the symptom entity nodes
combination is imported into neo4j, and the
symptom causes knowledge graph (SCKG) is
obtained. It includes 40236 symptom nodes, 60963
symptom cause nodes and 70865 relations. Figure 6
shows part of the SCKG knowledge graph.
Figure 6: SCKG knowledge graph.
4 RESULT
Chen Pubo (Chen 2019) the accuracy of extracting
entity relationship results by specific text tagging
algorithm is 0.79 and the recall rate is 0.71.
Compared with the algorithm established in this
paper, the accuracy of this paper is 0.83, the recall
rate is 0.70. Liu Kan used SVM model to build
knowledge-based map, the accuracy of the algorithm
is 0.67, the recall rate is 0.56. The accuracy of DNN
model is 0.69 and the recall is 0.60(Liu Kan,2020).
Compared with other similar algorithms, the recall
and accuracy of this algorithm are shown in Table 6.
Table 6: Comparison with other algorithms.
Name Recall rate
Accurac
y
Text annotation
algorithm
0.71 0.79
SVM model
algorithm
0.56 0.67
DNN model
al
g
orith
m
0.60 0.69
Algorithm of
extracting etiology
0.70 0.83
The disease-cause knowledge graph constructed
in this paper is compared with that constructed by
other scholars, and it is found that about 5000
symptom entities of Omaha correspond to 87646
disease entities of symptom-related diseases. By
comparing 2498 symptom entities of CMEKG,
40,236 symptoms and 108,693 causes were obtained
from 2856331 Network data text. Comparison with
other public knowledge maps is shown in Table 7.
Construction of Symptom-cause Knowledge Graph based on Named Entity Recognition and Relation Extraction
23
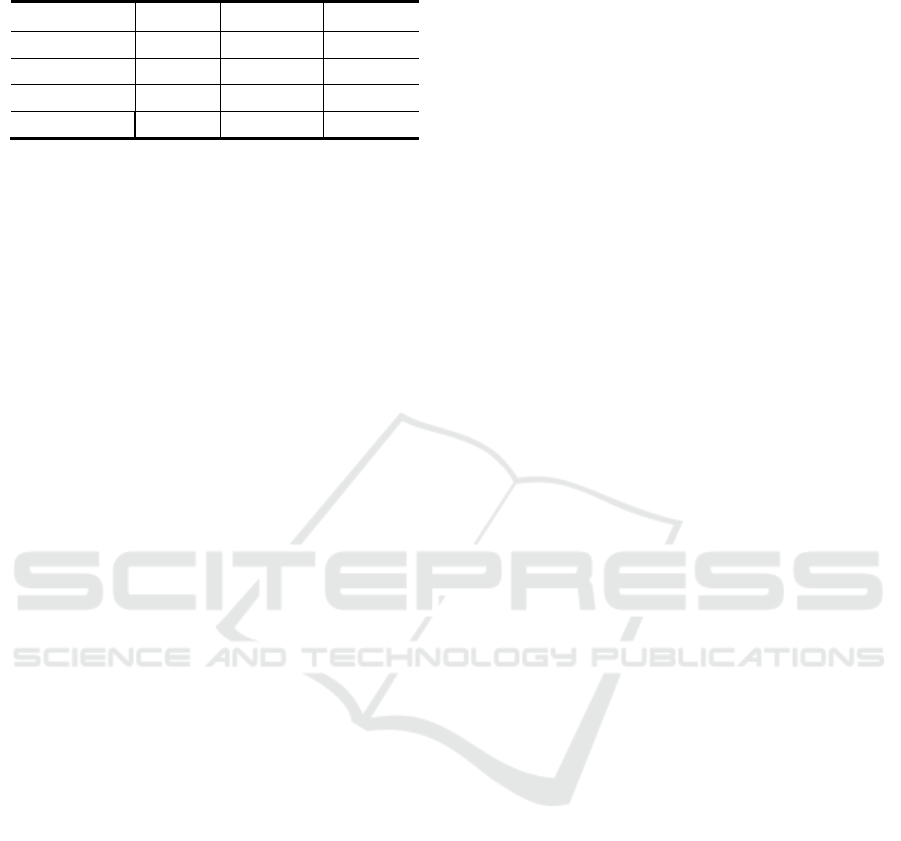
Table 7: Compared with other knowledge mapping.
Name Disease Symptom Relations
DES 86021 15029 26282
DiseaseKG 8808 6047 14963
CMeKG 6310 2498 unknown
SCKG 108693 40236 120865
5 CONCLUSIONS
In this paper, 2856331 pages are crawled by medical
websites and web crawlers, and a semantic
extraction algorithm is designed. Finally, a
knowledge graph is created by using Neo4j graph
database.
However, there are still some deficiencies in this
paper, which need to be improved as follows:
(1).When describing the corresponding causes of
symptoms in the text, there are not only the causes
and inducements of symptoms, but also the
inducements corresponding to the inducements. The
previous problems are not dealt with in detail in this
paper, and all the inducements and inducements of
the inducements are classified as the inducements of
symptoms.
(2).Synonym recognition is still unsolved in this
paper.
REFERENCES
Chen Pu Bo, Hua Shao Yun, Ma Jia Li, Wang louin,and
Jiawei sun,research on free text entity relationship
extraction and knowledge atlas construction method
for grid based on syntactic analysis ,CAS Academy of
electric Sciences Co,Ltd., China network electric
projects (Beijing) science and technology center,
Journal of computer engineering and
Applications,proceedings of the 3rd Conference on
smart grids -- smart electricity use, 2019:167-171.
Hongying Zan, Huayi Dou, Yuxiang Jia, Tongfeng Guan,
Byambasuren ODMAA, Kunli Zhang, Zhifang Sui.
"Construction of Chinese medical knowledge graph
based on multi-source texts" [J]. Journal of Zhengzhou
University (SCIENCE EDITION), 2020,52 (02): 45-
51
Liu Daowen, Ruan Tong, zhangchentong, qiujiahui,
zhaijie, Heping, gexiaoling. Intelligent guiding
algorithm based on multi-source knowledge graph
fusion [j]. Journal of Chinese information, 2021,35
(01): 125-134
Liu Kan, Zhang Yaquan. Auxiliary diagnosis of
complications based on medical knowledge map [J].
Chinese Journal of information, 2020,34 (10): 85-93 +
104.
Medical prescription, drugbank database, 2018,
<https/go.drugbank.com/.>.
Xuejiao Zhao. "The research and implementation of
knowledge graph of Obstetrics and Gynecology" [J].
Digital medicine, China, 2019,14 (01): 3-5
Yang Fu, Maofu Liu, Rui Qiao."Construction of Chinese
Knowledge Graph of Heart Disease"[J].Journal of
Wuhan University (Science Edition)
,2020,66(03):261-267.
ICHIH 2022 - International Conference on Health Big Data and Intelligent Healthcare
24
