
Eutrophication Evaluation and Influencing Factors of Daheiting
Reservoir
Lihui
Cao
1,2 a
, Xubo Lv
2b
, Kun Lei
2c
, Libiao Yang
2,* d
and Dianwu Wang
1,* e
1
College of resources and Environmental Sciences, Hebei Agricultural University, Baoding, Hebei, 071000, China
2
Chinese Academy of Environmental Sciences, Beijing, 100012, China
Keywords:
Eutrophication, Evaluate, Factors, Daheiting Reservoir.
Abstract:
Taking Daheiting Reservoir as an example, the water quality changes were studied by investigation and field
sampling, and the water eutrophication and the main influencing factors were evaluated and analyzed in view
of the gradually serious eutrophication of the water body in China. And the results were shown as below: DO
concentration did not reach class II water standards only in the dry season. TN was inferior to class V in dry
and normal season, and class IV in wet season; TP water quality was inferior to class V in dry and normal
season, class III in July in wet season and not exceed the standard in August in wet season. COD
Mn
exceeded
the standard only during normal and wet water periods in August, and the water quality was class III. In dry
season, the water body was slightly eutrophic; in normal water period, the water body was slightly to
moderately eutrophic; in the wet season, the water body was slightly eutrophic in July and moderately
eutrophic in August. Principal component analysis showed that temperature, nitrogen and phosphorus
nutrients were the main influencing factors and do, pH and COD
Mn
were the main manifestation factors of
water eutrophication.
1 INTRODUCTION
1
Reservoirs were one of the important sources of urban
drinking water in China. However, most reservoirs
have a series of problems, such as short water
exchange cycle, high basin erosion intensity and anti
seasonal fluctuation, which lead to great instability of
reservoir water quality and potential risks of water
environment (Da, 2020; Wang,2010). The problem of
water eutrophication was preliminarily explored in
the early 20th century (Poikane, 2014), now it has
become the focus of attention. Water eutrophication
destroys aquatic ecosystems all over the world,
foreign countries began to investigate lake
eutrophication in the 1960s, and established relevant
evaluation and prediction models. Due to its complex
mechanism, wide range and difficult treatment, it has
become a hot spot of water ecological security (Qin,
2010, Lu, 2003). The intensification of water
a
https://orcid.org/0000-0003-0903-4621
b
https://orcid.org/0000-0002-5392-5897
c
https://orcid.org/0000-0001-8343-3087
d
https://orcid.org/0000-0002-7444-5112
e
https://orcid.org/0000-0003-3408-6992
eutrophication not only has an adverse impact on
social harmony and stability, but also does serious
harm to people's production and life. Therefore,
scientific and reasonable water quality evaluation and
determination of water eutrophication status were of
great practical significance for water pollution control
and water environment management planning
(Meyer-Reil, 2000, Liu, 2020).
In November 2016, April, July and August 2017,
this paper monitored 10 indicators including water
temperature, total nitrogen, total phosphorus, active
phosphate and Chl.a, evaluated water eutrophication,
and clarified the main influencing factors of water
eutrophication, in order to provide a theoretical basis
for water pollution control of Daheiting reservoir.
244
Cao, L., Lv, X., Lei, K., Yang, L. and Wang, D.
Eutrophication Evaluation and Influencing Factors of Daheiting Reservoir.
DOI: 10.5220/0011197700003443
In Proceedings of the 4th International Conference on Biomedical Engineering and Bioinformatics (ICBEB 2022), pages 244-248
ISBN: 978-989-758-595-1
Copyright
c
2022 by SCITEPRESS – Science and Technology Publications, Lda. All rights reserved
2 MATERIALS AND METHODS
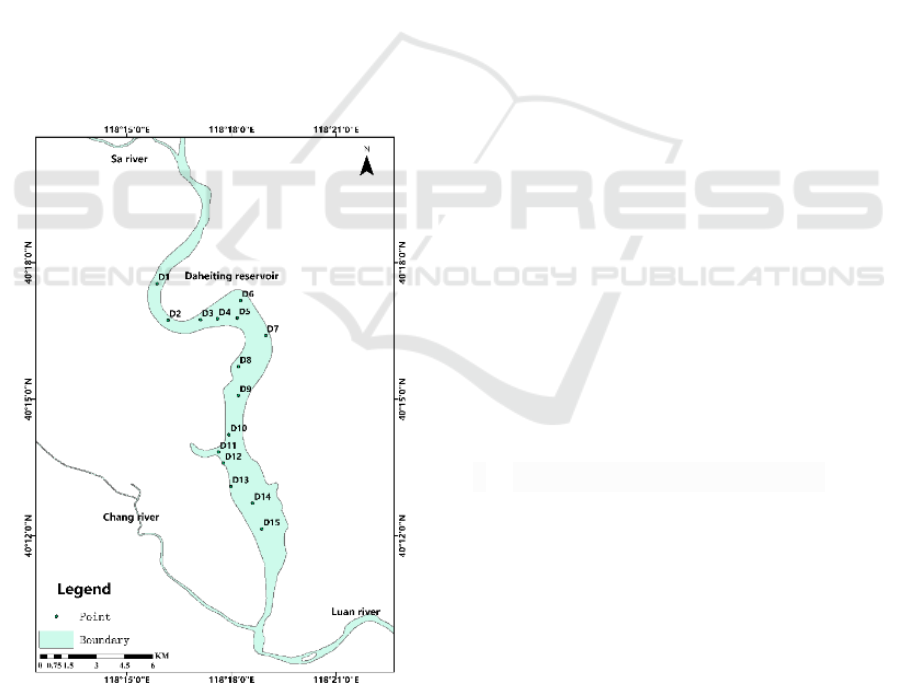
2.1 Overview of the Study Werea
Daheiting reservoir, located in Qianxi County,
Tangshan City, is one of the backbone projects of
Luanhe River Diversion Project Group. The inflow
rivers mainly include Luanhe main stream, Sahe
River, etc. The region has a warm temperate
continental semi humid monsoon climate with four
distinct seasons and obvious dry and wet seasons. The
average annual temperature is 10.1 ℃, the average
annual precipitation is 804.2mm, the total storage
capacity is 337 million m3 and the effective storage
capacity is 224 million m3. The normal pool level is
133.0m and the dead water level is 121.5m. It is a
large type II annual regulation reservoir. 15 sampling
points were evenly arranged in the water werea from
dam front to reservoir tail in Daheiting reservoir
werea, as shown in Figure 1. The water quality
sampling time is November 2016 (dry season), April
2017 (normal season), July and August 2017 (wet
season).
Figure 1: Schematic diagram of sampling points in
Daheiting reservoir.
2.2 Evaluation and Analysis Method
2.2.1 Water Sample Collection and
Monitoring
The water sample is collected with a 2L stainless steel
water collector, put into a 500ml Brown reagent
bottle, and immediately add concentrated H
2
SO
4
for
acidification and preservation. The water temperature
and dissolved oxygen are measured by YSI multi
parameter water quality detector, the transparency is
measured by plug plate, the pH is measured by
portable water quality analyzer, and the temperature,
transparency and pH value are recorded on site. Other
indexes shall be determined according to the fourth
edition of monitoring and analysis methods for water
and wastewater (P A, 2002).
2.2.2 Evaluation Method
Carlson comprehensive nutritional status index (TLI)
method is used for evaluation, and the calculation
formula is:
TLI()=𝑊𝑗
𝑇𝐿𝐼(𝑗)
Where, TLI (∑) is the comprehensive nutritional
status index, WJ is the relevant weight of the
nutritional status index of the j-th parameter, TLI (J)
is the nutritional status index of the j-th parameter,
and N is the number of evaluation parameters.
The comprehensive nutritional index TLI < 30 is
poor nutrition, 30 ≤ TLI ≤ 50 is medium nutrition, 50
< TLI ≤ 60 is mild eutrophication, 60 < TLI ≤ 70 is
moderate eutrophication, and TLI > 70 is severe
eutrophication.
3 RESULTS & DISCUSSION
3.1 Water Quality Analysis of
Daheiting Reservoir
The water quality was evaluated according to the
environmental quality standard for surface water
(GB3838-2002). In November 2016, the average
concentration of do was 4.805 mg/L, which was class
IV water, and did not exceed the standard in other
periods; The average concentration of PO
4
3
-P was
0.288 mg/L at the beginning of the study period, and
gradually decreased to 0.005 mg/L at the end of the
study period. The mean values of TN concentrations
Eutrophication Evaluation and Influencing Factors of Daheiting Reservoir
245
in the four periods were 2.541, 3.508, 1.184 and 1.374
mg/L respectively, exceeding the standard by 5.08,
7.02, 2.36 and 2.74 times respectively; In November
2016, April 2017 and July 2017, the average TP
concentration was 0.268, 0.217 and 0.047 mg/L
respectively, exceeding the standard by 10.72, 8.68
and 0.88 times respectively. In August, TP did not
exceed the standard, and the water quality was
upgraded from inferior class V to class II water; NH3-
N concentration did not exceed the standard in four
periods. In April and August 2017, the average
COD
Mn
concentration was 5.308 and 5.639 mg/L
respectively, exceeding the standard by 1.33 and 1.41
times respectively. In other periods, it did not exceed
the standard, and the water quality was class III water.
3.2 Eutrophication Evaluation of
Daheiting Reservoir
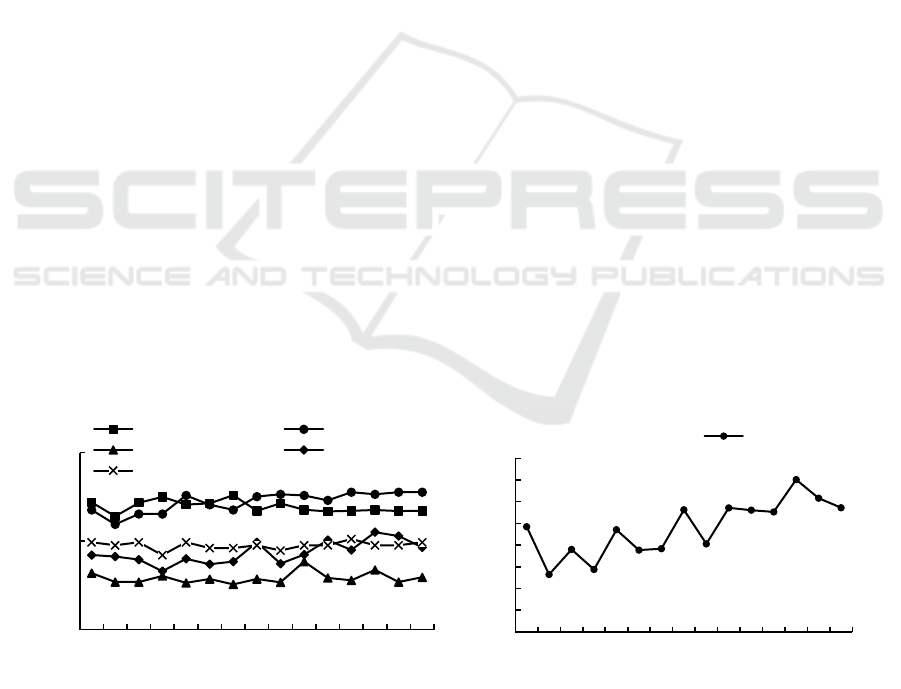
The eutrophication state of Daheiting reservoir in dry
season is shown in Figure 2, the comprehensive
trophic state index ranges from 47.46 to 58.49, with
an average of 51.58. 25% of the water bodies belong
to mesotrophic state, 75% of the water bodies were
slightly eutrophic, and the comprehensive trophic
state is evaluated as slightly eutrophic. The normal
water period can be seen from Figure 3, the
comprehensive nutritional status index ranges from
54.80 to 63.01, with an average of 58.33. 100% of the
water body reaches the degree of eutrophication, and
the comprehensive nutritional status is evaluated as
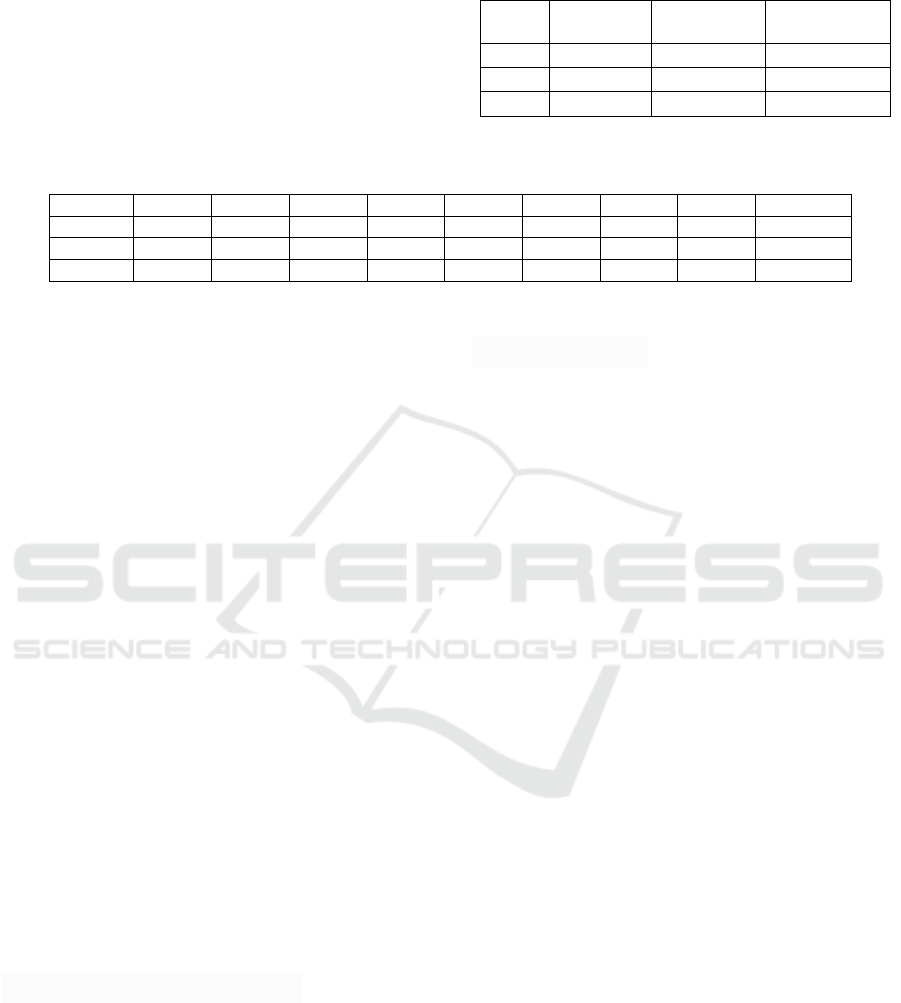
mild to moderate eutrophication. In the wet season in
July, the comprehensive nutritional status index
ranges from 47.32 to 54.80, with an average of 51.17.
37.5% of the water bodies belong to mesotrophic
status, 62.5% of the water bodies belong to mild
eutrophication, and the comprehensive nutritional
status is evaluated as mild eutrophication; In August,
the comprehensive nutritional status index ranged
from 43.93 to 58.51, with an average of 46.47. 66.7%
of the water bodies were in mesotrophic status, 33.3%
of the water bodies were in mild eutrophication, and
the comprehensive nutritional status was evaluated as
mesotrophic. Xue et al. (Yun, 2020) found that the
eutrophication degree of Dongting Lake decreased
successively in summer, autumn, spring and winter,
and Dongting Lake was mainly in medium trophic
state. In the study on eutrophication evaluation of
dajinzhong reservoir, Wang et al. (Wang, 2019) found
that the overall water quality of the reservoir is in a
slightly eutrophic state, and individual wereas were in
a moderately eutrophic state, and the comprehensive
nutritional state index is related to the wet season and
dry season, and the comprehensive nutritional state
index is high in the wet season. In this study, It may
be that the tributary pollutants enter the reservoir
werea, resulting in the accumulation of pollutants,
and the concentration of TN and TP exceeds the
standard seriously, resulting in the aggravation of the
degree of eutrophication. With the continuous
discharge of water from the reservoir and the
influence of rainfall, the concentration of TN and TP
gradually decreases until the TP concentration does
not exceed the standard in the wet season, and the
comprehensive nutritional state of the reservoir water
is medium nutrition.
Figure 2: Eutrophication status of Daheiting reservoir in November 2016.
0
50
100
D1
D2
D3
D4
D5
D6
D7
D8
D9
D10
D11
D12
D13
D14
D15
Value
PT
TLI(TN) TLI(TP)
TLI(CODMn)
TIL(Chla)
TIL(SD)
42
44
46
48
50
52
54
56
58
D1
D2
D3
D4
D5
D6
D7
D8
D9
D10
D11
D12
D13
D14
D15
Value
PT
TIL( ∑ )
ICBEB 2022 - The International Conference on Biomedical Engineering and Bioinformatics
246
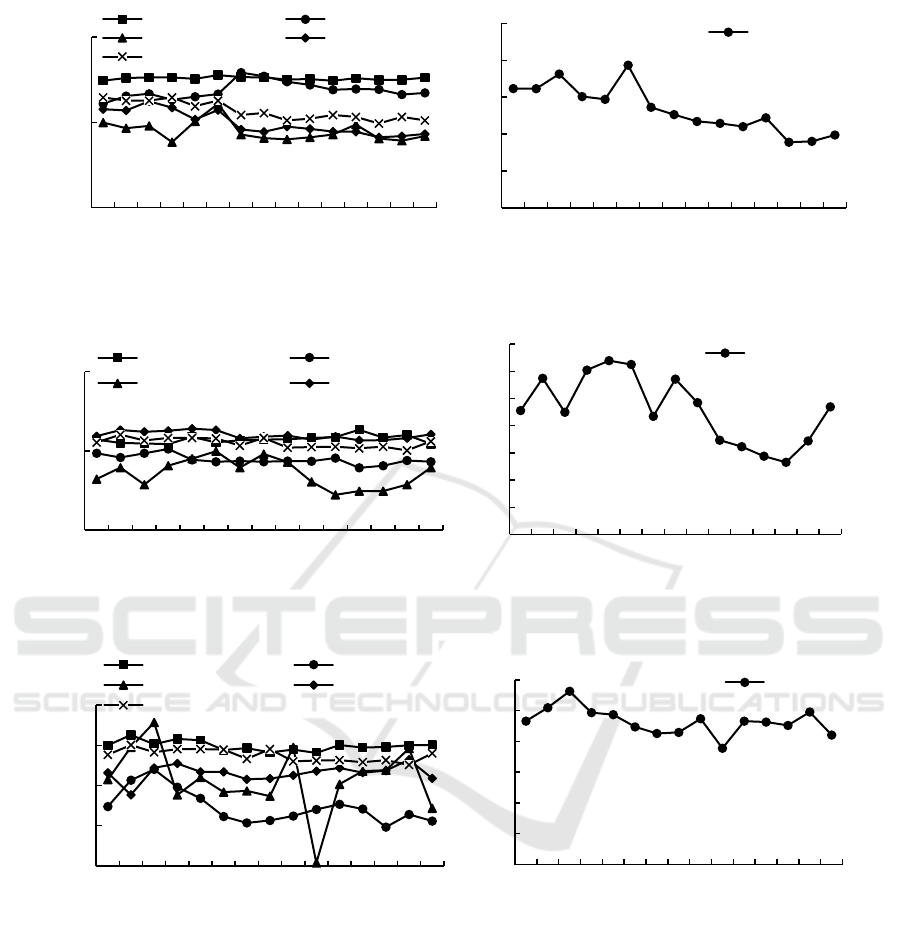
Figure 3: Eutrophication status of Daheiting reservoir in April 2017.
Figure 4: Eutrophication status of Daheiting reservoir in July 2017.
Figure 5: Eutrophication status of Daheiting reservoir in August 2017.
3.3 Analysis on Influencing Factors of
Water Eutrophication in Daheiting
Reservoir
Chl. a is a representative indicator of planktonic algae
biomass, so we focus on the correlation between Chl.
a concentration and other environmental factors.
According to the order of correlation degree, it is DO,
SD, PO
4
3
-P, temperature, pH, TN, TP and COD
Mn
.
Chl. a has a very significant correlation with do, SD,
PO
4
3
-P, temperature, pH, TN and TP, indicating that
TN, TP and PO
4
3
-P were the main nutritional factors
for the growth of planktonic algae, and DO, SD,
temperature and pH were the main environmental
factors for the growth of planktonic algae. Tab 1
shows,the cumulative contribution rate of the three
principal components is 86.193%, the contribution
rate of F1 is 39.435%, the contribution rate of F2 is
34.279%, and the contribution rate of F3 is 12.479%.
Tab 2 shows, the load values of temperature, TN, TP
and PO
4
3
-P on F1 were large, so F1 can be
characterized by temperature and nitrogen and
phosphorus content. The load values of do and pH on
0
50
100
D1
D2
D3
D4
D5
D6
D7
D8
D9
D10
D11
D12
D13
D14
D15
Value
PT
TLI(TN) TLI(TP)
TLI(CODMn)
TIL(Chl.a)
TIL(SD)
45
50
55
60
65
70
D1
D2
D3
D4
D5
D6
D7
D8
D9
D10
D11
D12
D13
D14
D15
Value
PT
TIL( ∑ )
0
50
100
D1
D2
D3
D4
D5
D6
D7
D8
D9
D10
D11
D12
D13
D14
D15
Value
PT
TLI(TN) TLI(TP)
TLI(CODMn)
TIL(Chl.a)
42
44
46
48
50
52
54
56
D1
D2
D3
D4
D5
D6
D7
D8
D9
D10
D11
D12
D13
D14
D15
Value
PT
TIL( ∑ )
0
20
40
60
80
D1
D2
D3
D4
D5
D6
D7
D8
D9
D10
D11
D12
D13
D14
D15
Value
PT
TLI(TN) TLI(TP)
TLI(CODMn)
TIL(Chl.a)
TIL(SD)
0
10
20
30
40
50
60
D1
D2
D3
D4
D5
D6
D7
D8
D9
D10
D11
D12
D13
D14
D15
Value
PT
TIL( ∑ )
Eutrophication Evaluation and Influencing Factors of Daheiting Reservoir
247
F2 were large, and only the load value of COD
Mn
on
F3 is greater than 0.80. It is inferred that temperature,
nitrogen and phosphorus nutrients were the main
influencing factors of eutrophication, and DO, pH and
COD
Mn
were the main manifestation factors of water
eutrophication.
Table 1: Factor eigenvalues and contribution rate of water
environmental indicators after rotation.
Factor Eigenvalue
Contribution
Rate %
Total
Cumulative %
F1 3.549 39.435 39.435
F2 3.085 34.279 73.714
F3 1.123 12.479 86.193
Table 2: Factor load value after rotation of water environment index.
Facto
r
Chl.a T
p
H SD DO PO
4
3-
-P TN TP COD
Mn
F1 -0.366 -0.972 -0.013 0.289 0.008 0.849 0.925 0.893 -0.117
F2 0.657 0.097 0.883 -0.79 0.963 -0.386 0.173 -0.243 0.272
F3 -0.425 0.057 0.226 -0.24 0.125 -0.166 0.194 -0.153 0.853
4 CONCLUSIONS
Based on the results and discussions presented
above, the conclusions are obtained as below:
(1) In dry season, TN and TP exceeded the
standard by 5.08 and 10.72 times respectively, DO
does not meet class II standard, COD
Mn
up to
standard; TN, TP and COD
Mn
exceeded the standard
by 7.06, 8.68 and 1.33 times respectively in normal
water period, DO up to standard; in the wet season in
July, TN and TP exceeded the standard by 2.36 and
0.88 times respectively, and COD
Mn
and DO did not
exceed the standard. In the wet season in August, TN
and COD
Mn
exceeded the standard by 2.74 and 1.41
times respectively, and TP and DO did not exceed the
standard.
(2) The water body is slightly eutrophic in dry
season, slightly to moderately eutrophic in normal
season, slightly eutrophic in July and moderately
eutrophic in August in wet season.
(3) The main influencing factors of
eutrophication in Daheiting reservoir were
temperature and nitrogen and phosphorus nutrients,
and the main performance factors were DO, pH and
COD
Mn
.
ACKNOWLEDGMENTS
Key special project of "global change and response"
of national key R&D plan (2016YFA0600902);
National major special project of water pollution
control and treatment science and Technology
(2018ZX07111002).
REFERENCES
Da W Y, Zhu G W, Li Y X, et al. High frequency changes
of water quality and algae community structure in the
estuary of Xin'anjiang reservoir [J]. Environmental
science, 2020,41 (2): 713-727.
Editorial board of monitoring and analysis methods of
water and wastewater by the State Environmental
Protection Administration. Monitoring and analysis
methods of water and wastewater [M]. 4th Edition.
Beijing: China 9 Environmental Science Press, 2002
Lu X Y, Xu F L, Zhan W et al. Current situation and
development trends in lake eutrophication models[J].
Advances in Water Science,2003,14(6): 792-798.
Liu X, Shi B, Meng J et al. Spatio-temporal Variations in
the Characteristics of Water Eutrophication and
Sediment Pollution in Baiyangdian Lake [J].
Enviroment Science,2020,41(5):2127-2136
Meyer-Reil L A, Koster M. Eutrophication of marine
waters: effects on benthic microbial communities.
Marine Pollution Bulletin, 2000,41(1/6): 255-263.
Poikane S, Portielje R, Berg M, et al. Defining ecologically
relevant water quality targets for lakes in Europe[J].
Journal of Applied Ecology.2014,51(3): 592-602.
Qin B Q, Zhu G W, Gao G et al. A drinking water crisis in
lake Taihu, China: lingkage to climatic variability and
lake management[J].Environmental Management,
2010, 45(1): 105-112.
Wang L J, Zheng B H. Reservoir ecological security
assessment method (I): IROW framework [J]. Lake
Science, 2010,22 (2): 169-175
Wang J J, Chen F C. Water quality status and ecosystem
eutrophication evaluation of dajinzhong reservoir [J].
Southern agriculture, 2019,13 (17): 162-164
Yun X, Liu F J, Liu J L, et al. Annual Variation
Characteristics of Eutrophication in Dongting Lake,
China. 2020, :1-18.
ICBEB 2022 - The International Conference on Biomedical Engineering and Bioinformatics
248
