
Turning Points and Climatic Impacts on the Multi-wave H7N9
Outbreaks in Guangdong Province, China
Piaopiao Zhou
1a
, Wenwen Li
2b
, Xingfeng Huang
3c
, Yuting Wang
3d
and Tian Tang
4,5,* e
1
Zhong De College, Zhengzhou Institute of Engineering and Technology, Zhengzhou, China
2
Department of Public Basic Education, Henan vocational university of science and technology, Zhoukou, China
3
School of Mathematics and Computer Science, Guilin University of Electronic Technology, Guilin, China
4
National Demonstration Center for Experimental Electronic Circuit Education, Guilin University of Electronic
Technology, Guilin, China
5
Guangxi Key Laboratory of Cryptography and Information Security, Guilin University of Electronic Technology, Guilin,
China
Keywords: H7N9, Reproduction Number, Turning Point, Climate Factor.
Abstract: The constant emergence of avian influenza A (H7N9) epidemics posed a huge threat to public health in China
recently. Based on the data of the human reported cases and climate from October 2013 to May 2017, we
employed Richard model, generalized linear model (GLM) and generalized additive model (GAM) to infer
the H7N9 transmission potentials in Guangdong Province, which is one of the important H7N9 epicenter. The
results indicated that the turning points occurred around mid-January, one week after closing live poultry
markets. It was further found that temperature and relative humidity are negatively proportional to the number
of H7N9 cases with the lags of 1-3 and 1-5 weeks, respectively. The number of H7N9 cases has a non-linear
relationship with rainfall and air pressure. These discoveries can provide practical information for risk
assessment and intervention implementation against H7N9 transmissi.
1 INTRODUCTION
Human infections of influenza A (H7N9) virus were
first identified in eastern China in March 2013 (Zhou
2015). Thereafter, five waves of human influenza A
(H7N9) epidemic (including 1533 human cases with
592 deaths) have been reported in China. Guangdong
Province is one of the high-risk areas, where a total of
258 cases have been reported as of December 2017.
Current frequent emergence and rapid expansion of
avian influenza A (H7N9) virus pose a huge threat to
public health in China.
More and more studies have been conducted on
the epidemiology and transmission dynamics of
H7N9 in recent years. Previous studies have found
that human H7N9 infections were associated with the
exposure of live poultry markets (PLMs) (Zhou 2015,
a
https://orcid.org/0000-0003-2583-2252
b
https://orcid.org/0000-0001-8373-0647
c
https://orcid.org/0000-0003-2391-2494
d
https://orcid.org/0000-0001-9051-0810
e
https://orcid.org/0000-0003-2291-3997
Chen 2016, Chen 2013, Bao 2013, Li 2014, Han
2013, Wu 2013), hence LPMs can support the
maintenance, amplification and dissemination of
H7N9 virus (Chen 2016, Chen 2013, Bao 2013, Peiris
2014, Sims 2012). In view of this, closing LPMs has
become the most commonly implemented measures
to control H7N9 transmission. Some studies
evaluated the effects of LPM closure on H7N9-
incidence in humans and found that closing LPMs in
different cities of China can reduced the risk of
human infections by 73%-
99%
(Fourni´e 2014,
Vittoria 2016, Yu 2014, Peiris 2016, Wu 2016, Yuan
2015, Wu 2017, Adam 2015). On the other hand,
several studies were conducted to infer the
associations between H7N9 infection with climate
and environment, but the results exhibited geographic
heterogeneity. For example, Liu et al. found that
Zhou, P., Li, W., Huang, X., Wang, Y. and Tang, T.
Turning Points and Climatic Impacts on the Multi-wave H7N9 Outbreaks in Guangdong Province, China.
DOI: 10.5220/0011197000003438
In Proceedings of the 1st International Conference on Health Big Data and Intelligent Healthcare (ICHIH 2022), pages 11-16
ISBN: 978-989-758-596-8
Copyright
c
2022 by SCITEPRESS – Science and Technology Publications, Lda. All rights reserved
11
temperature and absolute humidity were negatively
associated with H7N9 infection in five Chinese
regions during 2013-2016 (Tao 2018), similar results
was observed in (Li 2015). Yi et al. indicated that
minimum and maximum temperature but not
humidity and daily temperature differences
contributed to human H7N9 infections in China
during 2013/14 seasons (Zhang 2015). Hu et al.
claimed that H7N9 incidence rate in Shanghai during
the spring of 2013 was linked with fortnightly mean
temperature and fortnightly mean rainfall (Hu 2015).
However, to our knowledge, we have not found
related studies on the turning point and
transmissibility of human H7N9 infection in
Guangdong, as well as the climatic effects.
To fill the knowledge gap, in this paper, we went
a further step to explore the transmission dynamics
and the risk factors contributed to H7N9 transmission
in Guangdong Province during 2013-2017. We first
established a Richard model to fit the weekly H7N9
cases to detect the turning point for the outbreak.
Turning points have epidemiological implications,
which is the threshold between acceleration and
deceleration. Identifying the turning points can help
us to examine the impact of intervention measures
relating to the turning point. We then used a
generalized linear model (GLM) and generalized
additive model (GAM) to explore the associations
between the climates and human H7N9 infection,
which enable us to clarify the long-term effects of
climate on human H7N9 infections.
2 MATERIALS AND METHODS
2.1 Study Site
Guangdong Province was selected as the study area
because it was one of the hardest-hit areas by H7N9
in China. This province is situated in the southern
China, with an area of 179,800 square kilometers and
about 100.7 million inhabitants. The climate is
subtropical humid, with short, mild, dry winters and
long, hot, wet summers. The annual mean
temperature is 21.8 centigrades and the annual
accumulate precipitation is 1,789 mm.
2.2 Data
Human H7N9 cases from October 2013 to April 2017
in Guangdong was used in this study. The data was
ex-tracted from the Center for Health Protection of
HongKong
(https://www.chp.gov.hk/sc/resources/29/332.html),
regarding to the number of reported apparent and
confirmed human cases per week. The temperature
and relative humidity during the study period were
downloaded from Guangdong Meteorological
Service (http://www.grmc.gov.cn/).
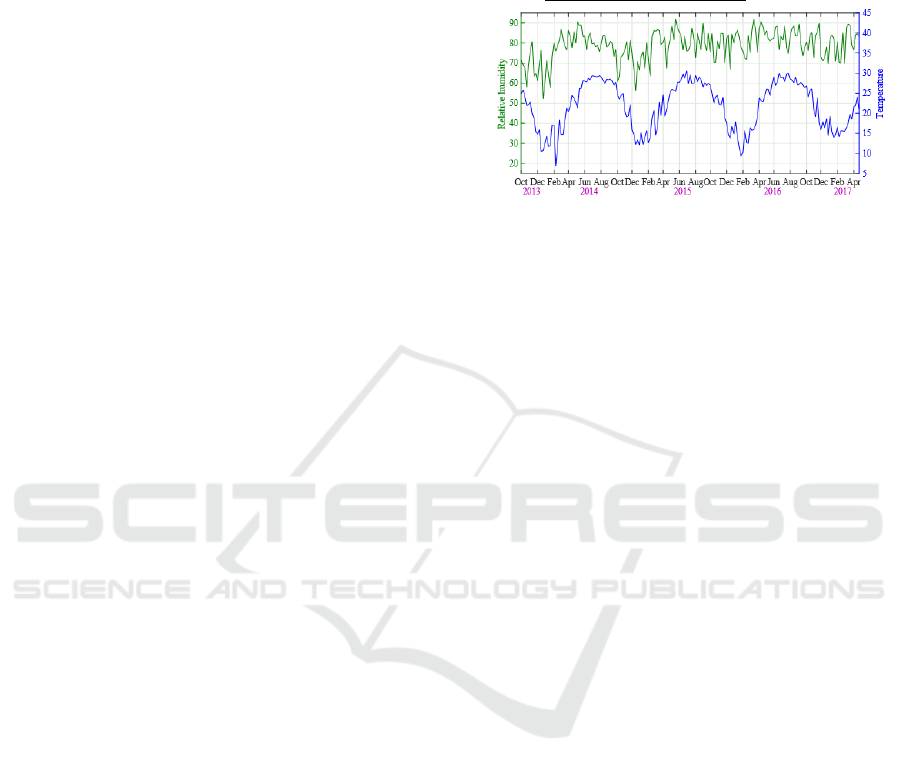
Figure 1: Time series of weekly relative humidity and
average temperature during October 2013 and April 2017.
2.3 Richards Model
The Richards model was widely used to analyze the
development trend and transmission potentials of
infectious diseases (Hsieh 2018, Hsieh 2009, Hsieh
2006), which is written as
α
/1
)(
]1/[)(
m
ttr
eKtI
−−
+=
(1)
where I(t) is the cumulative number of notification
cases at time t, k is the maximum case number over
the course of the outbreak, r is the per capita growth
rate of the infected population, and α is the deviation
exponent of,
m
t
is related to the turning point
i
t
of
the epidemic (or the inflection point of the cumulative
case curve) by the simple formula
./)(ln ratt
im
+=
This parameter has important
epidemiological significance, which indicates the
beginning of a popular phase (from deceleration to
acceleration) or end (from acceleration to
deceleration)
(Hsieh 2018, Hsieh 2009, Hsieh 2006).
The Richards model is a phenomenological model
allowed to describe the evolution of the cumulative
case number
(Hsieh 2018, Hsieh 2009, Hsieh 2006). By
using standard software with nonlinear least-squares
(NLS) approximation tool, the parameters K , r , α and
m
t
was estimated by fitting the Richards model to the
epidemic curve in each epidemic season (October to
next April).
2.4 Generalized Linear Model
Generalized linear models (GLM) have been proved
to be an effective approach allowed to analyze the
associations between disease outbreaks and the
predictor variables. GLM is designed to model
response variables that may follow a general
ICHIH 2022 - International Conference on Health Big Data and Intelligent Healthcare
12
distribution, which is viewed as a unification of
linear and nonlinear regression models. It includes
three components: (1) a response variable
distribution, (2) a linear predictor that involves a
number of independent variables, and (3) a link
function that connects the predictor with the response
variable (Joseph 2006). Here, we used GLM to infer
the effects of climate on H7N9 emergence. It is
assumed that human reported cases follow Possion
distribution, in that the infection of H7N9 is a small
probability event. We specified the expected number
of human H7N9 cases as follows:
12
01 2
ln
ttt
yRHTEM
ττ
ββ β
−−
=+ +
(2)
where RH and TEM represent the relative humidity
and temperature, respectively; and are the time lag
of variables. The statistical analyses were performed
using the statistical software R.
2.5 Generalized Additive Model
Generalized additive model (GAM) is a
nonparametric extension of Generalized linear model
which can effectively address the complex nonlinear
relationship between independent variables and
dependent variables. GAM is characterized by
smooth function fitting for some or all independent
variables to reduce errors caused by linear model
assumptions and hence the requirements for model
samples are more relaxed. We applied GAM to infer
the impact of climate on the emergence of H7N9
virus. Its basic form is as follows:
1
(()) ( , )
k
ii
i
gEY a S X df
=
=+
(3)
where S(.) represent the spline function of the
independent variable that has nonlinear relationship
with the dependent variable. Statistical software R
was also used for analysis.
3 RESULTS
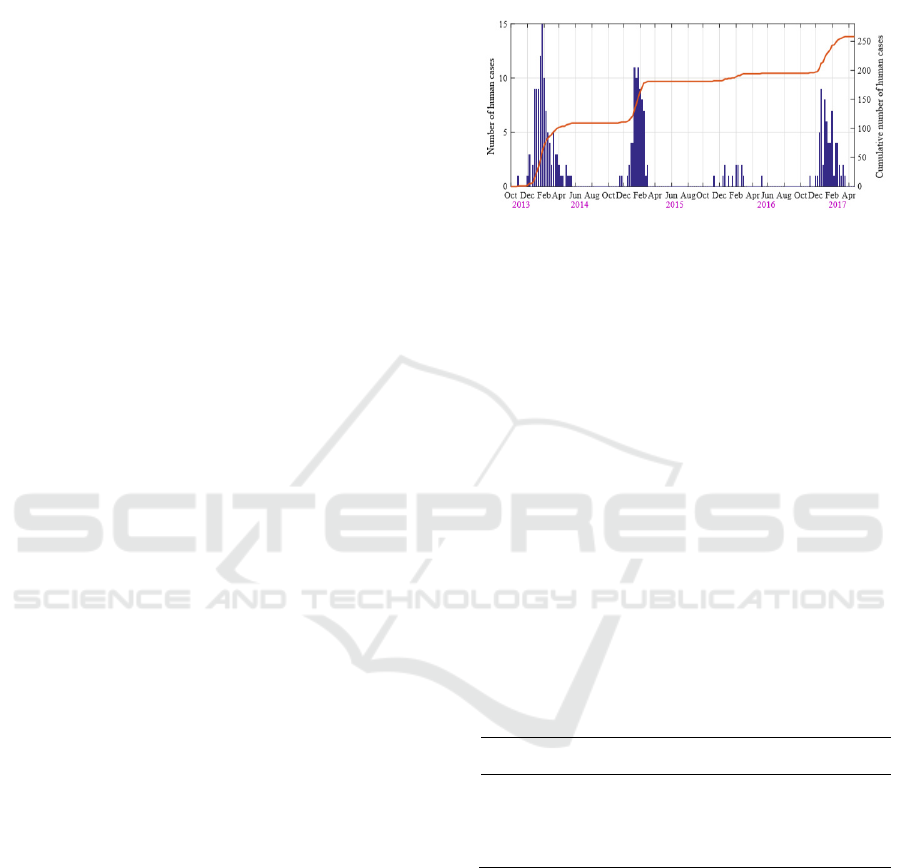
Between October 2013 and June 2017, a total of 258
cases of human infection were reported in Guangdong
Province (Fig. 2). The incidence rate is 0.00024%,
and the mortality rate is 38.76%. The epidemic curve
exhibited a strong seasonal cycle, as human infections
usually occurred in the winter/spring and reached a
peak in January.
The 2013/14 epidemic season possessed the most
number of human infections (109 cases), followed by
2014/15 season (72 cases) and 2013/14 season (63
cases). The H7N9 epidemic in 2015/16 season is
relatively soft with 12 reported cases. In response to
the outbreak, many LPMs were closed by local
government. Such intervention was usually
implemented in January.
Figure 2: Time series of weekly human H7N9 cases
reported during October 2013 and April 2017. The blue bar
and the yellow curve correspond to the new and the
cumulative cases, respectively.
Fitting the cumulative number of human H7N9
case to the previously described Richards model
procedure, we obtained the parameter estimates of the
four waves (Table 1), with the corresponding
theoretical epidemic curve 3). It is found that the
model preformed well in terms of fitting the real-
world observations. We found that the four turning
points occurred on January 17, 2014, January 16,
2015, February 3, 2016 and December 30, 2016,
which is corresponded the the timing of closing live
poultry markets. It should be noted that after the
periods of the turning points, the outbreak started to
ease, reversing the initial exponential growth.
Table 1: Estimation results of the Richards model
parameters with the 95% CI for the four H7N9 waves in
Guangdong Province during 2013-2017.
Time period
i
t
r
K
a
2013.10-2014.04 16.50 0.32 104.51 0.81
2014.10-2015.04 16.47 0.65 72.31 1.41
2015.10-2016.04 19.33 0.75 13.14 3.85
2016.10-2017.04 13.75 0.28 64.05 0.07
Based on the GLM analysis, we found that the
average temperature and the relative humidity were
entered into the model, where the detailed
information of coefficients is presented in Table 4 and
2. The results indicated that the relative humidity and
the average temperature have significant influence on
the human H7N9 infections, where human cases are
most negatively correlated with the changes of
relative humidity and average temperature at lags of
1-5 and 1-3 weeks, respectively.
Turning Points and Climatic Impacts on the Multi-wave H7N9 Outbreaks in Guangdong Province, China
13
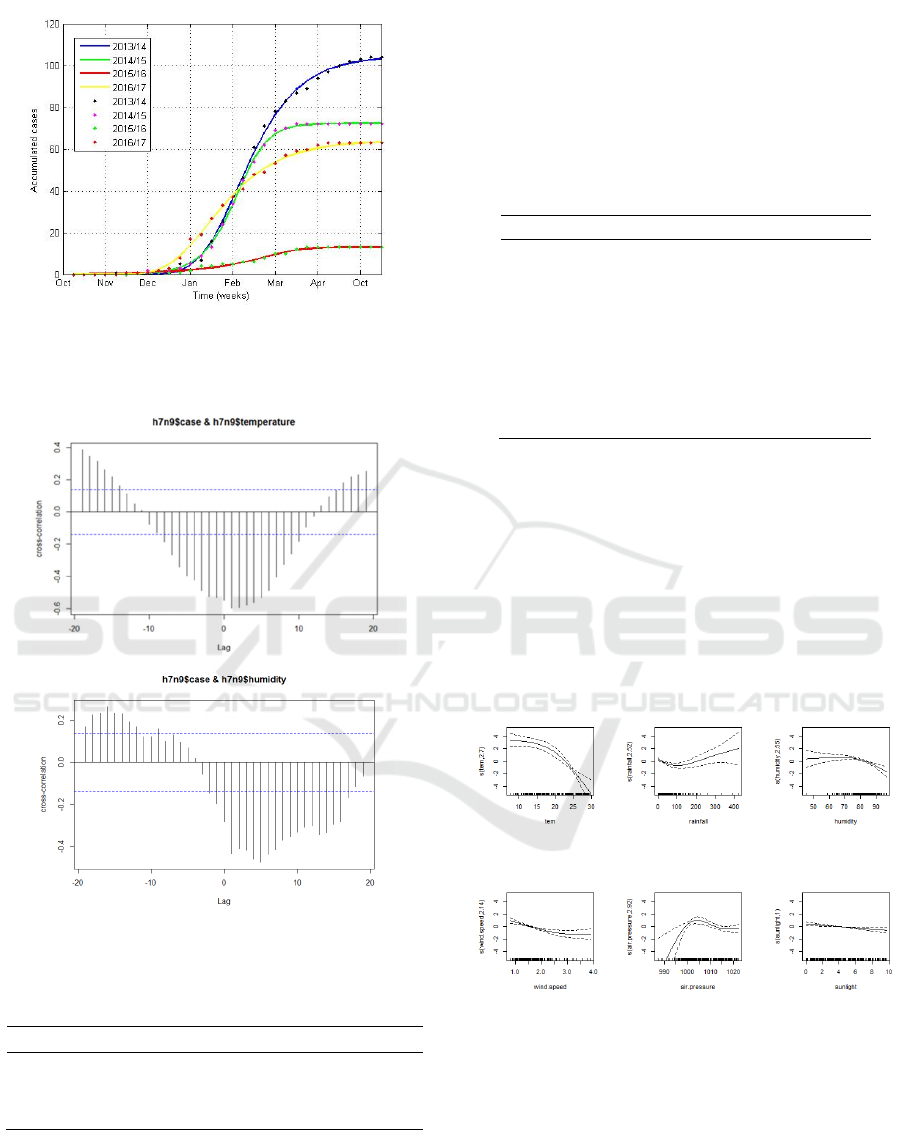
Figure 3: Fitting the cumulative H7N9 infections in
Guangdong during the four epidemic seasons by using the
Richards model.
Figure 4: The correlation between the number of H7N9
cases and temperature, as well as relative humidity.
Table 2: Results from the generalized linear model.
Estimate Std.error Z-Value Pr(>lZl)
Intercept 6.8612 0.4791 14.32 < 2e-16
RH -0.0391 0.0073 -5.35 8.8e-08
TEM -0.2022 0.0148 -13.70 < 2e-16
The correlation coefficients between human
infections and meteorological factors are shown in
Table 3. It is found that infection is negatively and
strongly relevant to average, highest and lowest
temperature, with correlation coefficient around -
0.66. Infection is also positively associated with
average air pressure, with correlation coefficient as
0.45. Yet the linear relation between infection and
humidity, wind speed, rainfall, sunlight is not
significant, which indicates that it may exist nonlinear
connection between them.
Table 3: The correlation between the number of H7N9
cases and climatic impacts
Climatic factor R-Value P-Value
Average temperature -0.66 0
Highest temperature -0.62 0
lowest temperature -0.66 0
rainfall -0.29 0
Average relative
humidit
y
-0.33 0
Average wind speed 0.18 0.09
Average air pressure 0.45 0
Average sunlight -0.15 0.21
Based on GAM analysis, the results showed that
there was a complex nonlinear relationship between
climate factors and the incidence of H7N9. As shown
in Figure 5, the number of H7N9 cases gradually
decreased with the increase of temperature. When the
average temperature reached 20℃, the number of
cases was almost zero. When the rainfall was more
than 200mm, the number of cases increased with
increasing rainfall. The risk of H7N9 infection peaks
when relative humidity reaches 80 percent. When the
air pressure is close to 1005hPa, it is most favorable
for human infections of H7N9 virus.
Figure 5: Effect chart of relationship between climatic
factors and the number of H7N9 cases.
4 DISCUSSION
The recent emergence of avian influenza A (H7N9)
virus has becoming a big public health issue in China.
Exploring the risk factors and evaluating the
intervention strategies are the priority for controlling
ICHIH 2022 - International Conference on Health Big Data and Intelligent Healthcare
14

and preventing H7N9 epidemics. In this study, we
used a Richards model, generalized linear model and
generalized additive model to investigate the
associations between incidence decline and LPM
closure, and to infer the effects of climatic factors on
H7N9 transmission. Two insights arising from our
results could provide meaningful clues for
policymakers to implement effective interventions on
H7N9 infection.
First, we found that the turning points of the four
epidemic waves occurred exactly at one week after
closing LPMs. Before the turning points, human cases
had the potential to increase exponentially. After that,
the numbers began to decelerate. During 2013/14 and
2014/15 epidemic seasons in Guangdong, human
infections were sporadically reported in December.
The local governments successively closed LPMs in
early January. In this cases, we found that the turning
points occurred in mid-January. The H7N9 epidemic
in 2015/16 season is less serious, and only a few
LPMs were closed in January 2016. We found that the
turning points was relatively late, occurring on
February 3. H7N9 outbreak in 2016/17 season was
much earlier, where human cases were recorded from
mid-December. The Guangdong government
responded very quickly and instructed the local
authorities to close LMPs. Consequently, we found
that the turning point occurred in late December. In
short, we found that the turning points occurring after
about one week of LPM closure. Such time lag could
be related to the latent period of H7N9 virus in human
and poultry. Our results indicated that closing LPMs
can effectively reduce human H7N9 infections, which
is consistent with previous findings (Yu 2014, Wu
2014, Adam 2015, Zhu 2021).
Second, we found that the change in human H7N9
infections appears to be most closely correlated with
change in temperature at lags of 1-3 weeks,
meanwhile the changes in relative humidity seems to
be most correlated with change in H7N9 case number
at lag of 1-5 weeks. Our findings are consistent with
previous analysis, where they claimed that
temperature and humidity are the dominant variables
for H7N9 transmission (Tao 2018, Li 2015, Zhang
2015, Hu 2015). This can be explained by changes in
virus activity under different climate conditions. Low
temperature and humidity favoured the survival and
transmission of H7N9 viruses during its outbreak, and
can also directly/indirectly affect people’s behaviour,
making them more vulnerable to H7N9 viruses (Tao
2018, Hu 2015). Further understanding of the impact
of socio-ecological factors on the incidence of H7N9
with the development of early warning system can be
useful and important in the control and prevention of
H7N9.
In summary, we have detected the turning points
of the four H7N9 epidemic waves, and clarified the
potential relationship between human cases and
temperature as well as relative humidity. Our results
indicated that closing LPMs can significantly reduce
human infections, and LPM closure and climatic
factors played a role in the seasonality of H7N9
transmission.
In addition to climate, human activities and
contact with live poultry could be the important
factors contributed in the spread of H7N9.
Government regulation toward live poultry market
can modify the transmission pattern of H7N9. These
factors should be considered in future studies fur
guiding H7N9 control.
ACKNOWLEDGEMENTS
This article is supported by Guangxi Key Laboratory
of Cryptography and Information Security
(GCIS201707).
REFERENCES
Bao, C., Cui, L., et al. (2013). Live-animal markets and
influenza A (H7N9) virus infection. New England
Journal of Medicine, 2013 (368): 2337–2339.
Chen, L., Lin, X., et al. (2016). Diversity and evolution of
avian influenza viruses in live poultry markets, free-
range poultry and wild wetland birds in China. Journal
of General Virology, 97 (4): 844–854.
Chen, Y., Liang, W., et al. (2013). Human infections with
the emerging avian influenza A H7N9 virus from wet
market poultry: clinical analysis and characterisation of
viral genome. The Lancet, 381 (9881): 1916–1925.
Fourni´e, G., Pfeiffer, D. U. (2014). Can closure of live
poultry markets halt the spread of H7N9? The Lancet,
383(9916): 496–497.
Han, J., Jin, M., et al. (2013). Epidemiological link between
exposure to poultry and all influenza A (H7N9)
confirmed cases in Huzhou city, China, March to May
2013. Eurosurveillance, 18 (20): 32–7.
Hu, W., Zhang, W., et al. (2015). Weather variability and
influenza a (h7n9) transmission in shanghai, china: A
bayesian spatial analysis. Environmental Research,
136: 405.
Hsieh, Y., Wu, J., et al. (2014). Quantification of bird-to-
bird and bird- to-human infections during 2013 novel
h7n9 avian influenza outbreak in china. Plos One, 9
(12): e111834.
Hsieh, Y., Chen, C. W. S. (2009). Turning points,
reproduction number, and impact of climatological
Turning Points and Climatic Impacts on the Multi-wave H7N9 Outbreaks in Guangdong Province, China
15

events for multi-wave dengue outbreaks. Tropical
Medicine and International Health, 14 (6): 628–638.
Hsieh, Y., Cheng, Y., (2006). Real-time forecast of
multiphase outbreak. Emerging Infectious Diseases, 12
(1): 122–127.
Jing, L., Rao, Y., et al. (2015). Identification of climate
factors related to human infection with avian influenza
a h7n9 and h5n1 viruses in china. Scientific Reports, 5:
18094.
Kucharski, A., Mills, H. L, et al. (2015). Transmission
potential of influenza A (H7N9) virus, China, 2013-
2014. Emerging Infectious Diseases, 21 (5): 852–855.
Liu, T., Kang, M., et al. (2018). Independent and interactive
effects of ambient temperature and absolute humidity
on the risks of avian influenza a (h7n9) infection in
china. Science of The Total Environment, 619/620:
1358–1365.
Li, Q., Zhou, L., et al. (2014). Epidemiology of human
infections with avian influenza A (H7N9) virus in
China. New England Journal of Medicine, 370 (6):
520–532.
Lang, J. B. (2006). An introduction to generalized linear
models. Publications of the American Statistical
Association, 98 (464): 1086–1087.
Peiris, J., Yen, H. (2014). Animal and human influenzas.
OIE Revue Scientifique et Technique.
Peiris, JS. M, Cowling, B. J, et al. (2016). Interventions to
reduce zoonotic and pandemic risks from avian
influenza in Asia. The Lancet Infectious Diseases, 16
(2): 252–258.
Sims, LD, Peiris, M. (2012). One health: the Hong Kong
experience with avian influenza. In One Health: The
Human-Animal-Environment Interfaces in Emerging
Infectious Diseases , pages 281–298. Springer.
Offeddu, V., Cowling, B. J, et al. (2016). Interventions in
live poultry markets for the control of avian influenza:
a systematic review. One Health, 2: 55–64.
Wu, Y., Gao, G. F. (2013). Lessons learnt from the human
infections of avian-origin influenza A H7N9 virus: Live
free markets and human health. Science China. Life
sciences, 56 (6): 493–494.
Wu, J., Lu, J., et al. (2016). Effect of live poultry market
interventions on influenza A (H7N9) virus,
Guangdong, China. Emerging Infectious Diseases, 22
(12): 2104.
Wu, P., Jiang H., et al. (2014). Poultry market closures and
human infection with influenza A(H7N9) virus, China,
2013–14. Emerging Infectious Diseases, 20 (11): 1891.
Yu, H., Wu J. T, et al. (2014). Impact of live poultry market
closure in reducing bird-to-human transmission of
avian influenza A (H7N9) virus: an ecological study.
The Lancet, 383 (9916): 541.
Yuan, J., Lau, E. HY, et al. (2015). Effect of live poultry
market closure on avian influenza A (H7N9) virus
activity in Guangzhou, China, 2014. Emerging
Infectious Diseases, 21 (10): 1784.
Yi, Z., Feng, C., et al.(2015). The impact of temperature and
humidity measures on influenza a (h7n9)
outbreaksevidence from china. International Journal of
Infectious Diseases, 30: 122.
Zhu, G., Kang, M., et al. (2015). Different intervention
strategies toward live poultry markets against avian
influenza A (H7N9) virus: Model-based assessment.
Environmental Research, 198: 110465.
Zhou, X., Li, Y., Wang, Y., et al. (2015). The role of live
poultry movement and live bird market biosecurity in
the epidemiology of influenza A (H7N9): cross-
sectional observational study in four eastern China
provinces. Journal of Infection, 71 (4): 470–479.
ICHIH 2022 - International Conference on Health Big Data and Intelligent Healthcare
16
