
Predicting the Malignant Breast Cancer using Tumor Tissue Features
Wenrui Zhao
College of Art and Science, the Ohio State University, Columbus, OH, 43210, U.S.A.
Keywords: Breast Cancer, Breast Cancer Datase, Feature Selection, FNA, Cancer Diagnosis.
Abstract: Breast cancer is one of the most common cancers in women and is the second leading cause of death after
lung cancer. In clinical diagnosis, fine needle aspiration cytology is often used in tumor diagnosis, considering
safety, accuracy, and ease of operation. Pathologists can judge whether the patient's tumor tissue is malignant
by observing the cell population. The accuracy of fine-needle biopsy largely depends on the doctors who
participate in sampling and analysis. Therefore, it is crucial to study which characteristics of cells can become
a solid basis for discrimination. This article constructs univariate and multivariate logistic regression models
to analyze the predictive value of 9 features of the cell to breast cancer. By evaluating the ROC curve, the
article shows that the constructed model accurately predicts malignant tumor tissue. The 9 characteristics of
FNA quantitative detection of tumor tissue are of great value in predicting malignant breast cancer.
1 INTRODUCTION
Breast cancer is one of the most common cancers in
women and is the second leading cause of death after
lung cancer (Nguyen,1970) (Mangasarian, 1990). In
2020, over 2.3 million women were diagnosed with
breast cancer worldwide, and 685 thousand died. Due
to population growth, aging, and the increasing
prevalence of known cancer risk factors (such as
smoking and unhealthy eating), WHO believes that if
the global incidence rate remains the same as in 2020,
there will be around 28.4 million new cancer cases
worldwide in 2040. Women in every country face the
risks of developing breast cancer at any age after
puberty, but the incidence rate will increase with age
growth (Piro,2021). Existing diagnostic techniques,
including nuclear magnetic resonance imaging,
ultrasound, CT (computer tomography) or PET
(positron emission tomography), are very effective in
tumor detection (World Health Organization, 2021)
However, when doctors find suspicious tumor tissue,
they still hope to obtain tissue samples for analysis.
Biopsy isan essential technique for the diagnosis of
cancer in the clinic. Because fine needle biopsy does
not need any preparation in advance, nor does it need
special dietary norms, fine-needle aspiration (FNA)
has become the preliminary diagnostic basis for
judging whether breast tissue is cancerous. A large
number of data show that although FNA has many
advantages, a few cases may be misdiagnosed.
Therefore, it is vital to study which characteristics of
cells can become a solid basis for discrimination.
From 1989 to 1991, Dr. Wolberg, Dr. Mangasarian
and two graduate students constructed a classifier
using the pattern separation multi-surface method
(MSM) for these nine features and successfully
diagnosed 97% of new cases (Nguyen,1970)
(Wolberg,1989). These led to the Wisconsin breast
cancer dataset. This article constructs univariate and
multivariate logistic regression models to analyze the
predictive value of 9 features of the cell to breast
cancer. This article used biometric methods for
exploratory data analysis to focus more narrowly on
checking the fitting degree of the model (Chatfield,
2021) By studying the different importance of the 9
features of cells, the article helps people establish a
more standard method to judge whether tumor tissue
is malignant.
2 ANALYSES
FNA uses a tiny needle tube of about 20-27G (similar
to or smaller than the needle tube for regular blood
testing. Generally, the larger the number of G, the
smaller the needle tube) (CancerQuest,2021). Due to
the small amount of tissue and its cellular
components collected, pathologists will pay more
attention to the observation of cell populations. The
study used the Wisconsin Breast Cancer Dataset
204
Zhao, W.
Predicting the Malignant Breast Cancer using Tumor Tissue Features.
DOI: 10.5220/0011196000003443
In Proceedings of the 4th International Conference on Biomedical Engineering and Bioinformatics (ICBEB 2022), pages 204-211
ISBN: 978-989-758-595-1
Copyright
c
2022 by SCITEPRESS – Science and Technology Publications, Lda. All rights reserved
(WBCD) for women in the UCI machine learning
dataset (Nguyen, 1970) (Wolberg, 1989) (Taylor,
2021) (Tukey, 1992) The dataset contains 699
records. It includes nine features in this dataset.
Depending on the values of features, benign and
malignant masses can be distinguished. This dataset
has 16 missing values, this article discarded these
missing values in our experiment, and we considered
the remaining 683 records. 444 records belong to the
benign category from the cleaned data set, and the
remaining 239 records belong to the malignant
category. An important step in the breast cancer
diagnosis model is feature extraction. The optimum
feature set should have adequate and discriminating
features while mainly reducing the redundancy of
components space to avoid low sampling density.
This dataset provides nine crucial features of the cell
population, which are clump thickness, uniformity of
cell size, uniformity of cell shape, marginal adhesion,
single epithelial cell size, bare nuclei, bland
chromatin, normal nucleoli, and mitoses.
Exploratory data analysis begins with the
establishment of logistic regression models and
random forest. By observing the performance of the
model in each category through the visual confusion
matrix, the accuracy and recall of the model
corresponding to each class can be calculated.
Because judging the diagnosis result is a binary
classification problem, the ROC curve can analyze
the coordinates well. An essential feature of the ROC
curve is its area. An area of 0.5 is random
classification, and the recognition ability is 0. The
closer the area is to 1, the stronger the recognition
ability is, and an area equal to 1 is complete
recognition.
3 RESULTS
3.1
Exploratory Data Analysis
The diagnosis of malignant tumors belongs to binary
classification problems. In other words, for a patient,
her tumor result is either malignant or not. Therefore,
according to the data type, the results can be divided
into benign and malignant.
Exploratory data analysis (EDA) is an approach
for data analysis that employs a table to maximize
insight into the dataset and extract important
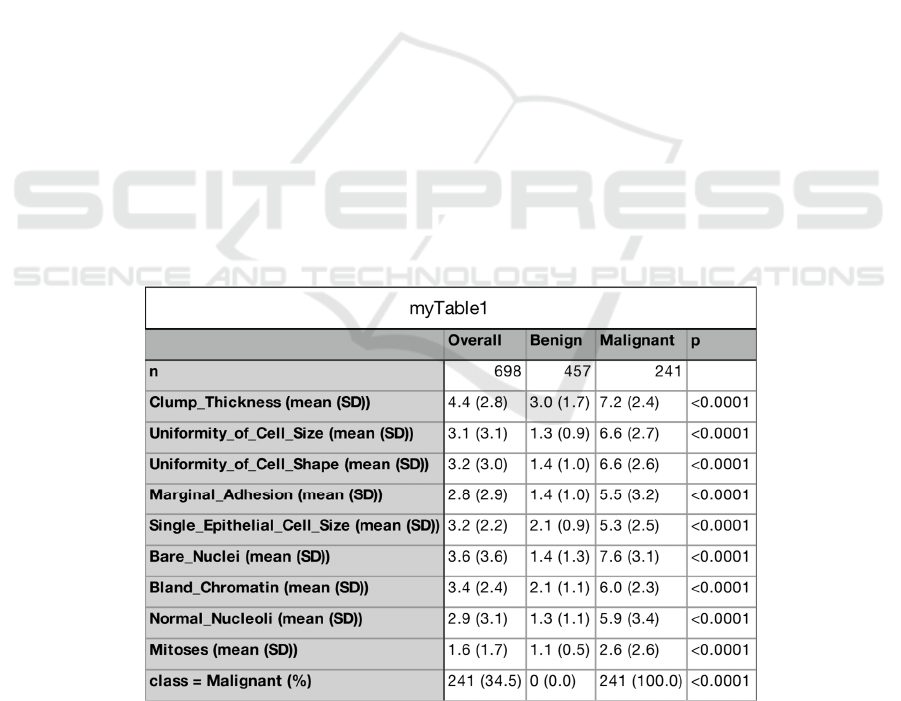
variables. Through EDA, figure 1 was derived. In the
table, the lower the p-value, the greater the statistical
significance of the observed difference. The result
shows that the nine characteristics of the cells we
observed are statistically significantly correlated with
the diagnostic results.
In addition, in 241 patients with malignant
tumors, the values of 9 characteristics of cells were
significantly higher than those in patients with benign
tumors, and the p-value of the statistical test was less
than 0.05 (< 0.0001), ndicating that these nine
variables are adverse predictors of malignant tumors.
Figure 1: Baseline characteristics of the study population
Correlation analysis is necessary before logistic
regression analysis. This article further discussed the
correlation between these nine variables and derived
Figure 2. It is found that these variables are positively
correlated, which is consistent with the information
prompted in Figure 1. Among them, judging by the
Predicting the Malignant Breast Cancer using Tumor Tissue Features
205
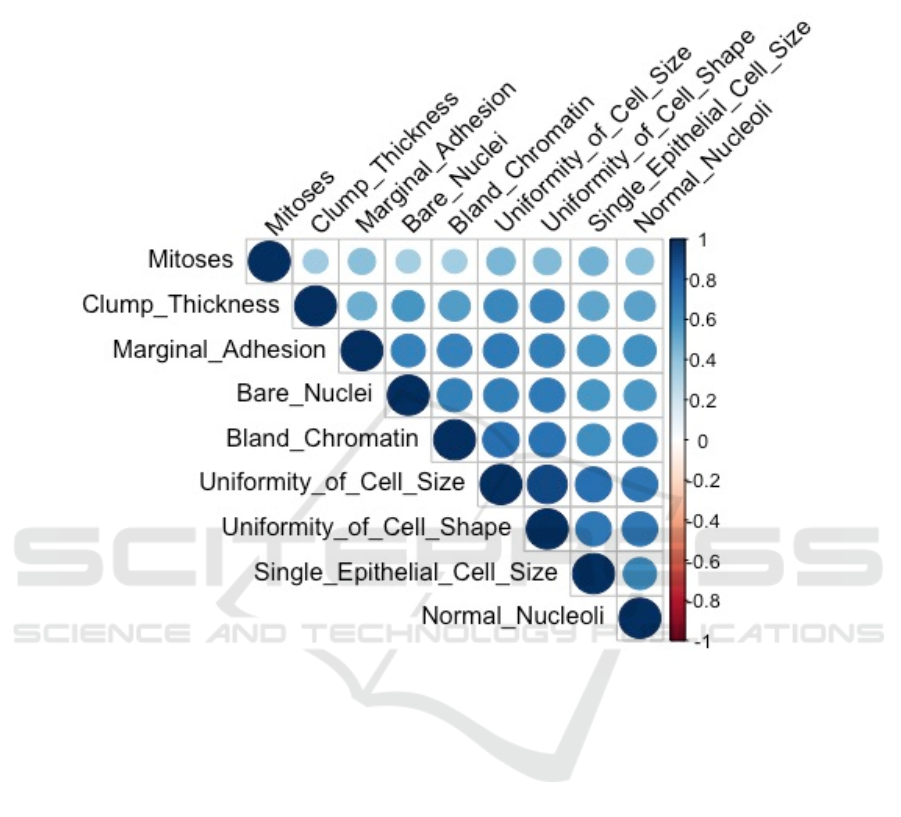
color depth of the chart, the uniformity of cell size
and cell shape has the strongest correlation, which is
closest to 1. Through correlation analysis, it is
suggested that all 9 features have good consistency in
describing the morphology of tumor cells.
Figure 2: Correlation between 9 Features.
3.2 Building Logistic Regression
Models
Because the number of cases given by the database is
not large, only nine factors appear in about 600
diagnoses. Therefore, if all elements are analyzed in
the equation, the results may be problematic
(Mangasarian,1990). In this case, univariate analysis
can help to screen out significant variables and then
put these variables into the equation for multivariate
analysis.
In the univariate logistic regression model, it can
be observed that every single factor is correlated with
tumor categories. For example, the results in clump
thickness (OR:2.55, 95%CI: [2.25,2.97]) indicates
that when the clump thickness of cells increases by
one unit, the probability that the tissue is malignant
increases by 1.55 times. All else follows: uniformity
of cell size (OR:4.43, 95%CI: [3.54,/70]), uniformity
of cell shape (OR:4.08, 95%CI: [3.32,5.17]),
marginal adhesion (OR:2.62, 95%CI: [2.26,3.11]),
single epithelial cell size (OR:3.89, 95%CI:
[3.17,4.89]), bare nuclei (OR:2.18, 95%CI:
[1.96,2.48]), bland chromatin (OR:3.75, 95%CI:
[3.06,4.74]), normal nucleoli (OR:2.36, 95%CI:
[2.06,2.76]), and mitoses (OR:3.84, 95%CI:
[2.78,5.62]).
ICBEB 2022 - The International Conference on Biomedical Engineering and Bioinformatics
206

Figure 3: Uni-variate Logistic Regression Model.
In multivariate analysis, only statistically
significant independent variables in the univariate
analysis may lead to some influencing factors not
having the opportunity to enter the multivariate
model. However, for the nine features studied in this
article, the P-value is far less than 0.05, so it is
feasible to incorporate all these factors into the
multivariable logistic regression model.
In this multivariable logistic regression model, for
example, when the other eight variables remain
constant, if the clump thickness of cells increases by
one unit, the probability of malignant tissue increases
by 0.71 times. All else follows: uniformity of cell size
(OR:100, 95%CI: [0.71,1.48]), uniformity of cell
shape (OR:1.41, 95%CI: [0.93, 2.11]), marginal
adhesion (OR:1.27, 95%CI: [1.02,1.60]), single
epithelial cell size (OR:1.07, 95%CI: [0.80,1.43]),
bare nuclei (OR:1.45, 95%CI: [1.24, 1.74]), bland
chromatin (OR:1.54, 95%CI: [1.15, 2.11]), normal
nucleoli (OR:1.15, 95%CI: [0.94, 1.41]), and mitoses
(OR:1.73, 95%CI: [1.02, 2.94]).
Figure 4: Multi-variate Logistic Regression Model.
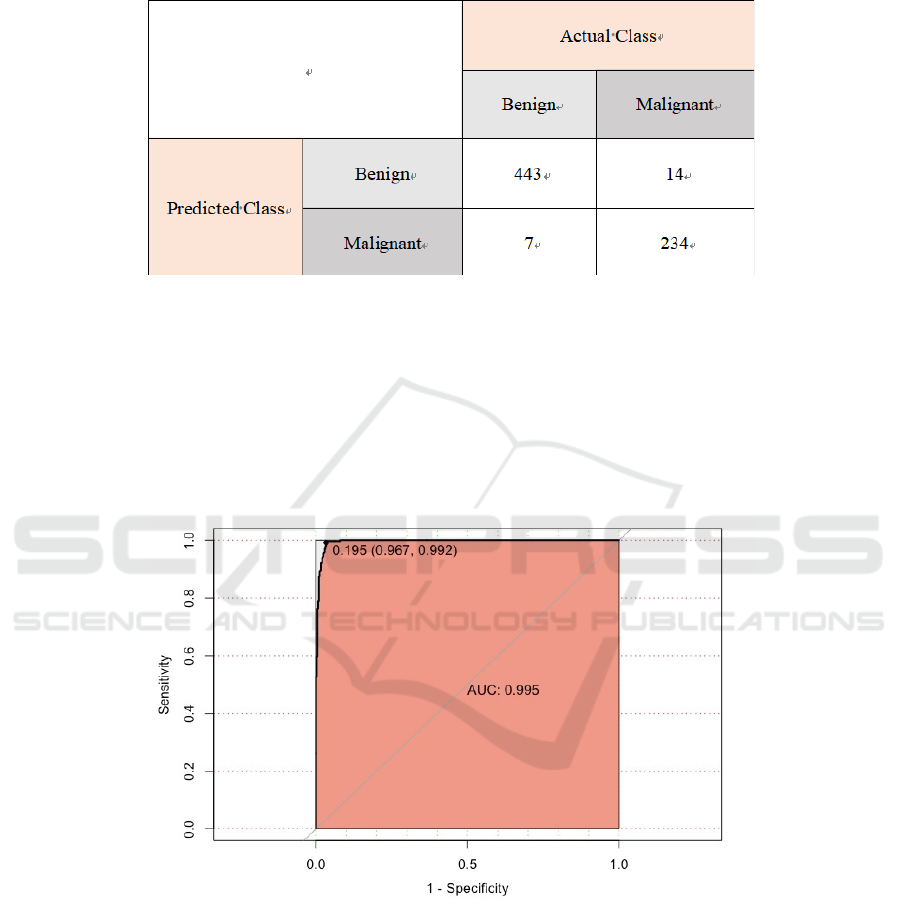
3.3 Analysis from Confusion Matrix
In the confusion matrix, the amount of data is 698, in
which the row represents the prediction category of
the data and the column represents the real category.
There are 675 cases whose predicted category is
consistent with the real category, accounting for
96.7% of all cases. Therefore, the matrix indicates
that the prediction can correctly classify 96.7% of the
samples.
The model correctly predicts 443 data in the
benign category, and 232 data in the malignant
category. There are 14 data which the prediction is
benign, but the real category is malignant, and 9 data
which the prediction is malignant, but the real
category is benign. This shows that although FNC has
many advantages, there are still a few cases that may
be misdiagnosed. In this sample, the false negative is
greater than the false positive.
Variable OR 95%CI
fit1:Clump Thickness 2.55 [2.25,2.97]
fit2:Uniformity of cell size 4.43 [3.54,5.70]
fit3:Uniformity of Cell Shape 4.08 [3.32,5.17]
fit4:Marginal Adhesion 2.62 [2.26,3.11]
fit5:Single Epithelial Cell Size 3.89 [3.17,4.89]
fit6:Bare Nuclei 2.18 [1.96,2.48]
fit7:Bland Chromatin 3.75 [3.06,4.74]
fit8:Normal Nucleoli 2.36 [2.06,2.76]
fit9:Mitoses 3.84 [2.78,5.62]
Univariable Logistic regression analysis predicting Breast Cancer
Variable OR 95%CI
fit1:Clump Thickness 1.71 [1.35,2.26]
fit2:Uniformity of cell size 1.00 [0.71,1.48]
fit3:Uniformity of Cell Shape 1.41 [0.93,2.11]
fit4:Marginal Adhesion 1.27 [1.02,1.60]
fit5:Single Epithelial Cell Size 1.07 [0.80,1.43]
fit6:Bare Nuclei 1.45 [1.24,1.74]
fit7:Bland Chromatin 1.54 [1.15,2.11]
fit8:Normal Nucleoli 1.15 [0.94,1.41]
fit9:Mitoses 1.73 [1.02,2.94]
Multivariable Logistic regression analysis predicting Breast Cancer
Predicting the Malignant Breast Cancer using Tumor Tissue Features
207
Figure 5: Confusion Matrix for Multi-variable Regress Model.
3.4 Analysis from Evaluation Matrix
The accuracy rate represents the proportion of
correctly predicted samples in all samples, which is
0.9670487. The accuracy rate of the benign class
represents the proportion of samples whose real
category is benign among the samples predicted as
benign, which is 0.9541667; The recall rate of the
benign class represents the proportion of samples
successfully predicted by the model in the real benign
samples, which is 0. 7502075. The F-measure is the
harmonic mean of precision and recall. In most
situations, there would be a trade-off between
precision and recall. Since the F-Measure is
0.952183, which is pretty close to 1, the regression
analysis will give out both high recall and high
precision.
Figure 6: Evaluation Matrix.
3.5 Confusion Matrices’ Comparison
between the Multivariable Logistic
Regression Model and Random
Forest
The matrix for random forest correctly predicts 443
data in the benign category and 234 data in the
malignant category. There are 14 data which the
prediction is benign, but the real category is
malignant, and 7 data which the prediction is
malignant, but the real category is benign. There are
677 cases whose predicted category is consistent with
the real category, accounting for 96.9% of all cases.
Benign Malignant
Benign
443 14
Malignant
9 232
Actual Class
Predicted Class
Accuracy 0.9670487
Precision 0.9541667
Recall 0.9502075
F_Measure 0.952183
ICBEB 2022 - The International Conference on Biomedical Engineering and Bioinformatics
208
Since the confusion matrix for the random forest
is not significantly different from the multivariable
logistic regression model in Figure 5, considering the
interpretability of the multivariable regression model,
it would be better to use the multivariable logistic
regression model and evaluate its ROC curve.
Figure 7: Confusion Matrix for Random Forest.
3.6 Analysis of ROC Curve
The closer the ROC curve is to the upper left corner
(0,1) model on the image, the better, the larger the
area (AUC value) surrounded by the horizontal axis
and straight-line FPR = 1 under the ROC curve, the
better.
The area under the ROC curve, that is, the AUC,
is 0.995, which shows that the prediction effect of this
model for malignant tumor tissue is very accurate.
When setting the cut-off of the model output to 0.195,
the model can achieve its best outcome. Meanwhile,
the sensitivity of the model is 0.992, and its
specificity is 0.967.
Figure 8: ROC Curve.
3.7 Analysis of Random Forest
The Mean Decrease Accuracy plot expresses how
much accuracy the model losses by excluding each
variable. Bare Nuclei and clump thickness are
influential factors from the first diagram, which
means that these two variables are more important for
successful classification than the others. Whereas
under different standards, uniformity of cell size and
uniformity of cell shape become contributing factors
to the homogeneity of the nodes and leaves in the
resulting random forest.
Predicting the Malignant Breast Cancer using Tumor Tissue Features
209
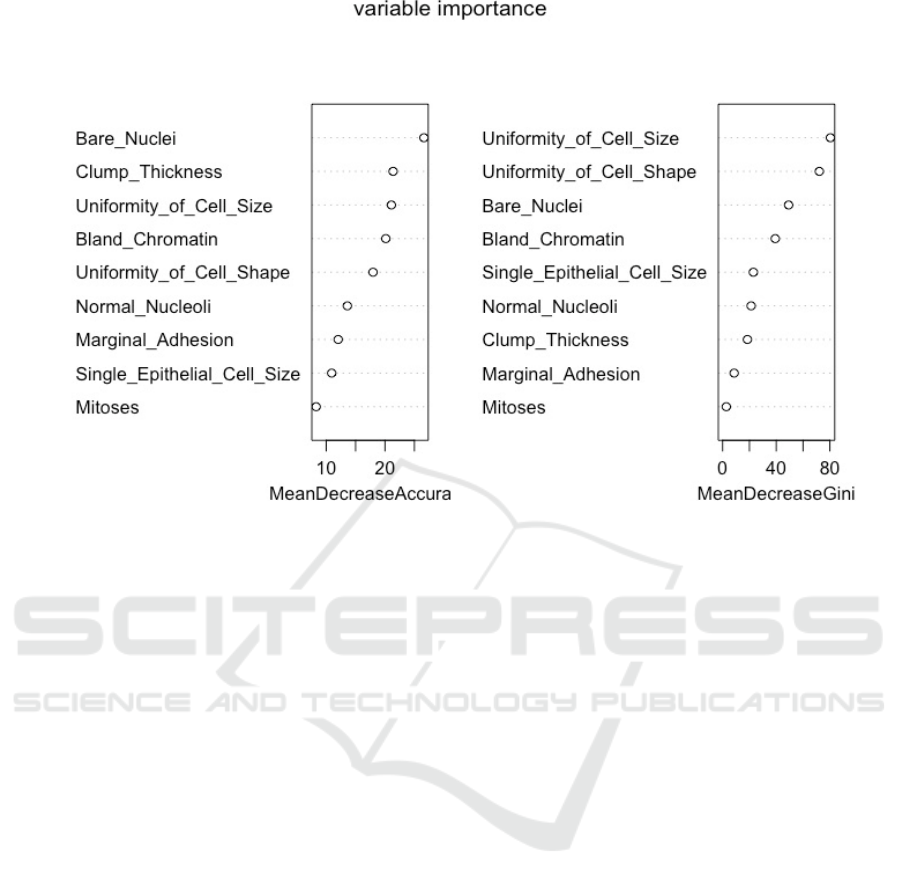
Figure 9: Random Forest.
4 CONCLUSIONS
FNA is simple, fast and safe. Now it has become one
of the critical diagnostic methods of clinical diseases.
However, due to the small amount of tissue and its
cellular components, the tissue morphology and
interstitial structure in the specimen are mostly or
entirely lost, which cannot reflect the overall picture
of the type of lesion and interfere with the observation
of cell characteristics. Therefore, quantitative
detection of the 9 features of tumor tissues using FNA
technology is of great value in predicting malignant
breast cancer. Among them, clump thickness,
mitoses, and bland chromatin are of high predictive
value.
A larger sample size collected from over the
world or some certain nations instead of a state would
be always expected. It could improve the accuracy
and generality of the study.
A lack of personal information (i.e. age, family
history of breast cancer…) may impede the progress
of generalizing the conclusion. This information
would be helpful when applying our study to a border
sample, or in practical conditions.
REFERENCES
Biopsy. CancerQuest. (n.d.). Retrieved November 6, 2021,
from https://www.cancerquest.org/zh-
hans/geihuanzhe/jianceyuzhenduan/huotizuzhijiancha
zuzhi.
Chatfield, C. (n.d.). Problem solving: A statistician's guide,
second edition. in Search Works catalog. Retrieved
October 7, 2021.
Nguyen, Q. H., Do, T. T. T., Wang, Y., Heng, S. S., Chen,
K., Ang, W. H. M., Philip, C. E., Singh, M., Pham, H.
N., Nguyen, B. P., & Chua, M. C. H. (1970, January 1).
Breast cancer prediction using feature selection and
ensemble voting: Semantic scholar. undefined.
O. Mangasarian W. Wolberg, O. Mangasarian
Multisurface method of pattern separation for medical
diagnosis applied to breast cytology. Proceedings of the
National Academy of Sciences of the United States of
America.
Piro, M., Bona, R. D., Abbate, A., Biasucci, L. M., & Crea,
F. (2010, March 1). Sex-related differences in
myocardial remodeling: Journal of the American
College of Cardiology. Retrieved September 30, 2021,
from
https://www.jacc.org/doi/abs/10.1016/j.jacc.2009.09.0
65.
Robust linear programming discrimination of two linearly
inseparable sets. Taylor & Francis. (n.d.). Retrieved
October 1, 2021, from
https://www.tandfonline.com/doi/abs/10.1080/105567
89208805504.
ICBEB 2022 - The International Conference on Biomedical Engineering and Bioinformatics
210

Tukey J.W. (1992) The Future of Data Analysis. In: Kotz
S., Johnson N.L. (eds) Breakthroughs in Statistics.
Springer Series in Statistics (Perspectives in Statistics).
Springer, New York, NY.
Wolberg, W. H., Mangasarian, O. L., & Setiono, R. (1989,
January 1). Pattern recognition via Linear
Programming: Theory and application to medical
diagnosis. MINDS@UW Home. Retrieved October 1,
2021.
World Health Organization. (n.d.). Breast cancer. World
Health Organization. Retrieved November 6, 2021,
from https://www.who.int/news-room/fact-
sheets/detail/breast-cancer.
Predicting the Malignant Breast Cancer using Tumor Tissue Features
211
