
Innovative Application of Big Data Analysis Technology in Regional
Industrial Structure Adjustment based on the Perspective of New
Structural Economics
Dan Liu
Dalian University of Finance and Economics, Dalian City Liaoning Province, 116600, China
Keywords: Big Data Technology, New Structural Economics, Adjustment Of Industrial Structure, Factor Endowment
Structure, Economic Operation Of Big Data Analysis Platform.
Abstract: In the current era, big data science has become a scientific research paradigm involving various industries and
fields. Relying on big data technology, a business intelligence big data analysis platform is built according to
data collection, data cleaning, data mining and analysis, and data application processes. In based on the new
structure under the perspective of economics, to help enterprises in the local structure of factor endowments
and actual operation situation and market as a fundamental state policy situation, uses the big data analysis
and mining technology, to solve the data sharing, data aided decision-making, intelligent early warning data
application problem, to reach the company "industry digitization, digitalized management and value of digital
development, we will promote the innovative integration of data and information technology with our own
industries, take the inventory and integration of enterprise data resources as the core, and provide strong
support for the adjustment of enterprise industrial structure.
1 INTRODUCTION
With the release of China's "14th Five-Year Plan"
development outline and "2035 Vision Goal", it is
clear that the sustainable growth of national or
regional economy needs to realize the healthy, timely
and steady adjustment and upgrading of industrial
structure. (The adjustment of industrial structure
continues to advance 2016) A new round of industrial
restructuring and technological change continues to
be guided by the government's industrial policies and
relies on the effective operation of the market
economy mechanism. Under the new structural
economics, China's current industrial structure
adjustment needs to take into account the factor
endowment structure, that is, the proportion of
capital, labor and natural resources; Give full play to
the guiding role of the government and market
economy industrial policies, adhere to innovation-
driven, give full play to the supporting role of high
and new science and technology, promote the
upgrading and adjustment of the industrial structure
of the country, region or even an enterprise. Through
the analysis of new structural economics, the current
industrial structure upgrading and adjustment
presents three trends. One is that the application of
high-tech under the guidance of innovation drives the
rapid completion of industrial structure adjustment;
Second, the optimization of industrial layout and the
continuous improvement of regional coordinated
development level; Thirdly, industrial policy will
continue to lead industrial transformation and
upgrading. (Saidi Think Tank, 2020)
With the application and popularization of
Internet of Things, big data technology and artificial
intelligence technology, data is growing rapidly on an
unprecedented scale. The massive data information
carries and contains huge value, and has become one
of the important production factors in the current
social and economic development. At the same time,
it also poses new challenges to the traditional data
processing technology, and the big data technology
has emerged at the historic moment. Therefore, big
data is not only a multi-source heterogeneous mass
data collection, but also an information technology
formed around the data life cycle, including data
collection, storage, processing, analysis and
visualization. (Lv, 2020, Miao, 2020) Big data is
resource-based and technical. Data mining and
analysis technology and data result application, as the
592
Liu, D.
Innovative Application of Big Data Analysis Technology in Regional Industrial Structure Adjustment based on the Perspective of New Structural Economics.
DOI: 10.5220/0011195000003440
In Proceedings of the International Conference on Big Data Economy and Digital Management (BDEDM 2022), pages 592-597
ISBN: 978-989-758-593-7
Copyright
c
2022 by SCITEPRESS – Science and Technology Publications, Lda. All rights reserved
core of big data, are important forces for innovation
integration of big data with real economy and
upgrading and adjustment of industrial structure.
Therefore, in the perspective of new structural
economics, the optimization and adjustment of
national or regional industrial structure should focus
on each single enterprise. The author believes that in
the current under the situation of industrial structure
adjustment, regional enterprise should with the local
structure of factor endowments and actual operation
situation and market as a fundamental state policy
situation, namely external environment data and drive
their own production and business operation mode,
management way and the internal structure
optimization of the internal data, build up the
economic running large data analysis platform, solve
with big data analysis and mining technology, data
sharing, data aided decision-making, intelligent early
warning data application problem, to reach the
company "industry digitization, digitalized
management and value of digital development,
promote the data integration of information
technology and its industrial innovation, inventory
and integration of enterprise data resources as the
core, industrial structure adjustment to provide strong
support for the enterprise.
2 RELATED TECHNICAL
THEORY INTRODUCTION
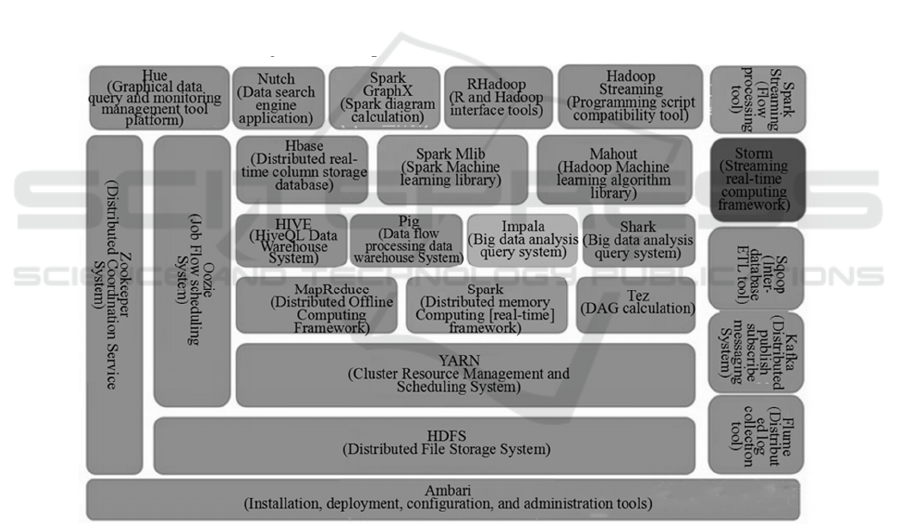
The technology stack contains different levels, such
as business model layer, task scheduling layer, data
computing layer, resource management layer, data
storage layer, data transmission layer and data source
layer. Figure 1 shows the commonly used technology
stack of big data. In the practical application of big
data technology, the common steps of universal data
processing are data acquisition and preprocessing,
data storage, data cleaning, data query and analysis,
and data visualization.
Figure 1: Big data technology stack.
2.1 Data Acquisition and Pretreatment
Flume NG is a real-time log collection system. You
can customize various data sender in the log system
to collect data. In addition, data can be preprocessed
and written to data receivers such as text, HDFS, and
Hbase.
Logstash is a data processing channel based on the
server side. It can collect and transform data from
multiple data sources, and then write data into the
corresponding database to complete data storage.
Logstash supports data inflow through multiple data
channels, enables parallel collection of multiple data,
and supports continuous data flow to complete data
transmission. In this way, data can be collected
quickly and efficiently from log systems, Web
applications, AWS servers, and data stores.
Sqoop is a tool for data association and
transmission between traditional relational database
and Hadoop, the distributed system infrastructure of
Innovative Application of Big Data Analysis Technology in Regional Industrial Structure Adjustment based on the Perspective of New
Structural Economics
593

the core technology of big data. Sqoop lets you
import data from a relational database directly into
Hadoop. For example, data from Mysql and Oracle
can be directly imported to HDFS, Hive, and Hbase
in the Hadoop architecture for data storage. This
process is reversible, greatly facilitating data
collection and capture. Sqoop also supports automatic
transmission of large amounts of structured or semi-
structured data, improving the efficiency of big data
systems.
2.2 Data Storage
The distributed file storage system (HDFS) is
designed as the storage engine of big data technology
under the distributed system infrastructure Hadoop.
Hbase is deployed on the HDFS, which is a
distributed real-time column storage database. HBase
is essentially a NoSQL database used to store data.
However, unlike common relational databases,
HBase is more suitable for storing unstructured data.
In addition, Hbase has Key and Value attributes to
facilitate the HDFS to read and write data randomly.
Similar to HDFS, Tachyon is a memory-centered
distributed file system with high performance and
fault tolerance. Tachyon provides fast file sharing
services for offline computing engines in MapReduc
and Spark cluster frameworks. In terms of the
hierarchy of big data technology stack, Tachyon is an
independent layer between existing big data
computing frameworks and big data storage systems.
In the process of big data analysis and mining, HDFS
performance slows down and cache data is easily lost.
2.3 Data Cleaning
Under Hadoop, MapReduce is used as a query engine
for parallel computation of large data sets. The data
cleaning process is mainly MapReduce program
editing and execution, and the whole process is
divided into Mapper, Reducer, Job three basic
processes. (Cao, 2015) The MapReduce program is
used to clean and process the original or irregular data
collected in HDFS and transform it into regular data,
that is, to complete the pre-processing of data
information and facilitate subsequent statistical
analysis. The MapReduce program is used for
statistical analysis. After the program runs, the
statistical analysis results are returned to the HDFS
for storage.
Compared with MapReduce, Spark is a universal
cluster platform that cleans and computes data faster.
Spark extends the MapReduce computing model,
supports more computing modes, and provides users
with richer data interfaces, such as Python, Scala,
Java, and Sql. Spark Uses the Spark Core component
to create and operate apis for each pair of elastic
distributed data sets (RDD) to clean and compute
data.
2.4 Data Query and Analysis
Hive is a data warehouse tool running under Hadoop.
It can read HDFS data for offline query. Hive maps
data to a database table and supports Hive SQL
(HQL) to query data. Hive provides three query
modes, including Bin/Hive (client), JDBC, and
WebGUI, which are suitable for batch processing of
big data. Hive converts SQL statements sent by users
into MapReduce Jobs and runs them on Hadoop to
query and store data in the HDFS. Hive solves the
bottleneck of big data processing in traditional
relational databases such as MySql and Oracle. (Yang
2016)
2.5 Data Visualization
Big data technology obtains data results through a
series of steps, such as data collection, data storage,
data cleaning and data query, and uses data
visualization to intuitively display data results,
helping users to deepen their understanding of data
and discover the laws or trends contained in data.
Data visualization is the last and most important step
in the life cycle of big data technology. Hive based
visual chemicals, including Dbeaver and TreeSoft,
facilitate users to query and view data using SQL
statements through simple database configuration and
connection. Zeppelin is a Spark based data
visualization solution that allows any job running on
Spark to run on this platform. It also supports
visualization of table data.
Big data technology to the results of the data are
applied to the platform of business intelligence (BI)
to help enterprise managers to make decisions and
strategy development, through to the enterprise
external environment data, enterprises within its own
production, sales and management of data collection,
management and analysis, the original scattered, low
value of the density, different types of data into useful
information, provide high-quality data services for
enterprises, promote the integration of "two" of
enterprises, and complete the upgrading and
adjustment of industrial structure.
BDEDM 2022 - The International Conference on Big Data Economy and Digital Management
594
3 SYSTEM REQUIREMENT
ANALYSIS
3.1 Overall Demand
In view of the above trend of upgrading and adjusting
the current regional industrial structure from the
perspective of new structural economics, it is
necessary to adjust the industrial structure driven by
the application of high and new technology, and the
second industry will bear the brunt of the adjustment.
As an important pillar of China's national economy,
industry and manufacturing are the main sectors to
drive regional economic growth and the basis of
regional industrial structure upgrading and
adjustment. In this special period, from the point of
enterprise overall development, digital and
information management level is low, high and new
technology integration application range is small,
unreasonable ratio of effective resources, unequal
access to information occlusion, cause extensive
manufacturing reform difficulty big, large and
inefficient enterprises system, the influence to the
enterprise's own survival and development. At
present, the industry and manufacturing industry in
developed countries have been developing towards
the digitalization, informatization, intelligence and
integration of supply, manufacturing and sales.
Therefore, in the face of the current difficulties of
enterprises, it is imperative to upgrade and adjust the
industrial structure. Considering external national
policy forms and market economic mechanism,
enterprises should coordinate their own endowment
structure of production factors, apply big data
technology to build a business intelligence big data
analysis platform, and make enterprise data become
productive forces. In the enterprise information
management and scientific decision-making
guidance play a huge role.
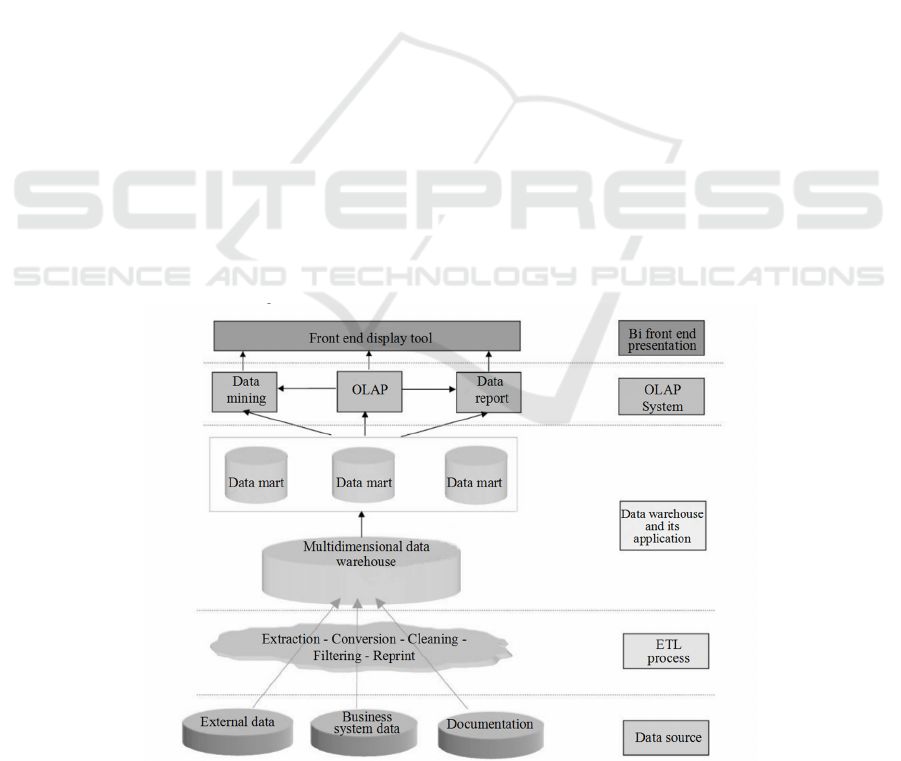
3.2 Functional Requirements
The business intelligence big data analysis platform
can realize the overall management and real-time
monitoring of various business modules of
enterprises. Such as procurement, production,
storage, sales, management and other business
systems, but also open corresponding API data
interface for external data. Detailed functional
implementation depends on the design and
implementation of Hive in Hadoop architecture,
which is used to deploy ETL data processing, OLAP
online data analysis, data mining and data
visualization, as shown in Figure 2. The business
intelligence big data analysis platform fully analyzes
and makes use of the large amount of data
accumulated daily by enterprises, excavates and
extracts the potential value of data, eliminates the
adverse effects of data islands between business
systems, realizes the integration of enterprises and
promotes industrial upgrading and adjustment.
Figure 2: Functional structure diagram of business intelligence big data analysis platform.
Innovative Application of Big Data Analysis Technology in Regional Industrial Structure Adjustment based on the Perspective of New
Structural Economics
595
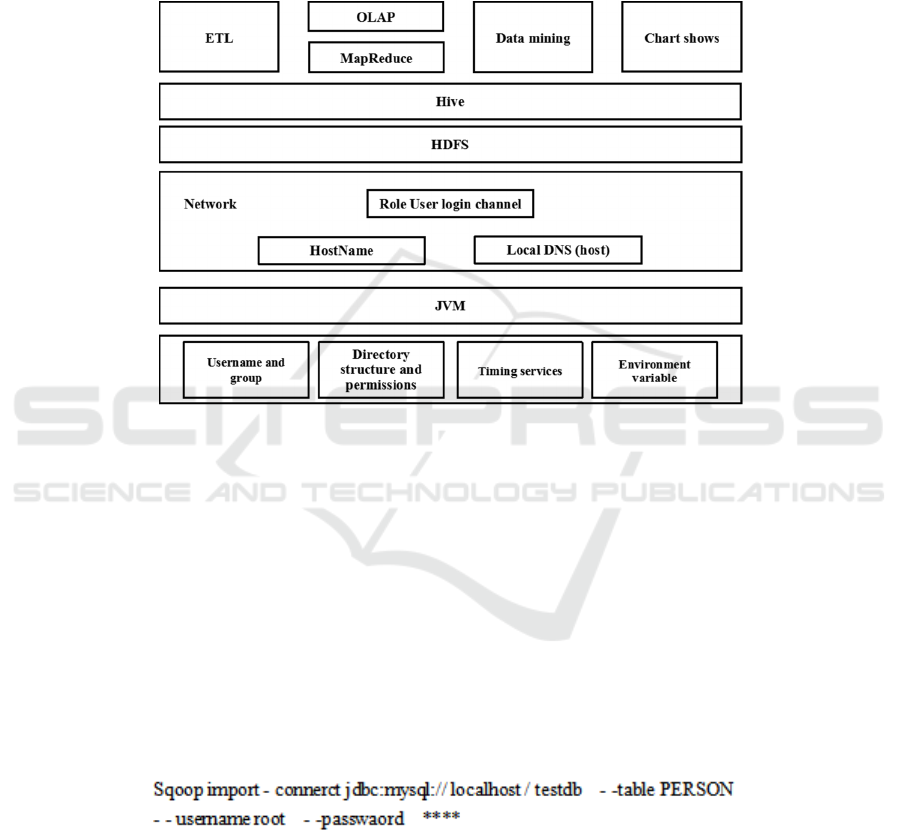
4 DESIGN AND
IMPLEMENTATION
The business intelligence big data analysis platform
is based on the diversified processing of enterprise
business system data and external environment
information data. In order to maintain stable
operation and balance the load of enterprise big data
in real time, the platform adopts Linus system and
builds virtual machines through JVM specifications.
On this basis, the distributed system infrastructure
Hadoop is deployed, login channels for users of
different roles are established, Hive data warehouse
is constructed by MapReduce query engine, and other
functional modules are deployed based on Hive.
Figure 3 shows the overall architecture of the system.
Figure 3: Overall architecture diagram of business intelligence Big data analysis platform.
4.1 Data Collection
The data collection of the business intelligence big
data analysis platform is divided into three parts. The
external data includes the form of national policies,
laws and regulations, actual market evaluation and
trend trend. Most of these data types are unstructured
data, such as web pages, graphics and videos. The
internal data includes the data information in each
sub-business system of the system, which is
structured data. The documents are various system
logs. The logs in the data system record the log
information automatically obtained by the subsystem.
For external data, use Logstash or Flume NG to
collect and capture external network data, log system
and documents, and process more semi-structured or
unstructured data. In the face of structured data in
each sub-business system, Sqoop component can be
used to complete the transmission between data in
local relational databases such as MySQL and Oracle
and HDFS, Hbase or Hive. Sqoop uses JDBC to
import and export data. Users can use Java language
to perform related operations. Figure 4 shows the
code instructions for transferring MySQL data to
HDFS.
Figure 4: Sqoop data conducts code instructions.
4.2 Data Warehouse
All kinds of data information will be collected
through conversion, cleaning, filtering, reprinting and
other operations, the purpose is to filter the
unreasonable or do not meet the requirements of the
data, and unify the data into a standard format, delete
disorderly components, in order to facilitate the use
of subsequent data analysis and mining after writing
data warehouse. Hive is built on the concept of
building traditional databases and data warehouses.
Unlike traditional ETL tools, Hive can load and
BDEDM 2022 - The International Conference on Big Data Economy and Digital Management
596

transform unstructured, structured, and semi-
structured data in distributed file system (HDFS)
based on Hadoop architecture. Hive supports the
Hadoop-based Mapreduce computing framework of
HQL for data processing. For complex and large
amounts of data, Hive can use buckets and partitions
(static and dynamic partitions) to reorganize and store
data to improve the computing efficiency of
subsequent data analysis and statistics.
4.3 Data Analysis
OLAP implements online analysis based on Kylin. It
is deployed in Hive and Hbase architecture, uses
MapReduce to save original data cleaning calculation
results in Hive, and relies on RestAPI, JDBC, and
ODBC interfaces to provide query. The core function
of Kylin is to solve the data analysis requirements of
massive data in big data systems, which can reduce
the delay caused by tens of billions of data queries in
Hadoop/Spark. Kylin provides the data resource
application integration capability with the business
intelligence big data analysis platform, and supports
the online analysis and processing mechanism, which
can facilitate users to rapidly process data
information from various aspects in an interactive
way and achieve the purpose of in-depth
understanding of data.
4.4 Data Visualization
Data visualization aims to visually display and
express the results of data analysis through graphical
pages. Data visualization is only the final display
results presented by the business intelligence big data
analysis platform. Data visualization emphasizes
human-machine visual interaction and relies on big
data technology for data processing and analysis.
Visualization can increase the flexibility of data
information expression and facilitate users to better
and more efficient extraction of data value.
Another powerful feature of data visualization is
that it can connect data information that basically has
no correlation relationship. It not only supports static
graphics display in Excel, but also supports dynamic
graphics in Echarts, which can effectively reflect the
real-time changes of data in enterprise economic
operation. It has become an important component of
business intelligence big data analysis platform to
realize data sharing, data-assisted decision making,
intelligent data warning and other functions.
5 CONCLUSIONS
Based on big data technology of business intelligence
data analysis platform, can be combined with new
structure on the perspective of economics, as a whole
forms of national policy, regional development
characteristics, the market economic operation
mechanism, the enterprise itself structure of factor
endowments such as data resources reasonable
allocation and comprehensive management,
emphasis on innovation to guide the application of
high and new technology to drive the adjustment of
industrial structure under the completed quickly. The
integration of big data technology from the external
environment to the internal integration of the overall
application. "Digital industry, enterprise management
digitalization, digital value" development, promote
the data integration of information technology and its
industrial innovation, inventory and integration of
enterprise data resources as the core, to provide
strong support for enterprises of the industrial
structure adjustment, also for the regional social and
economic development, industrial structure
adjustment and innovation provides a new train of
thought.
REFERENCES
Cao Qianqian. Design and implementation of telecom big
data analysis based on Hadoop [D]. Xi'an University of
Science and Technology. 2015.06.
Development and Reform Commission: The adjustment of
industrial structure continues to advance. Central
government portal. See http://www.gov.cn
/xinwen/2016-08/10/content_5098691.htm.
Lv Mingyuan, Miao Xiaodong. Can big data help optimize
China's manufacturing structure? [J]. Journal of
Yunnan University of Finance and Economics.2020.03.
The Prospect of China's Industrial Structure Adjustment
and Development in 2020 [R]. Saidi Think Tank.
Yang Chao. Research on Key Technology of BI Based on
Big Data Technology [D]. South China University of
Technology.2016.03.
Innovative Application of Big Data Analysis Technology in Regional Industrial Structure Adjustment based on the Perspective of New
Structural Economics
597
