
Experimental Study on Adsorption of Methylene Blue in Wastewater
by Bamboo Leaves Powder
Fang Zhang
a
, Boxu Jia
b
, Huiping Xiao
c
and Fangfang Li
d
Environmental Engineering of City Construction Department, Wenhua College, No. 8, wenhuayuan Road, Wuhan East
Lake High-tech Development Zone, Wuhan, China
Keywords: Dye Wastewater, Adsorption, Bamboo Leaves, Software Simulation, Software Optimization.
Abstract: Adsorption is one of the common methods for treating dye wastewater. The existing adsorbents still have
the problems of high cost, difficult disposal and secondary pollution. Agricultural and forestry wastes with
low price and rich sources can be applied to the treatment of dye wastewater. The effect of bamboo leaf
powder on the adsorption of methylene blue was studied. The effects of particle size, dosage, temperature,
adsorption time and pH on the adsorption effect were studied. The results showed that the optimal single
factors were: the particle size is less than 0.25mm, the dosage is 0.4g/100mL, the temperature is 20 ℃, the
adsorption time is 50min and pH is 8. Study on the adsorption kinetics indicated that pseudo-second-order
kinetic model could better describe the kinetic behaviour. Comprehensively considering the interaction
among multiple factors, the optimization experiment was designed by the Optimal mode of Design-Expert
software, and the factors were optimized by the response surface method. The results showed that the
optimal conditions were: the dosage is 5.37g/L, the adsorption time is 65.47min, the temperature is 25.17
℃, and pH is 6.7. The results showed that bamboo leaf is a potential natural adsorbent for methylene blue in
wastewater.
1 INTRODUCTION
1
Most of the dyes contained in dye industrial
wastewater are synthetic dyes with stable molecular
structure and poor biodegradability. It is an
important factor causing water pollution. Fenton
oxidation, catalytic oxidation, biodegradation and
adsorption are often used in the treatment of dye
wastewater. Among them, adsorption is widely
recognized because of its low cost, simple treatment
method and high treatment efficiency (Gao 2018,
Donkadokula 2020).
Among the existing adsorbents, activated carbon
has good adsorption properties, but it is not suitable
for the primary treatment of dye wastewater because
of its high cost and difficult regeneration. Mineral
adsorbents, coal and slag adsorbents have a wide
range of raw materials and low cost, but the
subsequent disposal is difficult and the secondary
a
https://orcid.org/0000-0002-8466-4458
b
https://orcid.org/0000-0002-3508-6524
c
https://orcid.org/0000-0002-6423-6958
d
https://orcid.org/0000-0001-6793-3452
pollution is also a problem that cannot be ignored.
The adsorption resin has good effect, easy
regeneration and simple operation, but the high cost
limits its large-scale use. As a possible adsorbent,
agricultural and forestry wastes have the advantages
of low price and rich sources, and can be applied to
the treatment of dye containing wastewater.
China is the country with the most abundant
bamboo resources in the world. Bamboo can not
only be used for physical processing and making
appliances, but also for extracting chemicals from
bamboo knots, leaves, branches and roots. Bamboo
charcoal and bamboo vinegar can be prepared by
pyrolysis. Bamboo charcoal can be used as fuel, and
to make activated carbon and then applied in
environmental pollution control, and as conductive
materials (Zhang 2020, Isa 2016, Jiang 2021).
Bamboo vinegar can be used as soil disinfectant,
composting accelerator, feed additive and plant
growth regulator (Zhang 2021). As a kind of forestry
waste, bamboo leaves have the potential to adsorb
dye molecules in wastewater. At present, there are
few reports on the adsorption of dyes in wastewater
by bamboo leaves (Wu 2019, Yang 2017).
166
Zhang, F., Jia, B., Xiao, H. and Li, F.
Experimental Study on Adsorption of Methylene Blue in Wastewater by Bamboo Leaves Powder.
DOI: 10.5220/0011192800003443
In Proceedings of the 4th International Conference on Biomedical Engineering and Bioinformatics (ICBEB 2022), pages 166-174
ISBN: 978-989-758-595-1
Copyright
c
2022 by SCITEPRESS – Science and Technology Publications, Lda. All rights reserved

In this study, bamboo leaves were used as raw
materials and methylene blue aqueous solution was
used to simulate the wastewater containing
methylene blue. The effects of adsorption conditions
such as bamboo leaf powder particle size, dosage,
temperature and pH on the adsorption effect of
methylene blue in wastewater were studied, and the
mechanism of adsorption process was explained by
fitting the adsorption kinetics. Finally, the Optimal
model of Design-Expert was used to optimize the
experimental design of response surface, and the
optimal reaction conditions of bamboo leaf powder
adsorbing methylene blue were obtained.
2 MATERIALS AND METHODS
2.1 Materials
The Moso bamboo leaves were collected from the
campus and washed with tap water, then rinsed with
distilled water, and dried in an oven at 60 ℃. The
dried bamboo leaves were then grinded into powder,
screened to obtain powder with particle sizes of <
0.25mm, 0.25-0.4mm, 0.4-0.5mm, 0.5-0.8mm and
0.8-1.0mm, and then stored in sealed bags. The main
reagents used in the experiment are methylene blue
(analytical purity), HCl (analytical purity) and
NaOH (analytical purity).
2.2 Instruments
Main instruments used in this study contains
thermostatic oscillator (SKY-200B), ultraviolet
spectrophotometer (UV2450) and pH meter (PB-10).
2.3 Methods
2.3.1 Effect Evaluation of Bamboo Leaf
Powder Adsorbing Methylene Blue
Title
(1) Standard curve of absorbance and methylene
blue solution concentration
Methylene blue solution with concentration of
100mg/L was prepared and diluted to 2, 4, 5, 6 and
8mg/L, respectively. After zeroing with distilled
water at 662nm on the ultraviolet spectrophotometer,
the absorbance of the diluted solutions was
measured. The standard curve was drawn with the
concentration of methylene blue solution as the
abscissa and the absorbance as the ordinate, and the
standard curve equation was obtained.
(2) Evaluation of adsorption effect
The absorbance of methylene blue aqueous
solution before and after adsorption was determined
by ultraviolet spectrophotometer, the concentration
of methylene blue was calculated according to the
standard curve, and the adsorption effect was
evaluated by the removal efficiency:
0
0
= 100%
i
cc
c
η
−
×
(1)
Where: η is the adsorption removal efficiency; c
0
and c
i
are the concentration of methylene blue in
solution before and after adsorption, mg/L.
2.3.2 Effect of Adsorption Factors on the
Adsorption
Several conical bottles with volume of 250mL were
prepared, 100 mL methylene blue solution with a
certain concentration and bamboo leaf powder with
a certain quality were added into each conical bottle,
and then stirred at a speed of 150r/min for a certain
time at a certain temperature. After stirring, the
mixture in the conical flask was filtered with 0.45
μm filter membrane to obtain filtrate. The original
methylene blue solution and the filtrate were diluted
and their absorbance were determined by the
ultraviolet spectrophotometer at the wavelength of
662nm, the concentration of methylene blue were
calculated and the adsorption effect was evaluated.
Factors such as particle sizes and dosage of bamboo
leaf powder, temperature, adsorption time, pH and
the initial concentrations of methylene blue solution
were taken into consideration when discuss the
effect of adsorption conditions on the adsorption.
2.3.3 Adsorption Kinetics
The concentration of methylene blue in the solution
at different times of adsorption reaction was
determined, and the results were fitted by the
pseudo-first-order kinetic equation and the pseudo-
second-order kinetic equation (Travin 2019, Francis
2021), then the kinetic equation most suitable for the
behaviour of bamboo leaf powder adsorbing
methylene blue in water is obtained by comparison.
The pseudo-first-order kinetic equation:
1
ln( - )=ln
et e
qq q kt−
(2)
The pseudo-second-order kinetic equation:
2
2
1
tee
tt
qkqq
=+
(3)
Experimental Study on Adsorption of Methylene Blue in Wastewater by Bamboo Leaves Powder
167
Where: q
e
is the equilibrium adsorption capacity
of bamboo leaf powder for methylene blue, mg/g; q
t
is the adsorption capacity of bamboo leaf powder for
methylene blue at time t, mg/g; t is the reaction time,
min; k
1
is the adsorption rate constant, min
-1
; k
2
is
the adsorption rate constant, g/mg · min.
2.3.4 Response Surface Optimization Test
Four factors of bamboo leaf powder dosage,
adsorption time, temperature and pH were selected
in the response surface optimization test. The range
of each factor level included the corresponding value
with the highest removal efficiency in the test results
in 2.3.2. The removal efficiency of methylene blue
by bamboo leaf powder was taken as the response
value, the response surface test was designed by
Design-Expert 8.0.6 software. The factors were
optimized through the test results, and the best
process parameters were obtained.
3 RESULT AND DISCUSSION
3.1 Effect of Adsorption Conditions on
the Adsorption
3.1.1 Effect of Bamboo Leaf Powder Particle
Size on the Adsorption
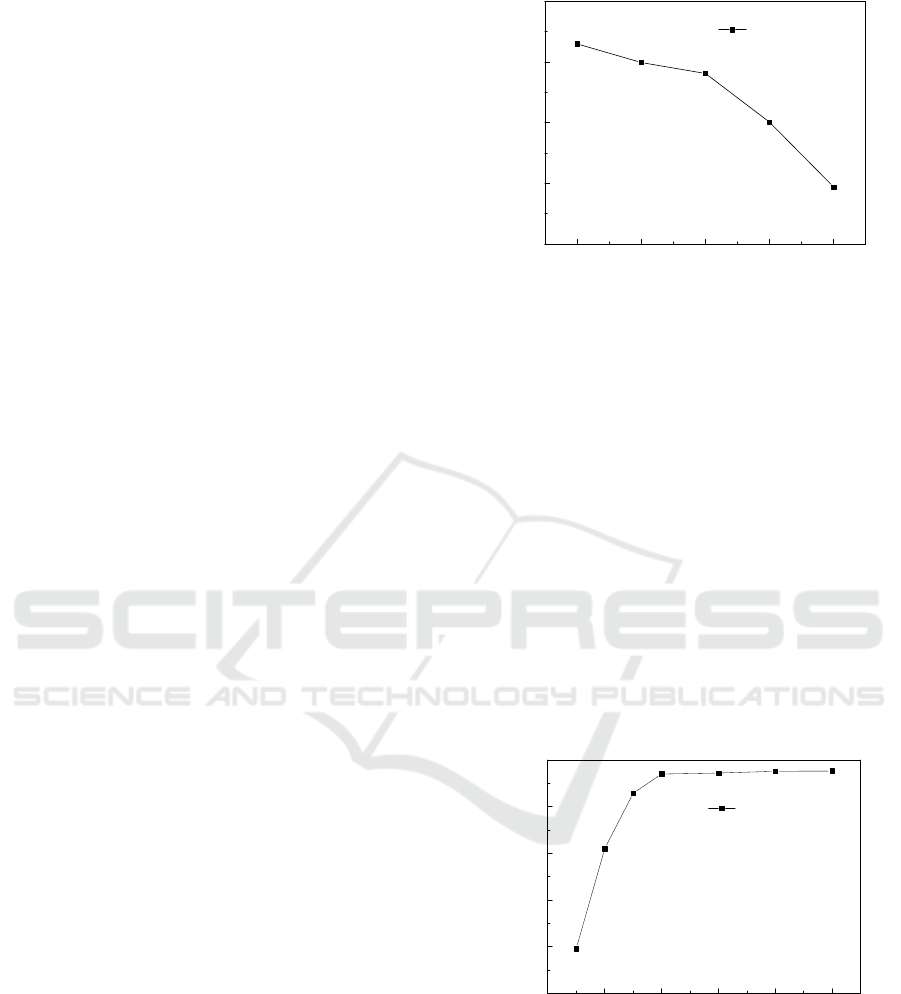
The effect of bamboo leaf particle sizes on the
adsorption is shown in Figure 1. The particle sizes
were determined as <0.25mm, 0.25-0.4mm, 0.4-
0.5mm, 0.5-0.8mm and 0.8-1.0mm, respectively, the
dosage is 0.5g, and the initial concentration of the
methylene blue solution was 100mg/L. As shown in
Figure 1, as the particle size gradually increases, the
removal efficiency gradually decreases. When the
particle size is less than 0.25mm, the removal
efficiency reaches 93% and removal effect is the
most significant. When the particle size increased to
0.8-1mm, the removal efficiency was only 69.4%.
This is because the specific surface area of solid
adsorption materials increases with the decrease of
particle size. Therefore, bamboo leaf powder with
particle size less than 0.25mm was selected as the
material for subsequent tests.
<0.25 0.25-0.40 0.40-0.50 0.50-0.80 0.80-1.00
60
70
80
90
100
removal efficiency (%)
particle sizes (mm)
removal efficiency
Figure 1: Effect of particle size on the removal efficiency.
3.1.2 Effect of Bamboo Leaf Powder Dosage
on the Adsorption
The effect of bamboo leaf powder dosage on the
adsorption is shown in Figure 2. In this test, different
dosage of bamboo leaf powder with particle size less
than 0.25mm was added into methylene blue
solution with initial concentration of 100mg/L, and
the dosage was determined as 0.1, 0.2, 0.3, 0.4, 0.6,
0.8 and 1.0g/100mL, respectively. It can be seen
from Figure 2 that the removal efficiency increases
with the increase of the dosage. When the dosage
increases from 0.1 to 0.4g/100mL, the removal
efficiency increases obviously. Then, when the
dosage increases furtherly, the removal efficiency
changes little and the adsorption tends to be
saturated. Therefore, the optimum dosage of bamboo
leaf powder under this condition is 0.4g/100mL.
0.00.20.40.60.81.0
50
60
70
80
90
100
removal efficiency (%)
dosage (g/100mL)
removal efficiency
Figure 2: Effect of dosage on the removal efficiency.
3.1.3 Effect of Temperature on the
Adsorption
The effect of temperature on the adsorption is shown
in Figure 3. In this test, 0.4g bamboo leaf powder
with particle size less than 0.25mm was added into
the methylene blue solution with concentration of
ICBEB 2022 - The International Conference on Biomedical Engineering and Bioinformatics
168
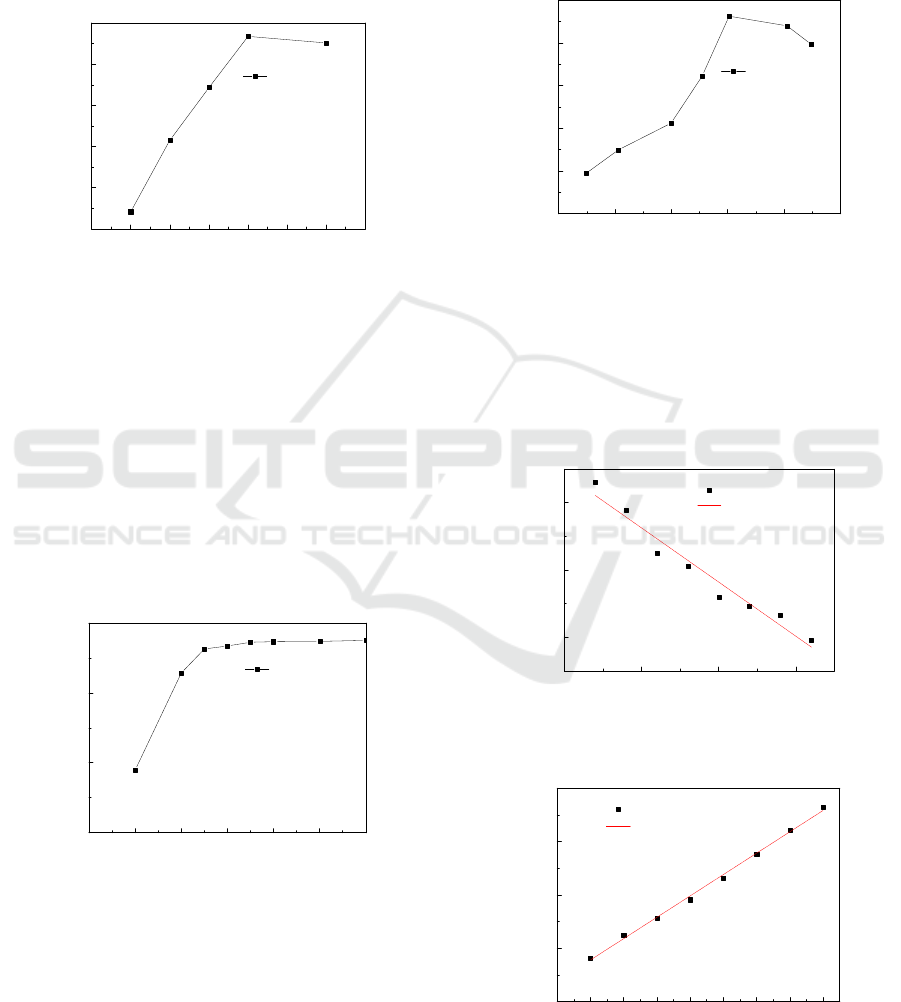
100mg/L. The temperatures were determined as 5,
10, 15, 20, 30, 40, 50 and 60 ℃ respectively. In
Figure 3, with the increase of temperature, the
removal efficiency increases in the range of 5-20 ℃,
and then decreases slowly with the increase of
temperature, and reached a maximum of 96.8% at 20
℃. Therefore, the optimum temperature for the
adsorption is 20 ℃.
0 5 10 15 20 25 30 35
50
60
70
80
90
100
removal efficiency (%)
temperature (℃)
removal efficiency
Figure 3: Effect of temperature on the removal efficiency.
3.1.4 Effect of Time on the Adsorption
The effect of time on the adsorption is shown in
Figure 4. This test was carried out with temperature
of 20 ℃, bamboo leaf powder dosage of 0.4g with
particle size less than 0.25mm, and with an initial
concentration of 100mg/L. The adsorption reaction
time was 20, 40, 60, 80,100,120, 140 and 160 min,
respectively. It can be seen from Figure 4 the
removal efficiency increases obviously in the first 50
min during the process and then tends to be stable,
and the adsorption basically reaches the saturation
state.
0 20406080100120
85
90
95
100
removal efficiency (%)
time (min)
removal efficiency
Figure 4: Effect of adsorption time on methylene blue
removal efficiency.
3.1.5 Effect of pH on the Adsorption
The effect of pH on the adsorption is shown in
Figure 5. The test was carried out with temperature
of 20 ℃, bamboo leaf powder dosage of 0.4g with
particle size less than 0.25mm, and with an initial
concentration of 100mg/L. The pH of the reaction
system was adjusted by diluted HCl and diluted
NaOH solution. It can be seen from Figure 5 that the
removal efficiency increases with the increase of pH
in the range of pH 3-8 and reaches the maximum at
about pH 8. After that, the removal efficiency
decreased gradually with the increase of pH.
24681012
50
60
70
80
90
100
removal efficiency (%)
pH
removal efficiency
Figure 5: Effect of pH on the removal efficiency.
3.2 Adsorption Kinetics
The relationship between adsorption capacity and
adsorption time in pseudo-first-order kinetic
equation and pseudo-second-order kinetic equation
is shown in Figure 6 and Figure 7. The parameters of
the kinetic equation are shown in Table 1.
0 50 100 150
-2
0
2
ln(q
e
-q
t
)
Linear Fit of ln(q
e
-q
t
)
ln(q
e
-q
t
)
t (min)
Figure 6: Fitting for the pseudo-first-order kinetic
equation.
0 20 40 60 80 100 120 140 160
0
2
4
6
8
t/q
t
Linear fit of t/q
t
t/q
t
t (min)
Figure 7: Fitting for the pseudo-second-order kinetic
equation.
Experimental Study on Adsorption of Methylene Blue in Wastewater by Bamboo Leaves Powder
169
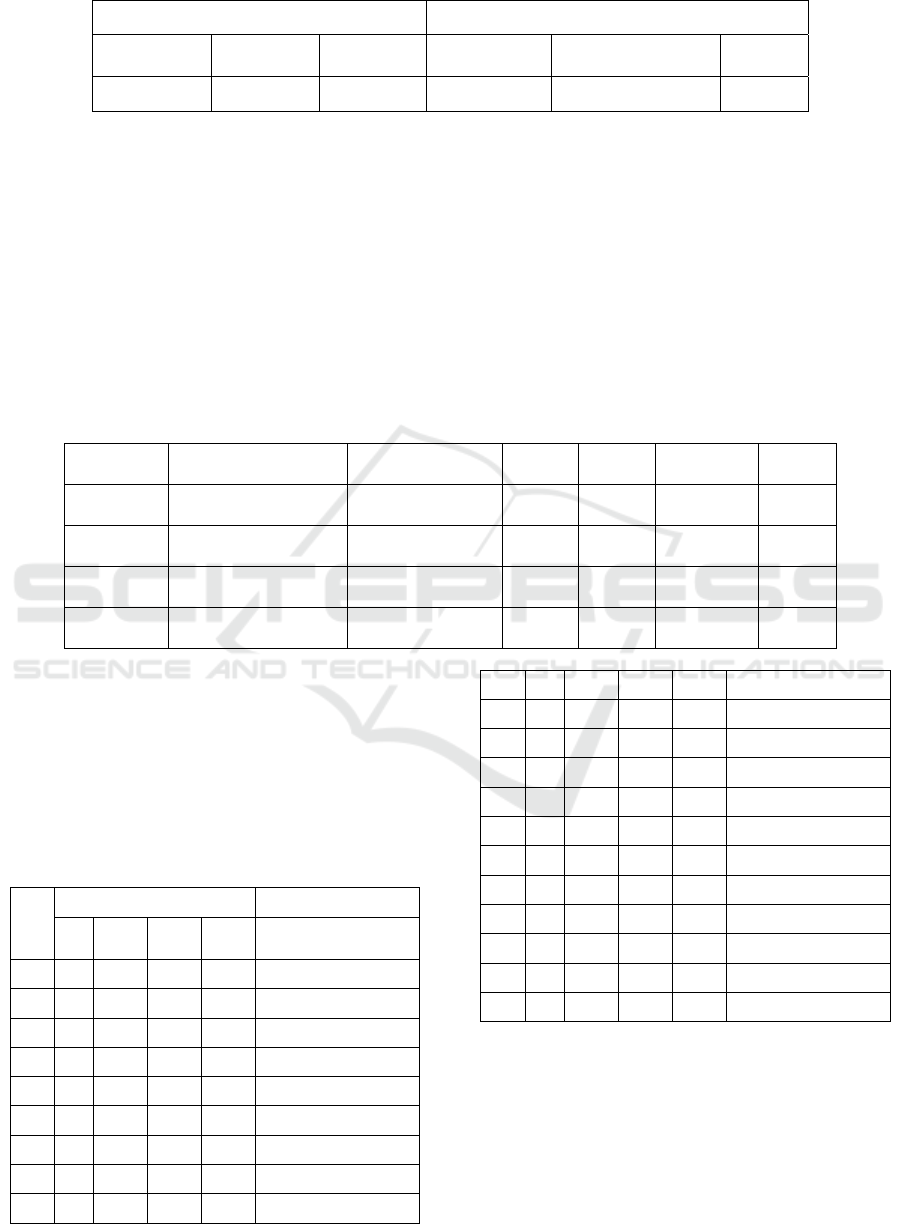
Table 1: Parameters of the kinetic equation.
Pseudo-first-order equation Pseudo-second-order equation
q
e
(mg/g)
k
1
(min
-1
)
R
2
q
e
(mg/g)
K
2
(g/mg·min)
R
2
17.52 0.0322 0.959 24.94 0.0021 0.997
Table 1 reveals that the linear correlation of
pseudo-first-order and pseudo-second-order kinetic
model fitting are relatively good, and the
coefficients are 0.959 and 0.997, respectively. In
terms of the linear correlation coefficient, pseudo-
second-order kinetic model can better describe the
kinetic behaviour of the adsorbing.
3.3 Response Surface Test
3.3.1 Test Scheme and Results
In order to determine the best combination of
experimental variables through fewer experiments,
the response surface method (RSM) was applied.
The coupling effect of main reaction factors on
removal efficiency was studied by test designed by
the Optimal mode in Design-Expert software, and
the value of independent variables was optimized.
The optimum conditions were obtained by
optimization with the highest adsorption removal
efficiency as the goal. The resume of RSM
experimental design is shown in Table 2.
Table 2: Parameters of the kinetic equation.
Factor Name Dimension min max Mean value Std. Dev.
A Dosage g/L 3 7 5.278 1.738
B Time min 40 80 59.31 15.75
C Temperature ℃ 10 40 24.56 13.05
D pH
4 10 6.952 2.556
The tests are carried out with an initial
concentration of methylene blue of 100mg/L, a
particle size of bamboo leaf powder of less than
0.25mm and a stirring speed of 150r/min. The test
scheme and result are shown in Table 3. The tests
are carried out three times, and the experimental
results are expressed as the average value.
Table 3: RSM test scheme and result.
No.
Independent variable Response variable
A B C D
Removal efficiency,
%
1 7.00 72.80 40.00 4.00 82.78
2 5.06 40.00 20.80 10.00 88.78
3 7.00 80.00 20.80 6.89 89.84
4 3.00 60.60 25.60 9.57 88.37
5 6.80 52.00 24.90 6.50 92.53
6 7.00 60.80 10.00 10.00 86.93
7 3.00 40.00 10.00 7.09 72.09
8 3.00 80.00 10.00 10.00 74.23
9 3.00 59.20 20.97 4.00 78.86
10 4.60 64.00 40.00 7.64 91.12
11 3.00 40.00 40.00 10.00 79.12
12 3.74 40.00 40.00 4.00 72.72
13 7.00 40.00 10.00 4.00 75.3
14 7.00 80.00 40.00 10.00 69.34
15 7.00 40.00 10.00 4.00 74.63
16 4.90 80.00 10.00 4.00 87.53
17 3.00 80.00 40.00 4.00 86.18
18 7.00 72.80 40.00 4.00 86.28
19 7.00 40.00 40.00 8.95 83.62
20 7.00 60.80 10.00 10.00 84.12
21 4.74 62.60 12.70 7.36 92.37
3.3.2 Parametric Model and Analysis of
Variance
The main parameter data of the model fitted for
response variable and the analysis of variance are
shown in Table 4 and Table 5, respectively.
According to the results, the quadratic model is
selected. The significant coefficient p of the model is
ICBEB 2022 - The International Conference on Biomedical Engineering and Bioinformatics
170
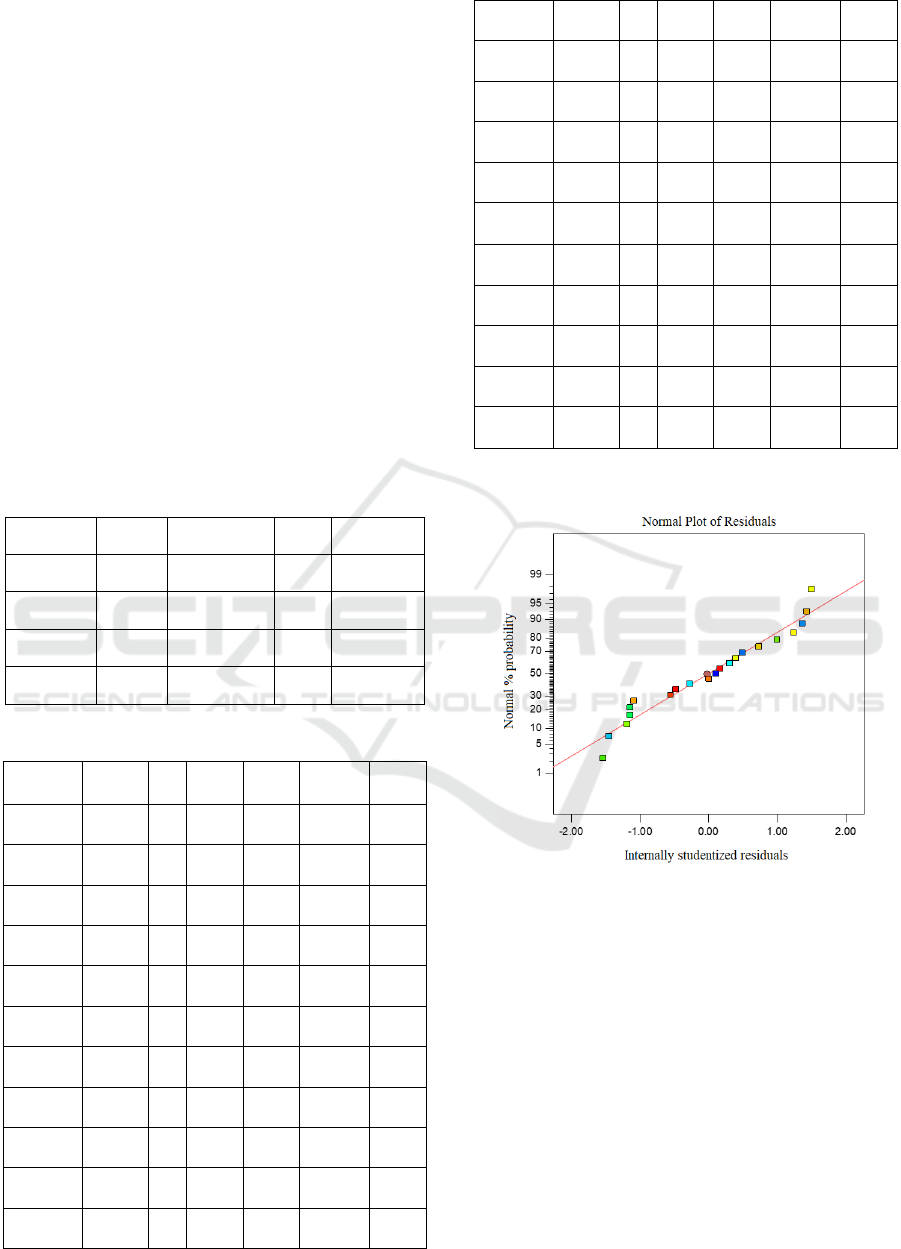
0.0001, and the p of the lack of fit term is 0.6848
(>0.05), indicating that the model is significant, but
the lack of fit is not significant. The determination
coefficient R
2
is 0.9500, which shows that the model
fits well with the actual situation and the error is
small. It can accurately analyse and predict the
removal efficiency. The F value of the model is
28.13, while the F value of the lack of fit is 0.5449,
indicating that the model is significant, the mismatch
term is not significant, and 68.48% of the F value of
the mismatch term may be caused by noise. The
coefficient of variation of the model is 1.9689%
(<5%), indicating that the model has high reliability
and sufficient experimental data. The precision is
17.31 (>4), which shows that the signal of the fitting
model is sufficient and the fitting is reasonable.
Figure 8 shows that the normal distribution linearity
of the residual and the fitting effect of the model are
good. The above results show that the fitting model
has high reliability and precision.
Table 4: The main parameter data of the model.
Resource p p(Lack of fit) R²
Linear 0.8300 0.0139 0.1455
2FI 0.2563 0.0154 0.0515
Quadratic 0.0001 0.6848 0.9500 Suggested
Cubic 0.6848 - 0.9352 Aliased
Table 5: The analysis of variance.
Variance
source
Sum of
S
q
uares
DF
Mean
S
q
uare
F
p
(p
rob>F
)
Signifi
cance
Model 1044.09 14 74.58 28.13 0.0003 **
A 69.66 1 69.66 26.27 0.0022 *
B 54.89 1 54.89 20.70 0.0039 **
C 5.08 1 5.08 1.91 0.2157 *
D 3.46 1 3.46 1.30 0.2969 **
AB 47.70 1 47.70 17.99 0.0054
*
AC 63.19 1 63.19 23.83 0.0028
AD 21.86 1 21.86 8.24 0.0284
*
BC 4.77 1 4.77 1.80 0.2283
BD 216.79 1 216.79 81.76 0.0001
*
CD 13.66 1 13.66 5.15 0.0637
A
2
55.43 1 55.43 20.91 0.0038
**
B
2
57.27 1 57.27 21.60 0.0035
**
C
2
56.60 1 56.60 21.35 0.0036
**
D
2
86.49 1 86.49 32.62 0.0012
**
Residual
15.9091 6 2.65
Lack of
Fit
5.6116 3 1.87 0.5449 0.6848
Pure Error
10.30 3 3.43
Cor Total
1060.00 20
R
2
0.9850
C.V. %
1.9689
Adeq.
Precision
17.31
Note: *p<0.05, significant, **p<0.01, extremely
significant.
Figure 8: Normal distribution diagram of residual
probability.
3.3.3 Single Factor Effect Analysis
In RSM test, the fluctuation diagram of A (dosage),
B (time), C (temperature) and D (pH) factors is
shown in Figure 9. The independent variables in this
experiment have square effect, linear effect and
interaction with the response variables. With the
increase of factor level, the response value first rises
and then decreases slowly. From the fluctuation
range of response variable, the fluctuation of each
factor from high to low is A, B, D, and C. Therefore,
the influence of various factors on the removal
efficiency is A, B, D and C from high to low.
Experimental Study on Adsorption of Methylene Blue in Wastewater by Bamboo Leaves Powder
171
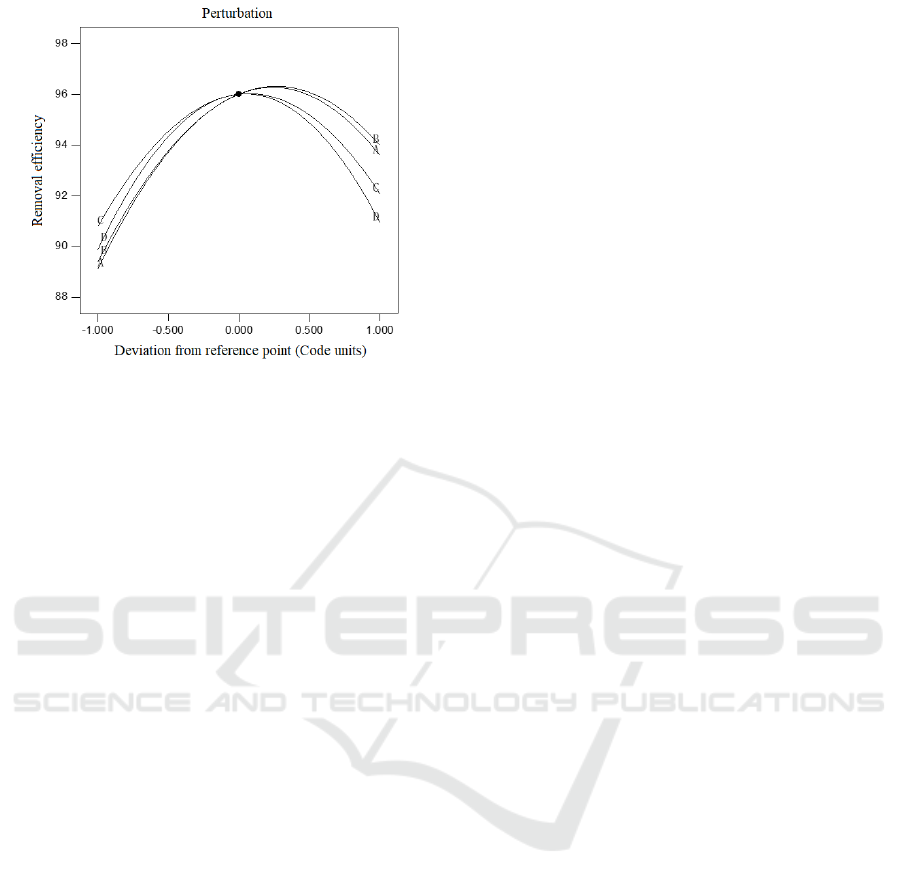
Figure 9: The fluctuation diagram of single factor.
3.3.4 Analysis of Interaction among Factors
The reaction surface analysis diagram is a three-
dimensional diagram composed of reaction values
and any experimental factors, showing the influence
of the other two variables on the test efficiency when
two of the factors A, B, C and D are at the
intermediate level. However, when the two factors
interact, the influence of one factor on the other
factor is different at different levels. The response
surface of this study basically presents an open form,
that is, with the increase of factor level, the removal
efficiency shows a trend from high to low. The
contour map is a curve formed on the lower surface
with the same factor value on the surface. The closer
the contour is to the circle, the smaller the
interaction between them. The closer the contour of
the ellipse is, the greater the interaction between the
two. The density of the contour line reflects the
factors affecting the removal efficiency. The denser
the contour, the greater the effect on the removal
efficiency.
The pairwise interaction between the factors is
shown in Figure10. The contour map of the
interaction between A and B is shown in
Figure10(a). The oval contour indicates that there is
interaction between A and B. The contour density of
A is higher than that of B, indicating that A has a
greater impact on the removal efficiency than B. The
response surface showed that the removal efficiency
increased rapidly with the increase of A, and then
begins to decline slowly when the dosage exceeds a
certain value (5-6g/L). With the increase of B, the
removal efficiency increases slowly and then
decreases slowly, and reaches the maximum when
the time during 56-72 min. The contour map of the
interaction between A and C is shown in
Figure10(b). The oval contour lines indicate that
there is interaction between A and C. The contour
density of A is higher than that of C, indicating that
the impact on removal efficiency of A is greater than
that of C. The response surface diagram shows that
the removal efficiency increases slowly with the
increase of A, and then decreases slowly when the
dosage exceeds a certain value (5-6g/L). With the
increase of C, the removal efficiency first increases
slowly and then decreases slowly, and reaches the
maximum when the temperature reaches 22-27℃.
The contour map of the interaction between A and D
is shown in Figure10(c). The oval contour line
indicates that there is interaction between A and D.
The contour density of A is greater than D,
indicating that A has a greater impact on the removal
efficiency than D. The response surface showed that
the removal efficiency increased slowly with the
increase of A level, and then begins to decline
slowly when the dosage exceeds a certain value (5-6
g/L). The removal efficiency increases slowly with
the increase of D, and begins to decline slowly when
pH exceeds a certain value (6.5-7.5). The contour
map of the interaction between B and C is shown in
Figure10(d). The contours of B and C are close to
circular, indicating that the interaction between B
and C is not obvious. The density of B is greater
than C, indicating that the effect of B on adsorption
is greater than C. The response surface showed that
the removal efficiency increased slowly with the
increase of B, and then begins to decrease slowly
when the time exceeds a certain value (60-70min).
With the increase of C, the removal efficiency
increases slowly and then decreases gradually, and it
reaches the maximum when the temperature reaches
22-27℃. The contour map of the interaction
between B and C is shown in Figure10(e). The oval
contour indicates that there is interaction between B
and D. The contour thickness of B is greater than D,
indicating that B has a greater impact on the removal
efficiency than D. The reaction surface showed that
the removal efficiency increased rapidly with the
increase of B, and then decreased slowly after the
time exceeding a certain value (60-70min). The
removal efficiency increased rapidly with the
increase of D, and then begins to decline slowly
when pH exceeds a certain value (6.5-7.5). The
contour map of the interaction between C and D is
shown in Figure10(f). The contour lines of C and D
are close to circular, indicating that the interaction
between C and D is not obvious. The contour line
thickness of D is greater than C, indicating that D
has a greater impact on the removal efficiency than
ICBEB 2022 - The International Conference on Biomedical Engineering and Bioinformatics
172
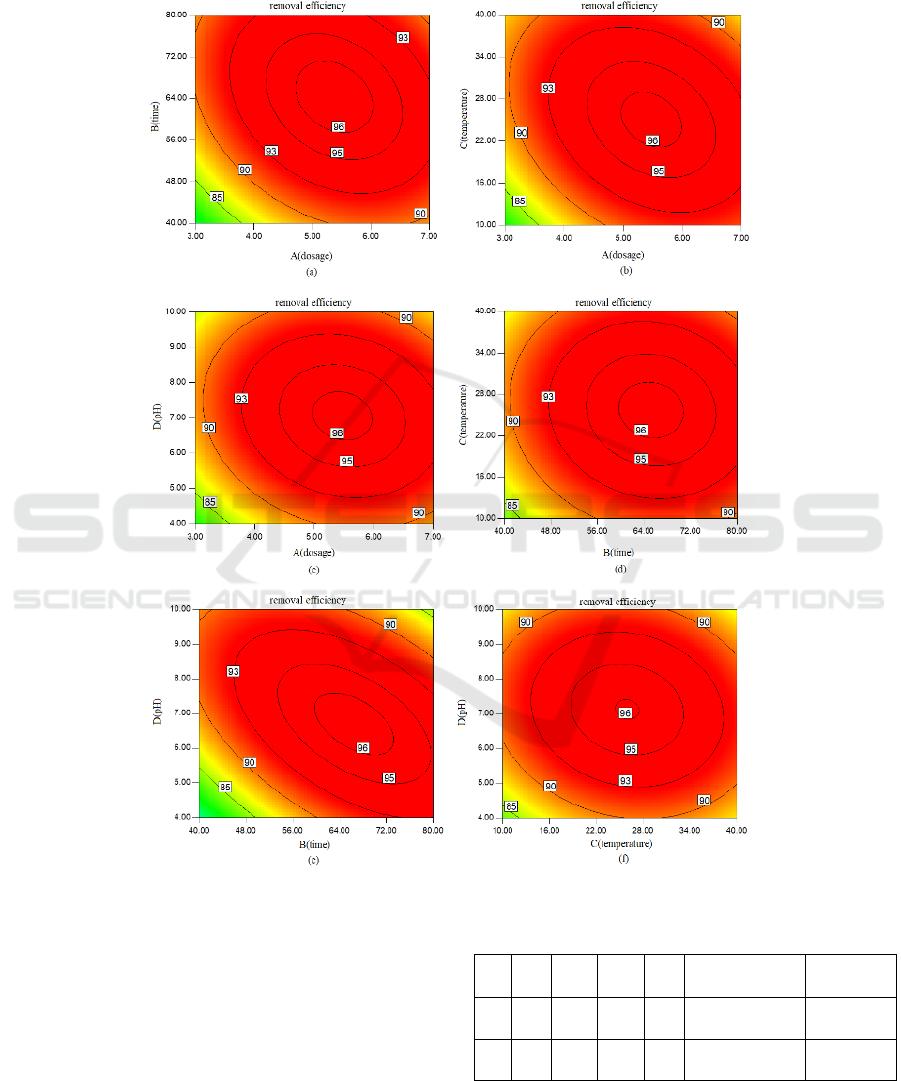
C. The reaction surface showed that the removal
efficiency first increased slowly and then decreased
slowly with the increase of C. The removal
efficiency reaches the maximum when the
temperature reaches 24-28℃. With the increase of
D, the removal efficiency increased slowly and then
begins to decline slowly when pH exceeds a certain
value (6.5-7.5).
Figure 10: Pairwise interaction between the factors on removal efficiency.
3.3.5 Optimization of Adsorption
Conditions
Two adsorption schemes are recommended by RSM
optimization. The optimal adsorption conditions are:
dosage of 5.37g/L, adsorption time of 65.47min,
temperature of 25.17 ℃, and pH of 6.7. The
theoretical predicted value of the removal efficiency
is 96.5145%, and the expected value reaches 1.0, as
shown in the Table 6.
Table 6: The optimal adsorption schemes.
No. A B C D
Removal
Efficienc
y
(
%
)
Desirability
1 5.37 65.47 25.17 6.70 96.5145 1
2 5.36 65.69 25.11 6.68 96.5142 0.999989
Experimental Study on Adsorption of Methylene Blue in Wastewater by Bamboo Leaves Powder
173

4 CONCLUSIONS
(1) Bamboo leaf is a potential natural adsorbent for
methylene blue in wastewater.
(2) The best adsorption effect could be obtained
when the particle size of bamboo leaf powder was
less than 0.25mm, the dosage was 0.4g/100mL, the
temperature was 20 ℃, the adsorption time was
50min and the pH was 8, respectively.
(3) Pseudo-second-order kinetic model can better
describe the kinetic behaviour of bamboo leaf
powder adsorbing methylene blue in wastewater.
(4) Comprehensively considering the influence of
various factors on the adsorption effect, the optimal
conditions for the adsorption were as follows: the
dosage is 5.37g/L, the adsorption time is 65.47min,
the temperature is 25.17 ℃, and pH is 6.7. The
theoretical predicted value of removal efficiency is
96.5145%.
ACKNOWLEDGEMENTS
The authors acknowledge support from the Doctor
Fund Project of Wenhua College (2019Y03).
REFERENCES
Donkadokula, N. Y., Kola, A. K., Naz, I., Saroj, D.
(2020). A review on advanced physico-chemical and
biological textile dye wastewater treatment techniques.
J. Reviews in Environmental Science and
Bio/Technology. 19, 543- 560.
Francis, A. O., Zaini, M. A. A., Zakaria, Z. A.,
Muhammad, I. M., Abdulsalam, S. U., EINafaty, A.
(2021). Equilibrium and kinetics of phenol adsorption
by crab shell chitosan. J. Particulate Science and
Technology. 39, 415-426.
Gao, Y. Y., Yang, B., Wang, Q. (2018). Biodegradation
and decolorization of dye wastewater: a review. J. IOP
Conference Series: Earth and Environmental Science.
178,12-13.
Isa, S.S.M., Ramli, M.M., Hambali, N.A.M.A., Kasjoo,
S.R., Isa, M.M., Nor, N.I.M., Khalid, N., Ahmad, N.
(2016). Adsorption Properties and potential
applications of bamboo charcoal: Areview. J. MATEC
Web of Conference. 78, 35-46.
Jiang, W.Z., Zhang, W.G., Zi, X., Liu, X.M., Zhang,
W.B., Li, W. Z. (2021). Effect of Recarbonization
Temperature on conductive properties and structure of
bamboo charcoal. J. Materials reports. 8, 8023-8027.
Travin, S. O., Gromov, O. B., Utrobin, D. V., Roshchin,
A. V. (2019). Kinetic Simulation of Adsorption
Isotherms. J. Russian Journal of Physical Chemistry B.
13, 975-985.
Wu, F., Chen, Y., Ma., J. J. (2019). Adsorption of
methylene blue dyes from wastewater by bamboo
leaves powder. J. Anhui Chemical Industry. 45, 33-40.
Yang, X., Zhang, Q., Tang, C., Sun, J., Zhang, Q. L.,
Zhang, L.Q. (2017). Adsorption property of modified
bamboo leaves for the removal of congo red from
wastewater. J. New Chemical Materials. 45, 244-246.
Zhang, C. Y., Zhang, Y. R., We, J. J., Ding, X. Y., Hou,
X. Y., Wang, Q., Li, Y. (2020). Effect of bamboo
charcoal on aerobic composting of kitchen waste. J.
Chinese Journal of Soil Science. 3, 656-660.
Zhang, X., Pan, C., Zhang, Z. (2021). Effects of
Clostridium butyricum combined with bamboo
vinegar on egg quality and intestinal function in late
laying stage. J. Feed Research. 13,57-60.
ICBEB 2022 - The International Conference on Biomedical Engineering and Bioinformatics
174
