
Real-time Distance Measurement in a 2D Image on Hardware
with Limited Resources for Low-power IoT Devices
(Radar Control System)
Jurij Kuzmic and Günter Rudolph
Department of Computer Science, TU Dortmund University, Otto-Hahn-Str. 14, Dortmund, Germany
Keywords: Real-time Distance Measurement, Radar Control System, Autonomous Driving, Object Detection,
Computational Intelligence, Computer Vision.
Abstract: This paper presents an approach for real-time distance measurement in a 2D image on hardware with limited
resources without a reference object. Additionally, different approximated functions for distance
measurement are presented. Here, we focus on an approach to develop real-time distance detection for
hardware with limited resources in the field of the Internet of Things (IoT). Also, our distance measurement
system is evaluated with simulated data, real data from model making area and data from a real vehicle from
real environment. In the beginning, related work of this paper is discussed. The data acquisition of the different
simulated and real data sets is also discussed in this paper. Additionally, dissimilar resolutions for distance
measurement are compared in accuracy and run time to find the better and faster system for distance
measurement in a 2D image on hardware with limited resources for low-power IoT devices. Through the
experiments described in this paper, the comparison of the run time depending on different IoT hardware is
presented. Here, the idea is to develop a radar control system for self-driving cars from model making area
and vehicles from real environment. Finally, future research and work in this area are discussed.
1 INTRODUCTION
Autonomous vehicles are being developed daily in
the autonomous vehicle industry. This development
includes the installation of various sensors and new
electronic components. The autonomous vehicle
needs these sensors to interpret their environment and
interact with it accordingly. In this way the
autonomous vehicles are able to drive independently
without human intervention. But how does the
autonomous vehicle behave if these sensors fail or
provide incorrect measurements? The radar sensor
can measure the distance to the object in front using
electromagnetic waves. Thereby, an autonomous
vehicle is able to keep the distance to the vehicle in
front, acts as a braking or emergency braking assistant
automatically. To check these measurements, this
paper presents an optical control system for the radar
sensor. This radar control system is realised by optical
distance measurement in a 2D image. Also, the stereo
camera can be used for this purpose. This camera
contains two cameras at a certain distance, similar to
the human eye. This delivers two images. These both
images can be used to determine the depth of the
image and distinguish between roads, people, cars,
houses, etc. (Li, Chen and Shen, 2019). Our approach
is to develop this optical radar control system with
only one camera and to perform the distance
measurements to the front object in a 2D image. With
one camera there is only half as much input data to
process. This approach makes it possible to check the
measured values of the radar sensor. Furthermore, our
system operates without a reference object, which is
needed to convert the pixels to the real distance in the
real environment. We emphasize that this system is
not a replacement for the radar sensor, rather it is
intended to serve as an optical distance verification
system.
In order to implement the distance measurements,
the position of the front object must also be known.
This object detection has to be done in real time, as
the distance measurement has also to be done in real
time. Also, the position of these objects in a 2D image
is very important. For example, is the vehicle in front
on the same lane or is it just parked on the side of the
road? Here, a lane detection can be advantageous. To
94
Kuzmic, J. and Rudolph, G.
Real-time Distance Measurement in a 2D Image on Hardware with Limited Resources for Low-power IoT Devices (Radar Control System).
DOI: 10.5220/0011188100003277
In Proceedings of the 3rd International Conference on Deep Learning Theory and Applications (DeLTA 2022), pages 94-101
ISBN: 978-989-758-584-5; ISSN: 2184-9277
Copyright
c
2022 by SCITEPRESS – Science and Technology Publications, Lda. All rights reserved
detect the lane in real time, we have already presented
the filtered Canny edge detection algorithm (Kuzmic
and Rudolph A1, 2021).
The future goal of our work is to switch from the
simulation we developed before (Kuzmic and
Rudolph, 2020) to the real model cars. In case of a
successful transfer of simulation to reality (sim-to-
real transfer), the model car behaves exactly as before
in the simulation. Here, the hardware of these model
cars belongs to the low-power IoT devices with
limited resources.
2 RELATED WORK
There are some scientific papers dealing with distance
measurement, e.g. (Marutotamtama and Setyawan,
2021) who have made a physical distancing detection
using YOLO v3 and bird's eye view transform or
(Rahman et al., 2009) who have developed a person
to camera distance measurement based on eye-
distance. Furthermore, there are (Mahammed,
Melhum and Kochery, 2013) who implemented an
object distance measurement by stereo vision. This
approach requires a 3D camera consists of two
cameras of parallel optical axes. However, there also
some scientific papers that are dealing with the
detection of the objects in real time on hardware with
limited resources for low-power IoT devices. For
example, (Wang, Li and Ling, 2018) who have
developed pelee: a real-time object detection system
on mobile devices. This system reaches 23.6 FPS on
an iPhone 8. Similarly, there are (Jose et al., 2019)
who have researched real-time object detection on
low power embedded platforms. This system operates
at 22 FPS on low-power TDA2PX System on Chip
(SoC) provided by Texas Instruments (TI).
Additionally, there are scientific works that deal with
YOLO real-time object detection for low-power
hardware, such as (Huang, Pedoeem and Chen, 2018)
who have developed YOLO-LITE: a real-time object
detection algorithm optimized for non-GPU
computers or (Jin, Wen and Liang, 2020) who
implemented embedded real-time pedestrian
detection system using YOLO optimized by LNN.
Our approach is to implement a distance
measurement with only one camera with a function
approximation (without a reference object) and to
develop a real-time radar control system for low-
power IoT hardware. Thus, it is possible to develop a
low-cost real-time distance measurement e.g. for
model making or a surveillance camera in a short
time. For this purpose, we use the Raspberry Pi 3 B
and Raspberry Pi 4 B.
3 DATA SETS
Before distance measurements can be conducted,
different data sets are needed. A higher quality of data
increases the chance for a successful distance
measurement with a low error rate. These data sets are
also the basis for a successful distance measurement.
For this purpose, we created different data sets from
simulation, model making area and real environment.
Data from the simulation could be automatically
generated and annotated with our already published
simulator (Kuzmic and Rudolph, 2020). Data from
the model making area and the real environment has
to be created and annotated manually. These
procedures are described in sections 3.1 and 3.2. The
resolution is given in the format width × height. Data
set 1 contains images of a simulation car with the
corresponding distances (Unity unit) with 795
pictures. Data set 2 includes data of a model car
(PiCar) from the model making area with the
corresponding distances (metres) with 30 pictures.
Data set 3 contains images of a real vehicle from the
real world with the corresponding distances (metres)
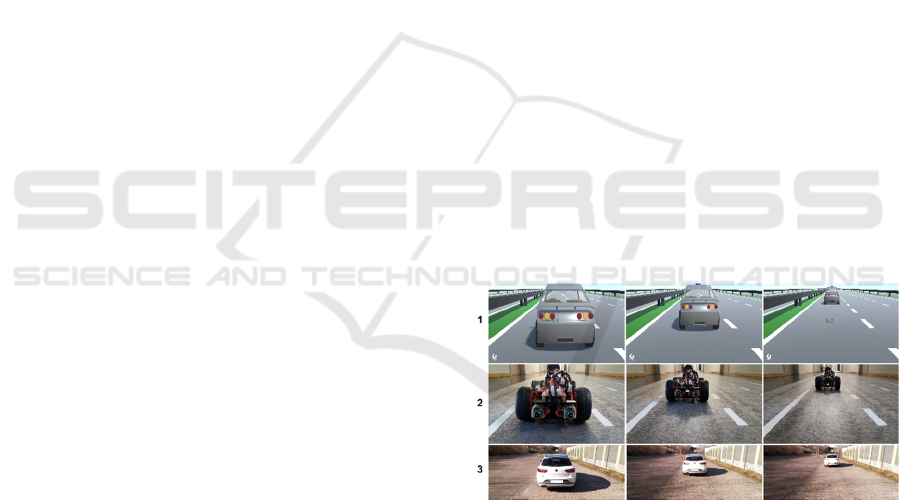
with 24 pictures. Figure 1 shows some images from
our data sets. The resolution of data sets 1 and 2 is
1280 × 720 pixels. In figure 1, third row can also be
seen that the images are smaller in height. The
resolution of data set 3 is 1280 × 500 pixels. The
engine hood of our real vehicle was cut out from these
pictures, so the pictures were reduced in height.
Figure 1: Our data sets for distance measurement. First row:
Data set 1 from simulator with simulation car. Second row:
Data set 2 from model making area with model car (PiCar).
Third row: Data set 3 from real environment with real
vehicle.
Here, this resolution is completely sufficient. In the
next step the pictures of our data sets will be resized
to the resolution of 320 × 160 pixels. This will be
discussed in section 4. Table 1 shows the data sets we
have created for our distance measurement including
the description and unit scale. For each picture there
is a corresponding distance (unit scale), which is
relevant for the later distance conversion.
Real-time Distance Measurement in a 2D Image on Hardware with Limited Resources for Low-power IoT Devices (Radar Control System)
95
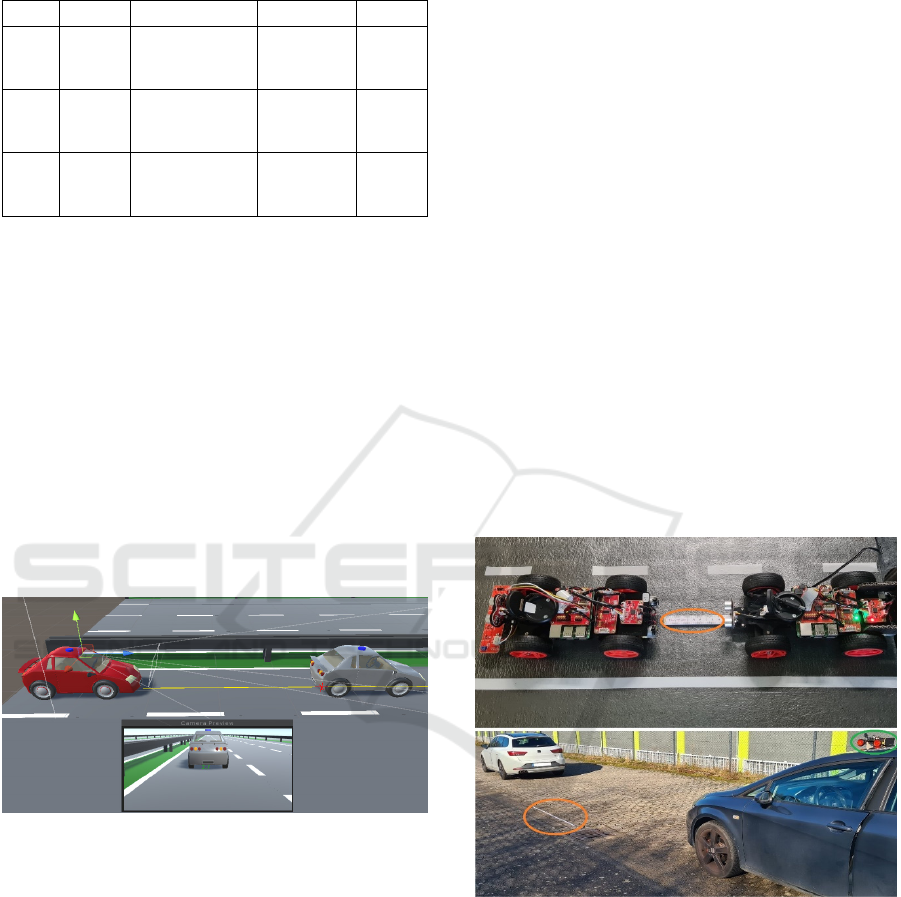
Table 1: Data sets for distance measurement. Count stands
for the number of records.
No. Name Description Unit scale Count
1 Sim
Distances
from Unity
3D simulator
Unity unit 795
2 Mod
Distances
from model
making area
Meter 30
3 Real
Distances
from real
environment
Meter 24
3.1 Automatic Annotation
One of the advantages of working in the simulated
environment is the rapid generation of automatically
annotated data (Kuzmic and Rudolph A2, 2021).
Through rapid prototyping, meaningful results can be
generated quickly without an elaborate experimental
setup in the real environment. To obtain the
automatically annotated simulation data for the
distance measurement, our previously published
simulator applied to accident simulations and
emergency corridor building on motorways was used
(Kuzmic and Rudolph, 2020). The corresponding
distance (unit scale in table 1) to the simulation car in
front was measured with virtual ray casts (Fig. 2).
Figure 2: Automatic data acquisition and annotation with
the Unity 3D simulator. Yellow line demonstrates the ray
cast for the distance measurement (no. 1 in table 1).
Ray casts can be imagined as a line in a certain
direction with a certain length. This ray is shown as a
yellow line between the red and grey simulation car
in figure 2. So, the distance between both objects can
be determined. The distance is given in Unity units
(no. 1 in table 1). Thus, an image with the
corresponding distance could be automatically
generated and saved. The different objects can also be
exchanged without much effort. Consequently, the
data set from the simulation can be extended as
desired and automatically annotated. This is an
additional advantage of the simulated environment.
3.2 Manual Annotation
To generate the data set from the model making area
for a model car, a small test track was set up with two
model cars (Fig. 3, top). Each of these model cars
have a camera installed in front. This makes it
possible to get pictures at a certain distance from the
model car in front of it. These model cars were placed
at certain distances from each other. First, the
distance to the front model car was measured with a
tape measure (Fig. 3, top, orange circle). Then the
model car behind was used to take a picture from the
model car in front manually. Therefore, a 2D input
image with a corresponding distance as annotation
(no. 2 in table 1) can be obtained. A similar procedure
was realised with the real vehicles from the real
environment (no. 3 in table 1). These pictures were
also taken with the model car, which was on the roof
of the real vehicle (Fig. 3, bottom, green circle). This
model car was also aligned parallel to the road. The
distance measurement was also carried out with a tape
measure (Fig. 3, bottom, orange circle). An
alternative could be a dashcam on the windscreen of
the real vehicle. This could also provide necessary
pictures.
Figure 3: Manual data acquisition and annotation. Top:
Distance measurements with model cars. Bottom: Distance
measurements with real vehicles.
4 DISTANCE MEASUREMENT
After the data acquisition, the distance measurement
in a 2D image with simulation, model making and
real environment data could be started. Our approach
is to realise the distance measurements without a
reference object. Thereby, the real size of an object in
DeLTA 2022 - 3rd International Conference on Deep Learning Theory and Applications
96
the same image is not needed. Here, our approach is
to approximate a mathematical function to converting
the measured pixels to the real distance. We have
considered two approaches for the distance
measurement with a bird's eye view transformation
and without a bird's eye view transformation for the
simulation data, data from the model making area and
data from the real world. This transformation yields a
view of the lane from the top (Venkatesh and
Vijayakumar, 2012). The pixel measurements for the
distance start at the bottom of the image in each case.
Additionally, the input image was resized to a
resolution of 320 × 160 pixels. This resolution has
already been used in our real-time lane detection with
the filtered Canny edge detection algorithm (Kuzmic
and Rudolph A1, 2021). For this reason, we use this
resolution for distance measurement. Thus, the
distance of the vehicles on the same lane can be
measured in the next step.
Some preliminary experiments show: The
conversion of the pixels to the actual distance
depends on the resolution of the input image, the
inclination of the camera and the height of the camera
from the road. If these match, these approximated
functions can be used. So, the autonomous vehicle
can be calibrated once in the factory before delivery.
The pixel calculation is done as a Euclidean distance
(Malkauthekar, 2013) in pixels to the vehicle in front
in a 2D image. Here, a linear distance measurement
to the object in front was carried out. If the road is
curved, the linear distance measurement can be
performed, too. The distance measurement is carried
out up to the bottom line of the detected object using
our real-time object detection for hardware with
limited resources for low-power IoT devices (Kuzmic
and Rudolph, 2022). Thus, the bounding box of the
object did not have to be defined manually.
The source (src) and destination (dst) parameters
required for the bird's eye view transformation to
generate the transformation matrix were found by
trial and error. We add them for completeness for the
320 × 160 pixel images:
src = [[0, 0], [320, 0], [320, 135], [0 , 135]]
dst = [[0, 0], [320, 0], [176, 135], [144, 135]]
For the real environment data with real vehicles, the
destination changes to:
dst = [[0, 0], [320, 0], [163.2, 135], [156.8, 135]]
4.1 Simulation
The distance measurement was performed on the
simulation data to check whether an optical distance
measurement without a reference object is possible at
all. As already mentioned, a real-time object detection
is the condition for a real-time distance measurement.
To measure the distance in pixels in a 2D image, the
position of the object in pixels have to be known in
this 2D image. First, we started with the bird's eye
view transformation (Venkatesh and Vijayakumar,
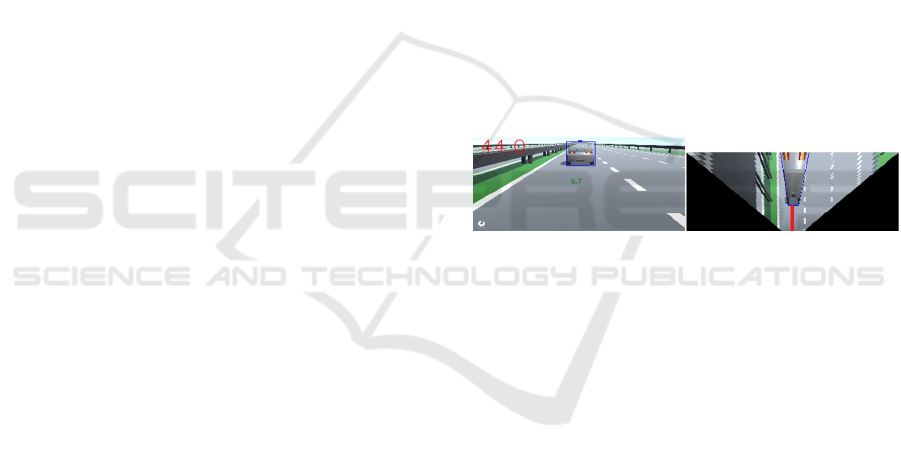
2012). Figure 4 (left) shows the input image with
object detection and distance measurement for the
simulation data set. Figure 4 (right) represents the
bird's eye view transformation for the simulation data
set. The red line shows the Euclidean distance to the
detected object in pixels (Fig. 4, right). The converted
input image into the bird's eye view is smaller in
height. This is a result of the transformation. The
position of the object can also be converted with the
generated transformation matrix from the bird's eye
view transformation. The object detection is done on
the original input image. Therefore, the conversion of
the both bottom coordinates of the bounding box into
the bird's eye view is sufficient. Figure 4 shows the
conversion of all pixels of the input image including
the position of the object into the bird's eye view. The
conversion of all pixels is only for a better
representation and is excluded from the run time
measurements in section 5.2.
Figure 4: Bird’s eye view transformation for simulation
data. Left: Input image with object detection and measured
distance in pixels. Right: Transformed bird’s eye view.
After the successful calculation of the Euclidean
distance in pixels, a mathematical linear function can
be approximated. This linear function (Fig. 5, green
graph) is used to convert the calculated Euclidean
distance into the actual real distance. In simulation
data the measured value is Unity unit. The points in
blue show the real measured distances from data set
1. Figure 5 shows this approximated mathematical
linear function for the data set from the simulation.
Here, the total measured distance in the simulated
environment is 8.5 Unity units. Figure 6 shows the
Euclidian distance in pixels in a 2D input image
without the transformation into the bird's eye view.
As can be seen, the approximated mathematical
function is a part of a polynomial graph of degree 6.
With increasing distance in Unity unit, there are fewer
pixels for distance measurement. This means some of
the pixels are the same for different distances. For this
reason, we only continue with the bird's eye view
transformation approach for distance measurement.
The mathematical linear function (Fig. 5) is easier to
Real-time Distance Measurement in a 2D Image on Hardware with Limited Resources for Low-power IoT Devices (Radar Control System)
97
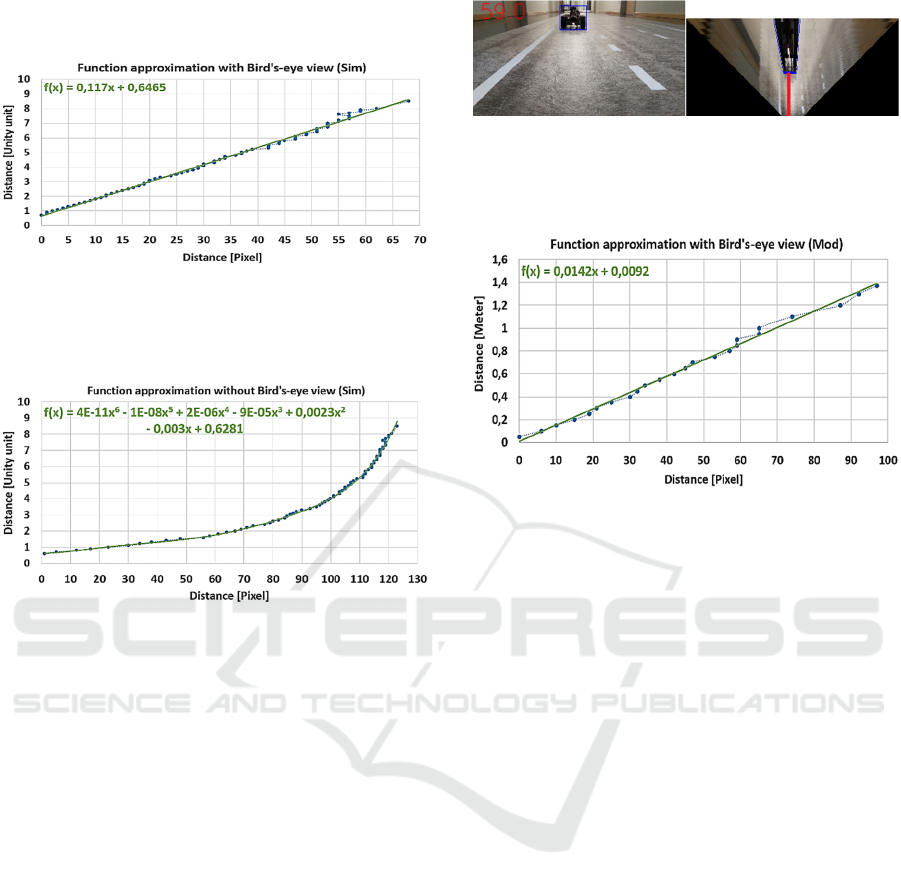
approximate than the polynomial graph of degree 6
(Fig. 6).
Figure 5: Function approximation with bird’s eye view in a
320 × 160 pixel image for simulation data. Green line:
Graph of an approximated linear function. Blue points: Real
measured distances from data set 1 (Sim).
Figure 6: Function approximation without bird’s eye view
in a 320 × 160 pixel image for simulation data. Green line:
Graph of an approximated polynomial function of degree 6.
Blue points: Real measured distances from data set 1 (Sim).
4.2 Model Making Area
Similar to the data from the simulation, the distance
measurement was also conducted for data set 2 (Mod)
from the model making area. The procedure for the
distance measurement with bird’s eye view
transformation is the same. First, the position of the
front object in the 2D input image have to be known.
Then the input image can be transformed into the
bird's eye view. With the transformation matrix
generated from the bird's eye view, the position of the
object can be converted. Figure 7 (right) shows the
bird's eye view transformation for data set 2 (Mod).
The red line represents the Euclidean distance to the
detected object in pixels. Figure 7 (left) shows the
input image including object detection and distance
measurement for data from model making area. Here,
the total measured distance in the model making area
is 1.37 metres. Here, a mathematical linear function
can be successfully approximated (Fig. 8, green line)
as well. This function can be used to convert the
pixels into the actual distance, in metres.
Figure 7: Bird’s eye view transformation for data from
model making area. Left: Input image with object detection
and measured distance in pixels. Right: Transformed bird’s
eye view.
Figure 8: Function approximation with bird’s eye view in a
320 × 160 pixel image for model making data. Green line:
Graph of an approximated linear function. Blue points: Real
measured distances from data set 2 (Mod).
4.3 Real Environment
After successfully distance measurement for the data
from the simulation and the model making area, the
data set 3 (Real) from the real environment with real
vehicles was investigated. In our development, we
focused on the simulation and model making area.
However, it is also interesting to investigate distance
measurement with real vehicles. Figure 9 illustrates
this distance measurement in use for data set 3 (Real).
Figure 9 (left) shows the input image including object
detection and distance measurement for data from the
real environment with real vehicles. Figure 9 (right)
represents the transformed bird’s eye view image
from the real environment. The source (src) and
destination (dst) parameters required for the bird's eye
view transformation were found by trial and error and
are included for completeness for the 320 × 160 pixel
images:
src = [[0, 0], [320, 0], [320, 135], [0 , 135]]
dst = [[0, 0], [320, 0], [163.2, 135], [156.8, 135]]
Figure 10 depicts the approximated mathematical
linear function for converting pixels to the actual
distance (green line). The distance output is given in
metres in this scenario. Here, the total measured
distance in the real environment is 60 metres.
DeLTA 2022 - 3rd International Conference on Deep Learning Theory and Applications
98
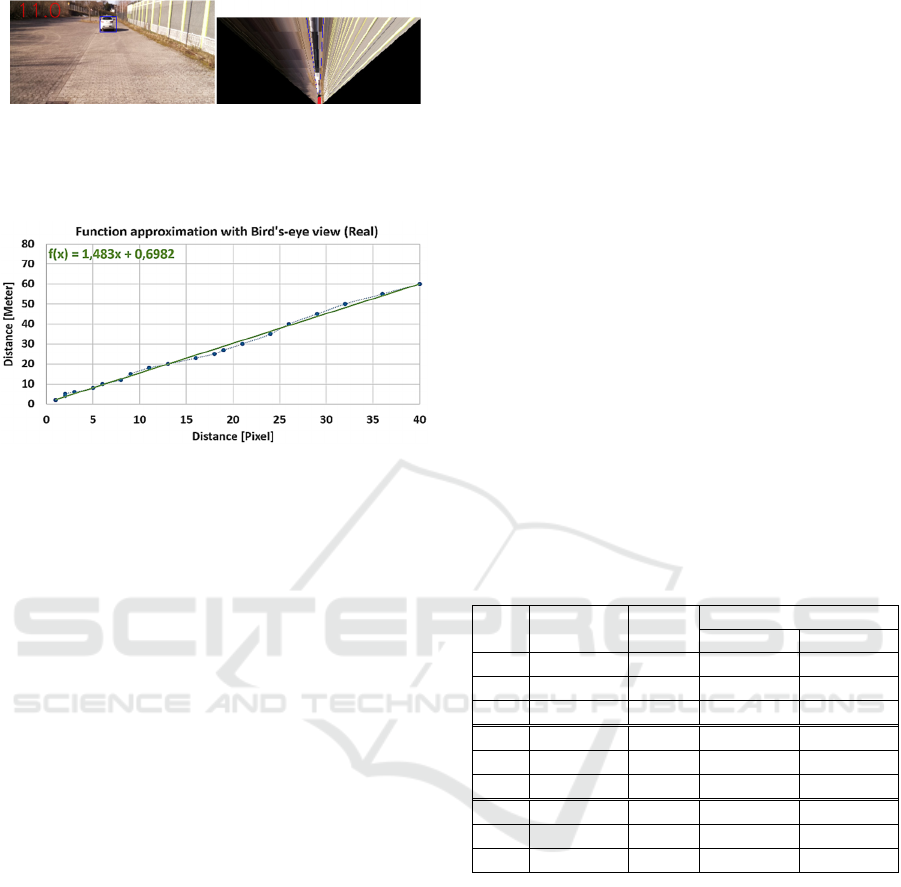
Figure 9: Bird’s eye view transformation for data from real
environment. Left: Input image with object detection and
measured distance in pixels. Right: Transformed bird’s eye
view.
Figure 10: Function approximation with bird’s eye view in
a 320 × 160 pixel image for real environment data. Green
line: Graph of an approximated linear function. Blue points:
Real measured distances from data set 3 (Real).
5 EXPERIMENTS
The following experiments were carried out to
compare the measurement error and the run time of
the different resolution and different IoT hardware.
The resolution is in the format width × height. All
experiments were carried out on the same hardware
and input images. For hardware with limited
resources, a single-board Raspberry Pi 3 B and
Raspberry Pi 4 B were used. The run time of distance
measurement is shown in milliseconds (ms). These
measurements contain only the time for distance
measurement and do not include the time for loading
the input images, the time for lane or object detection.
Our hardware for the experiments:
Raspberry Pi 3 B with ARM Cortex-A53 1.2
GHz CPU, 1 GB RAM, USB 2.0, 8 GB SD as
hardware with limited resources.
Raspberry Pi 4 B with ARM Cortex-A72 1.5
GHz CPU, 8 GB RAM, USB 3.0, 16 GB SD as
hardware with limited resources.
5.1 Different Resolution and Accuracy
In these experiments, different resolutions for the
input images in the distance measurement are
investigated. To check the quality of the optical radar
control system and the distance measurement for
different resolutions, the mean absolute error (MAE)
for the measurement error was calculated (Willmott
and Matsuura, 2005). The measurement error is given
in metres (m). Here, it was assumed that the unit scale
from the simulation (Unity unit) is equal to the unit
scale from the real environment (meter).
Additionally, the MAE value was converted to
percentage of the total distance (MAE in %). Through
this percentage conversion, the MAE of 0.02 from
exp. no. 6 in table 2 is comparable with MAE of 0.88
from exp. no. 9 in table 2. Data set 1 (Sim) provides
the total distance of 8.5 Unity units. Data set 2 (Mod)
has a total distance of 1.37 metres. Data set 3 (Real)
provides a total distance of 60 metres. The measured
values are rounded to two decimal places.
The results in table 2 show: With greater
resolution in height, there are more pixels for distance
measurement. So, there are fewer duplicate pixels for
different actual distances. For this reason, the mean
absolute error (MAE) is smaller with greater
resolution in height (comparison between exp. no. 1
to 3 and 7 to 9 in table 2).
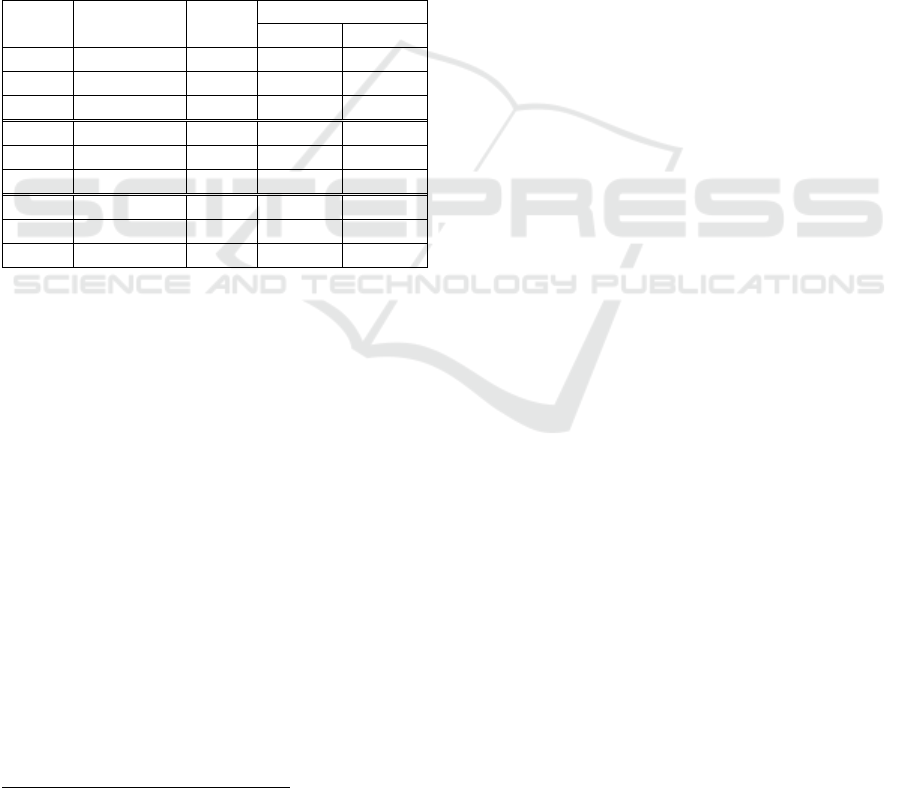
Table 2: Resolution and measurement error overview of
distance measurement. First column contains the number
(ID) of the experiment (Exp. No.).
Exp.
No.
Resolution
Data
Set
Measurement Error
MAE [m] MAE [%]
1
320
×
160
Sim 0.09 1.06
2
320
×
320
Sim 0.09 1.06
3
320
×
640
Sim 0.08 0.94
4
320
×
160
Mod 0.02 1.46
5
320
×
320
Mod 0.02 1.46
6
320
×
640
Mod 0.02 1.46
7
320
×
160
Real 0.97 1.62
8
320
×
320
Real 0.89 1.48
9
320
×
640
Real 0.88 1.47
5.2 Different Resolution and Run Time
To find a suitable approach for distance measurement
on hardware with limited resources, the run time
should be considered in relation to the measurement
error. These run time measurements were performed
on low-power IoT devices (Raspberry Pi 3 B and 4
B). Small preliminary experiments show: The
duration of the calculation of the Euclidean distance
do not depends on the actual distance of the object in
the input image. Thus, the object was hard coded at
the upper edge of the input image. So, the Euclidean
distance was kept the same for all data sets to compare
the results afterwards. The average run time on
different hardware was calculated from the respective
Real-time Distance Measurement in a 2D Image on Hardware with Limited Resources for Low-power IoT Devices (Radar Control System)
99
data set. These run time measurements only include
the conversion of both bottom coordinates of the
object into the bird's eye view, calculation of the
Euclidean distance to the object and the conversion of
the Euclidean distance to the actual distance. For this
purpose, the approximated linear functions already
presented in section 4 are used. The run time
measurements do not include the transformation of
the input image into the bird's eye view as this
transformation is not required for the distance
measurement. The following table 3 summarizes the
resolution and the run time of the distance
measurement.
Table 3: Resolution and run time overview of distance
measurement on Raspberry Pi 3 B and Raspberry Pi 4 B.
First column contains the number (ID) of the experiment
(Exp. No.)
1
.
Exp.
No.
Resolution
Data
Set
Run time [ms]
RPI 3 B RPI 4 B
1
320
× 160
Sim 0.7 0.4
2
320
× 320
Sim 0.7 0.4
3
320
× 640
Sim 0.7 0.4
4
320
× 160
Mod 0.7 0.4
5
320
× 320
Mod 0.7 0.4
6
320
× 640
Mod 0.7 0.4
7
320
× 160
Real 0.7 0.4
8
320
× 320
Real 0.7 0.4
9
320
× 640
Real 0.7 0.4
5.3 Evaluation of Run Time and
Accuracy
After the experiments and the performance tests have
been completed, the evaluation of the run times and
the measurement errors can be started. Therefore, it is
important to find a balance between sufficient
accuracy and the run time to find a suitable optical
control system for the radar sensor. The distance
measurement has been successfully investigated and
can be applied on the simulation data, on the data
from model making area and on the data from real
environment for real autonomous vehicles. Here, the
measurement error (MAE in %) varies between 0.94
and 1.62 % (exp. no. 1 to 9 in table 2). This error is
completely sufficient for our purpose. Evidently, if
the resolution increases, the run time of the distance
measurement does not increase, because the pixels of
the input image are not transformed into the bird's eye
view (see e.g. exp. no. 7 and 9 in table 3).
1
The reviews helped to improve the run time of the
distance measurement.
Additionally, the Raspberry Pi 3 B is slower in
distance measurement than the Raspberry Pi 4 B (exp.
no. 1 in table 3). This is caused by the less powerful
hardware. Next, we consider the distance
measurement with the input images from data set 2
(Mod) with resolution of 320 × 160 pixels on the
Raspberry Pi 4 B. This requires about 0.4 ms for the
distance measurement (exp. no. 4 in table 3). The
error in this optical distance measurement is approx.
1.46 % (exp. no. 4 in table 2). So, a deviation of
approx. 15 cm at 10 m is given. At this point, the
variance of the distance measurement also depends on
the accuracy of the object detection system. More
accurate object detection, gives more accurate
distance measurement to this object. Here, the
position of the bottom line of the object is very
important. Since, the Euclidean distance is measured
exactly up to this line.
On condition that our real-time object detection
for hardware with limited resources for low-power
IoT devices with about 30 frames per second (FPS) is
used (Kuzmic and Rudolph, 2022), the actual run
time for distance measurement can be calculated
depending on this object detection. Each frame is
slowed down by approximately 0.4 ms on a
Raspberry Pi 4 B and about 0.7 ms on a Raspberry Pi
3 B. This reduces the actual frame rate to roughly 29
FPS. So, all our approaches achieve a real-time
distance measurement on our hardware with limited
resources.
6 CONCLUSIONS
This section summarizes once again the points that
were introduced in this paper. In our research, we
focused on real-time distance measurement to
develop an optical radar control system with a single
camera. The usage on hardware with limited
resources for low-power IoT devices was our first
priority. For this purpose, we also created our own
data sets from the simulation, from the model making
area and also from the real environment with a real
vehicle to assess the quality of the sim-to-real
transfer. In addition, several different resolutions and
approximated mathematical linear functions were
analysed to find a balance between sufficient
accuracy and the run time of the distance
measurement. The distance measurement requires
about 0.4 milliseconds with a 1.46 % error for the data
set from the model making area. In our development,
DeLTA 2022 - 3rd International Conference on Deep Learning Theory and Applications
100

we focus on the simulation and model making area.
The approach with real vehicles should show that the
distance measurement is also suitable for the real
world use. At this point, if this distance measurement
is applied to real autonomous vehicles we recommend
to obtain even more data and conducting more
experiments. In conclusion, based on our experiments
the distance measurement without a reference object
conducts successfully in simulation, in model making
and in the real environment. Consequently, an optical
real-time control system for the radar sensor could be
successfully developed. This real-time radar control
system achieves an effective balance between
accuracy and run time.
7 FUTURE WORK
As already announced, the goal of our future work is
to successfully conduct a sim-to-real transfer,
including our real-time lane detection, real-time
object detection and real-time distance measurement
(optical radar control system) we have developed for
the model making area. This means the simulated
environment is completely applied to a real model
vehicle. In this approach, we focus on developing
software for hardware with limited resources for low-
power IoT devices. Additionally, we want to set up a
model test track like a real motorway for this
experiment. Another important aspect on the
motorways is the creation of an emergency corridor
for the rescue vehicles in the case of an accident.
Thus, the behaviour of the vehicles in the simulation
can be compared with the behaviour of the model
vehicles in reality. It is also conceivable to extend this
real-time distance measurement system by a distance
measurement to the detected objects outside the lane.
Therefore, it is possible to track the course of
different objects outside the lane, too. This can be
used, for example, to extend the functionality of the
radar sensor in self-driving cars.
REFERENCES
Huang, R., Pedoeem, J., Chen, C., 2018. YOLO-LITE: A
Real-Time Object Detection Algorithm Optimized for
Non-GPU Computers. IEEE International Conference on
Big Data (IEEE Big Data 2018), ISBN 978-1-5386-
5036-3.
Jin, Y., Wen, Y., Liang, J., 2020. Embedded Real-Time
Pedestrian Detection System Using YOLO Optimized by
LNN. International Conference on Electrical,
Communication, and Computer Engineering (ICECCE),
ISBN 978-1-7281-7117-3.
Jose, G., Kumar, A., Kruthiventi, S., Saha, S., Muralidhara,
H., 2019. Real-Time Object Detection On Low Power
Embedded Platforms. IEEE/CVF International
Conference on Computer Vision Workshop (ICCVW),
ISBN: 978-1-7281-5024-6.
Kuzmic, J., Rudolph, G., 2020. Unity 3D Simulator of
Autonomous Motorway Traffic Applied to Emergency
Corridor Building. In Proceedings of the 5th
International Conference on Internet of Things, Big Data
and Security, ISBN 978-989-758-426-8, pp. 197-204.
Kuzmic, J., Rudolph, G., A1, 2021. Comparison between
Filtered Canny Edge Detector and Convolutional Neural
Network for Real Time Lane Detection in a Unity 3D
Simulator. In Proceedings of the 6th International
Conference on Internet of Things, Big Data and Security
(IoTBDS), ISBN 978-989-758-504-3, pp. 148-155.
Kuzmic, J., Rudolph, G., A2, 2021. Object Detection with
TensorFlow on Hardware with Limited Resources for
Low-Power IoT Devices. 13th International Conference
on Neural Computation Theory and Applications
(NCTA), ISBN 978-989-758-534-0, pp. 302-309.
Kuzmic, J., Rudolph, G., 2022. Real-time Object Detection
with Intel NCS2 on Hardware with Limited Resources for
Low-power IoT Devices. In Proceedings of the 7th
International Conference on Internet of Things, Big Data
and Security (IoTBDS).
Mahammed, M., A., Melhum, A., I., Kochery, F., A., 2013.
Object Distance Measurement by Stereo VISION.
International Journal of Science and Applied Information
Technology (IJSAIT), ISSN: 2278-3083, Volume 2,
Issue 2, pp. 5-8.
Malkauthekar, M. D., 2013. Analysis of euclidean distance
and Manhattan Distance measure in face recognition.
3rd International Conference on Computational
Intelligence and Information Technology (CIIT 2013),
ISBN: 978-1-84919-859-2.
Marutotamtama, J., C., Setyawan, I., 2021. Physical
Distancing Detection using YOLO v3 and Bird's Eye
View Transform. 2nd International Conference on
Innovative and Creative Information Technology
(ICITech), ISBN: 978-1-7281-9748-7.
Rahman, K., A., Hossain, M., S., Bhuiyan, M., A.-A., Zang,
T., Hasanuzzaman M., Ueno, H., 2009. Person to
Camera Distance Measurement Based on Eye-Distance.
3rd International Conference on Multimedia and
Ubiquitous Engineering (MUE 2009), ISBN: 978-0-
7695-3658-3, pp. 137-141.
Venkatesh, M., Vijayakumar, P., 2012. A Simple Bird’s Eye
View Transformation Technique. International Journal of
Scientific & Engineering Research, ISSN: 2229-5518,
Volume 3, Issue 5.
Wang, R. J., Li, X., Ling, C. X., 2018. Pelee: A Real-Time
Object Detection System on Mobile Devices. 32nd
Conference on Neural Information Processing Systems
(NeurIPS).
Willmott, C., J., Matsuura, K., 2005. Advantages of the mean
absolute error (MAE) over the root mean square error
(RMSE) in assessing average model performance. Inter-
Research Science Publisher, ISSN: 0936-577X, Volume
30, Issue 1, pp. 79-82.
Real-time Distance Measurement in a 2D Image on Hardware with Limited Resources for Low-power IoT Devices (Radar Control System)
101
