
Study on Crop Meteorological Index and Change Threshold in
Yellow River Sanyizhai Irrigated Area
Feng Feng
1,2 a
, Mengzhen Wang
3b
, Yuehua Feng
4c
, Xiaoying Jin
1,2 d
, Ting
Zhao
1,2 e
and Nan Jiang
1,2 f
1
Yellow River Conservancy Technical Institute, Kaifeng, 475004, China
2
Henan Engineering Technology Center for Water Resources Conservation and Utilization in the Middle and Lower
Reaches of Yellow River, Kaifeng, 475004, China
3
Eastern Henan Water Conservancy Administration Bureau, Sanyizhai Branch Office, Kaifeng, 475300, China
4
Eastern Henan Water Conservancy Administration Bureau, Kaifeng, 475002, China
Keywords: Yellow River Irrigation Area, Meteorological Factor, Change Index, Change Threshold, Sanyizhai Irrigation
Area.
Abstract: Based on 756 sets of ten-day meteorological data from 1999 to 2019 in Sanyizhai Irrigation Area, the
dynamic threshold of irrigation water demand was studied in order to determine the irrigation water demand
in the Yellow River Irrigation Area under the condition of meteorological change. According to the path
analysis of crop water requirement of winter wheat, cotton and summer corn, the most significant
meteorological factors were selected to construct the meteorological indexes of winter wheat, cotton and
summer corn, respectively, and four variation rates of slight, weak, strong and extremely strong were
determined. Analysis the growth period of winter wheat all 486 groups of observed meteorological data,
strong changes occur most frequently, middle and late time is January, strong change is 2 months early and
in late December, in late march to late may meteorological index change is given priority to with slight
change and the weak, the weak change based on the analysis of time frequency of the highest (40.79%),
strong change frequency of the lowest 13.87%.The maximum frequency of extreme changes in summer
corn was in the middle of July, late July and early August, with the highest frequency of extreme changes
accounting for 28.57% and the lowest frequency of strong changes accounting for 14.70%.The maximum
frequency of strong changes in cotton was in the middle of July, late July and early August, with the highest
frequency of small changes accounting for 34.01% and the lowest frequency of strong changes accounting
for 15.65%.
1 INTRODUCTION
a
In the major national strategy of Ecological
protection and High-quality Development of the
Yellow River Basin, it is clearly pointed out that the
economical and intensive utilization of water
resources should be promoted (Xinhua, 2019).
Henan province is a major agricultural and grain
production province in China. In 2020, the sown
area of grain in Henan province is 10 738 794 hm2,
a
https://orcid.org/0000-0002-1192-1775
b
https://orcid.org/0000-0003-2762-5417
c
https://orcid.org/0000-0001-9145-7126
d
https://orcid.org/0000-0002-8586-6596
e
https://orcid.org/0000-0002-5952-8913
f
https://orcid.org/0000-0002-5416-0232
of which winter wheat and summer corn account for
more than 85% (Central Committee of the
Communist Party of China and State Council, 2018).
However, Henan Province is also one of the regions
with severe water shortage in China. The Yellow
River Irrigation area mainly uses agricultural water,
and in the face of complex and changeable
meteorological conditions, an important premise for
water conservation and intensive utilization is to
predict the water demand of the irrigated area
according to meteorological changes, so as to carry
out accurate water scheduling and optimal allocation
(CUI 1994).
At present, a lot of research achievements have
been made in terms of water requirement for crop
irrigation (CAI 2008, WEI 2014, WU 2008).
However, for the main crops in the irrigated areas of
The Yellow River in Henan Province, the research
Feng, F., Wang, M., Feng, Y., Jin, X., Zhao, T. and Jiang, N.
Study on Crop Meteorological Index and Change Threshold in Yellow River Sanyizhai Irrigated Area.
DOI: 10.5220/0011179100003443
In Proceedings of the 4th International Conference on Biomedical Engineering and Bioinformatics (ICBEB 2022), pages 41-47
ISBN: 978-989-758-595-1
Copyright
c
2022 by SCITEPRESS – Science and Technology Publications, Lda. All rights reserved
41
on the threshold of irrigation water demand from the
perspective of meteorological factors is still scarce.
This will bring adverse effects on the promotion and
implementation of the strictest water resources
management system and the scientific planning of
the development of the irrigation area. Based on the
meteorological data of Huibei Water Conservancy
Experimental Station from 1999 to 2019, the
dynamic threshold of crop water demand and
irrigation water demand of winter wheat, summer
corn and cotton in the whole growth period of
Sanyizhai Irrigated Area was predicted from the
perspective of the change range of meteorological
index. Thus the data foundation and technical
support are provided for the conservation and
intensive utilization of water resources and high-
quality development in Yellow River irrigation area.
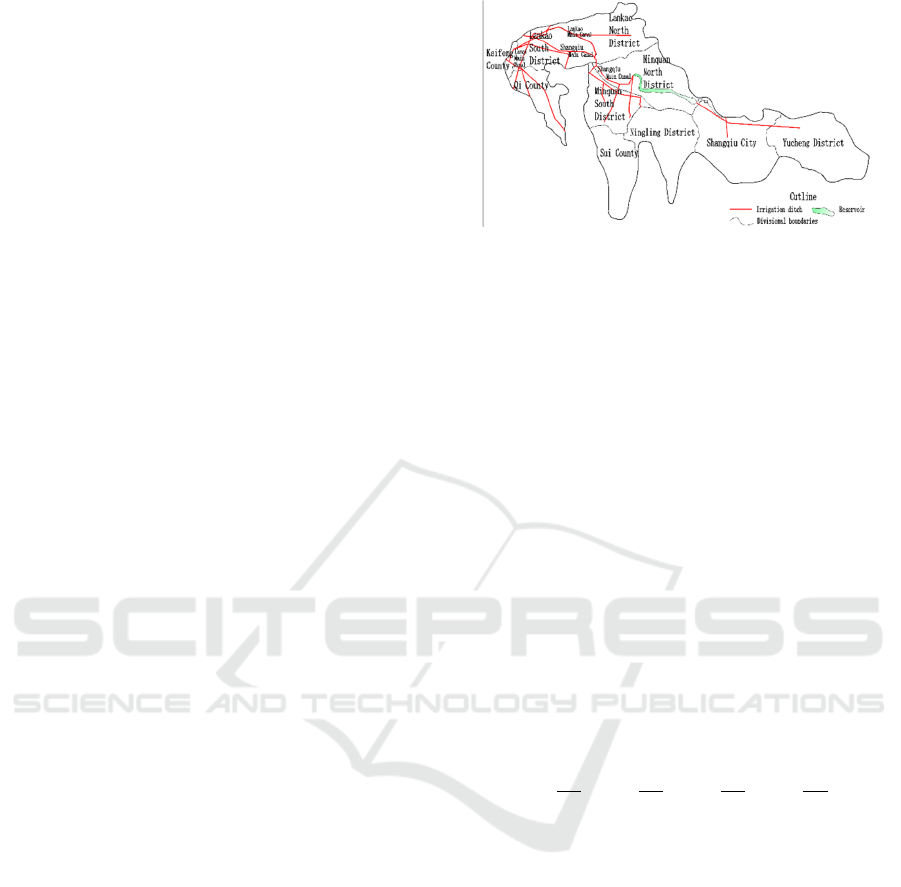
2 REGIONAL OVERVIEW AND
DATA SOURCES
The water intake of Yellow River Sanyizhai
Irrigation Area in Henan Province is located in
Lankao County, Kaifeng City. The total land area of
the irrigation area is 4 344.2 km2, and the total
arable land area is 270,000 hm2, as shown in Fig.1
(FENG 2019). At present, the water diversion
capacity of the irrigation area is about 150 m3/s, and
the effective irrigation areas are Kaifeng County,
Lankao County and Qi County in Kaifeng City, and
Minquan County, Ningling County, Suiyang
District, Liangyuan District, Sui County and
Yucheng County in Shangqiu City, involving a total
of 9 counties (districts) in the two regions (FENG
2017). Meteorological data adopted in this study
were all from Huibei science Experimental Station
of Eastern Henan Water Conservancy Engineering
Administration in Henan Province. The geographical
location of this station was 114º31 'E and 34º46' N,
representing the Yellow River Sanyizhai Irrigation
Area in Kaifeng City, Henan Province. The daily
and daily surface meteorological observation data of
this station from 1999 to 2019 were selected.
Including precipitation (X1), water surface
evaporation (X2), average temperature (X3),
maximum temperature (X4), minimum temperature
(X5), air relative humidity (X6), sunshine duration
(X7), maximum sunshine duration (X8), average
wind speed (X9) and nearly 100,000 data.
Figure 1: Map of Yellow River Sanyizhai Irrigation Area.
3 METEOROLOGICAL INDEX
AND CHANGE THRESHOLD
3.1 Winter Wheat Meteorological
Index and Its Change Threshold
According to the previous research results, the
regression equation of winter wheat with 9
meteorological factors can predict crop water
demand more accurately. Based on 756 sets of 10-
day meteorological data from 1999 to 2019, through
path analysis of winter wheat crop water demand in
Yellow River Sanyizhai Irrigation Area, it can be
seen that the four meteorological factors with the
greatest influence are: Ten-day average temperature
(X3), ten-day maximum temperature (X4), ten-day
sunshine hours (X7), ten-day average wind speed
(X9). Therefore, the above four factors are selected
as representative factors, and the winter wheat
meteorological index is calculated as follows:
𝐹
0.25∗
̄
̄
0.25 ∗
̄
̄
0.25 ∗
̄
̄
0.25∗
̄
̄
∗ 100%
(1)
In the formula:𝐹
, winter wheat
meteorological index in Sanyizhai; X3 ,𝑥̄
are ten-
day average measured temperature, annual average,
℃; X4, 𝑥̄
are ten-day maximum temperature
measured, annual average, ℃; X7,𝑥̄
are measured
value of ten-day sunshine hours, annual average
value, h; X9, 𝑥̄
are ten-day average wind speed
measured annual average m/s.
According to the change multiples of maximum,
minimum and mean values of four meteorological
factors during 1999-2019, four ranges of slight
change, weak change, strong change and strong
change were determined. The threshold range of
slight change was -10% to 10%, weak change was -
30% to 30%, and strong change was -50% to 50%.
The threshold value of the change amplitude
developed by the time process is shown in Fig.2, and
the threshold range of different change amplitude is
shown in Table 1.
ICBEB 2022 - The International Conference on Biomedical Engineering and Bioinformatics
42
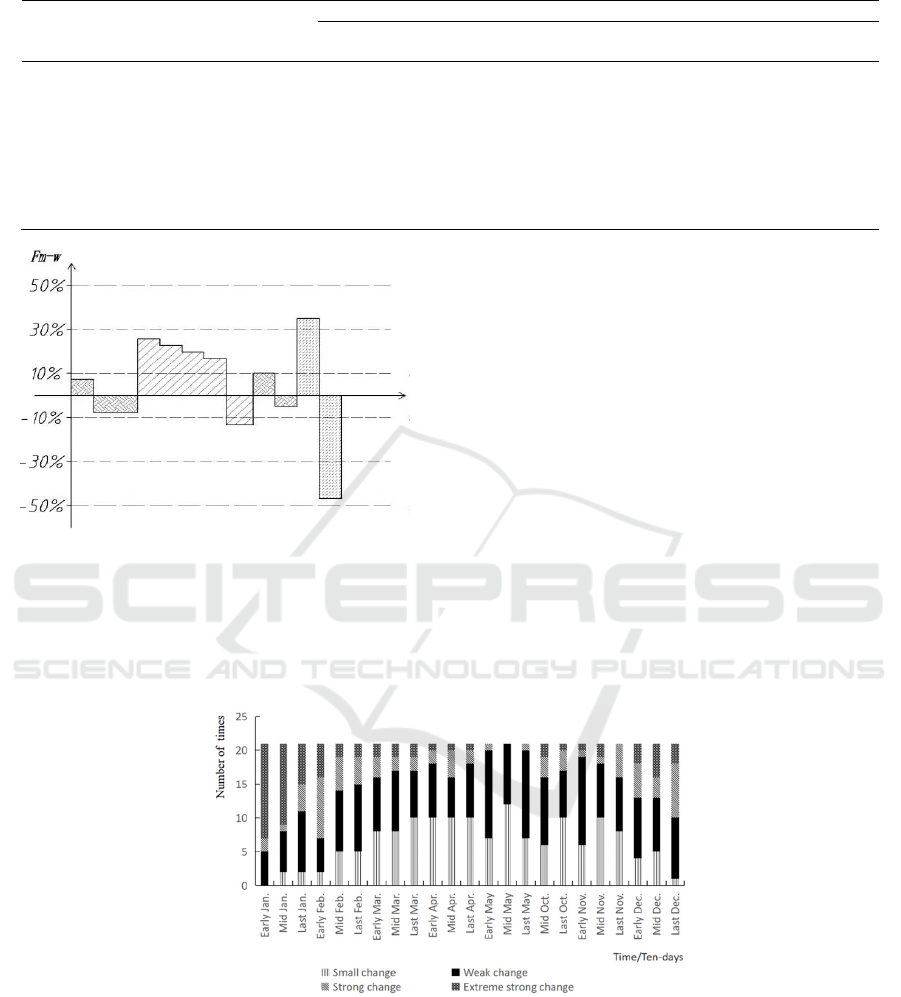
Table 1: Threshold range of change amplitude of winter wheat meteorological index in Sanyizhai Irrigation Area.
F
actor
Multiple
of minimum
change
Multiple
of maximum
change
Threshold range of the change amplitude
Small
change
Weak
change
Strong
change
Extreme stron
g change
X
3
-0.63 2.28 -10%~10% -30%~30% -50%~50%
<-
50%,>50%
X
4
-0.58 1.27 -10%~10% -30%~30% -50%~50%
<-
50%,>50%
X
7
-0.83 1.84 -10%~10% -30%~30% -50%~50%
<-
50%,>50%
X
9
-0.77 4.94 -10%~10% -30%~30% -50%~50%
<-
50%,>50%
Figure 2: Schematic diagram of the threshold value of
change amplitude of winter wheat meteorological index in
Sanyizhai Irrigation Area.
The whole growth period of winter wheat is 23
days from mid-October to late May of the next year.
Based on 756 sets of ten-day meteorological data in
21 years from 1999 to 2019, the winter wheat
meteorological index is calculated by using formula
(1), and the variation range of meteorological index
in each ten-day in 21 years is determined according
to the threshold range in Table 1. Count the
occurrence times of the four variation ranges, as
shown in Fig.3. It can be seen that the most frequent
strong changes of meteorological index occurred in
the first, middle and late January, the most frequent
strong changes occurred in the first ten days of
February and the last half of December, and the
change range of meteorological index from late
March to late May was dominated by slight changes
and weak changes. The frequency of the four
variation ranges of the meteorological index in 483
sets of data is shown in Fig. 4. It can be seen that the
highest frequency of weak variation is 40.79%, and
the lowest frequency of strong variation is 13.87%.
Figure 3: The frequency of different variation ranges of meteorological index during the whole growth period of winter
wheat in Sanyizhai Irrigation Area from 1999 to 2019.
Study on Crop Meteorological Index and Change Threshold in Yellow River Sanyizhai Irrigated Area
43
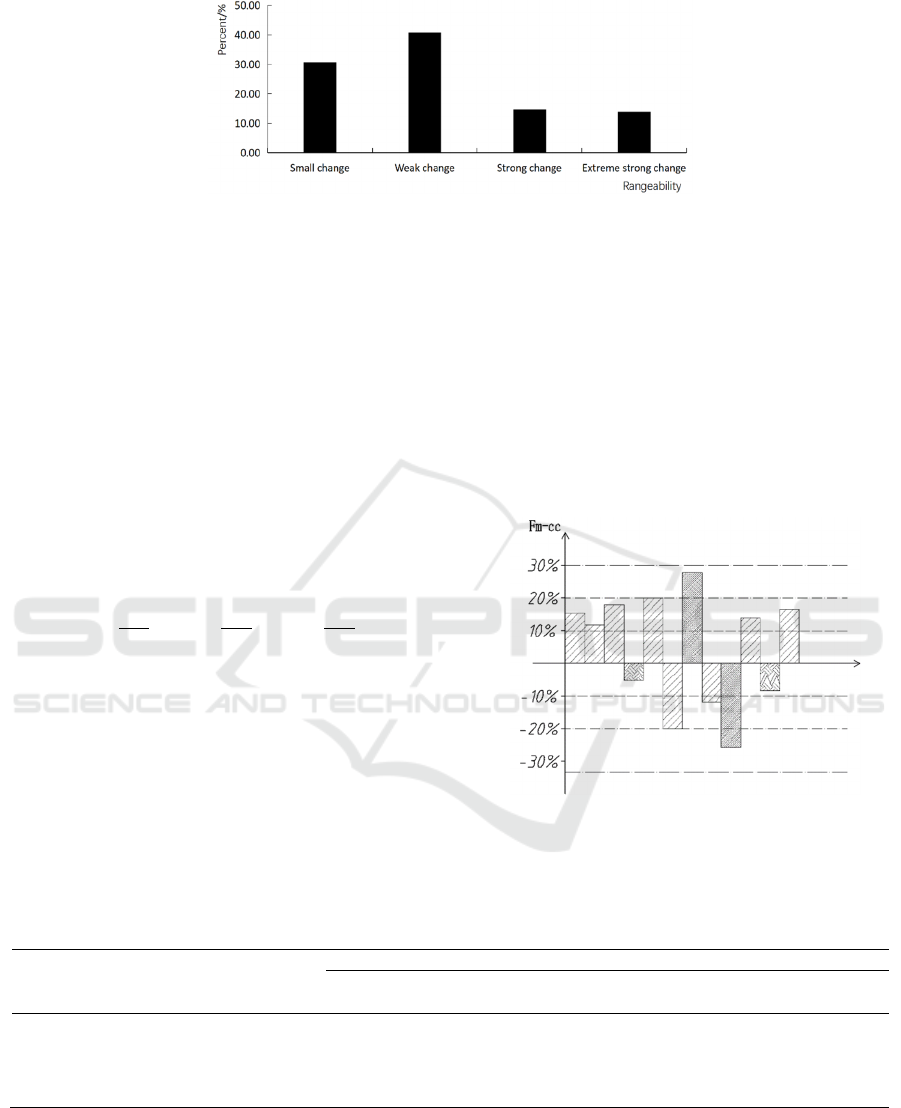
Figure 4: Percentage of different variation ranges of meteorological index in the whole growth period of winter wheat in
Sanyizhai Irrigation Area from 1999 to 2019
3.2 Meteorological Index and Variation
Range of Cotton and Summer Corn
According to the previous research results, through
path analysis of the water demand of cotton and
summer maize crops in Sanyizhai Irrigation Area, it
can be seen that the three most influential
meteorological factors are: ten-day water
evaporation (X2), ten-day air relative humidity (X6),
and the actual maximum sunshine hours per day
(X8). Therefore, the above factors are selected as
representative factors, and the calculation of the
meteorological index of cotton and summer corn is
as follows:
𝐹
0.33 ∗
̄
̄
0.33 ∗
̄
̄
0.34 ∗
̄
̄
∗ 100%
(2)
In the formula: 𝐹
,The meteorological change
index of cotton and summer corn; X2, 𝑥̄
are
measured value of water surface evaporation in ten
days, average value over many years, mm; X4,𝑥̄
are
ten-day air relative humidity measured value, annual
average,%; X7, 𝑥̄
are actual measured maximum
hours of sunshine per day, multi-year average, h.
According to the change multiples of the
maximum, minimum and average of the three
meteorological factors during 1999-2019, the change
ranges of four meteorological factors were
determined as slight change, weak change, strong
change and strong change. The threshold range of
the slight change of meteorological index was -10%
to 10%, the weak change was -20% to 20%, and the
strong change was -30% to 30%. The threshold
value of the change amplitude developed by the time
process is shown in Fig.5, and the threshold range of
different change amplitude is shown in Table 2.
Figure 5: Schematic diagram of thresholds of cotton and
summer corn meteorological change index in Sanyizhai
Irrigation Area.
Table 2: Threshold range of change amplitude of meteorological index of cotton and summer maize in Sanyizhai Irrigation
Area.
Factor
Multiple of
minimum
change
Multiple of
maximum
change
Threshold range of the change amplitude
Small change Weak change Strong change
Extreme strong
chan
g
e
X3 -0.79 1.66 -10%~10% -20%~20% -30%~30% <-30%, >30%
X4 -0.30 1.30 -10%~10% -20%~20% -30%~30% <-30%, >30%
X7 -0.84 1.84 -10%~10% -20%~20% -30%~30% <-30%, >30%
X9 -0.79 1.66 -10%~10% -20%~20% -30%~30% <-30%, >30%
3.2.1 Calculation of Summer Maize
Eteorological Index
The whole growth period of summer corn is 10 days
from mid-June to mid-September every year. Based
on 756 sets of ten-day meteorological data in 21
years from 1999 to 2019, the meteorological factors
of summer corn are calculated using formula (2),
and the change range of meteorological index of
each ten-day in 21 years is determined according to
ICBEB 2022 - The International Conference on Biomedical Engineering and Bioinformatics
44
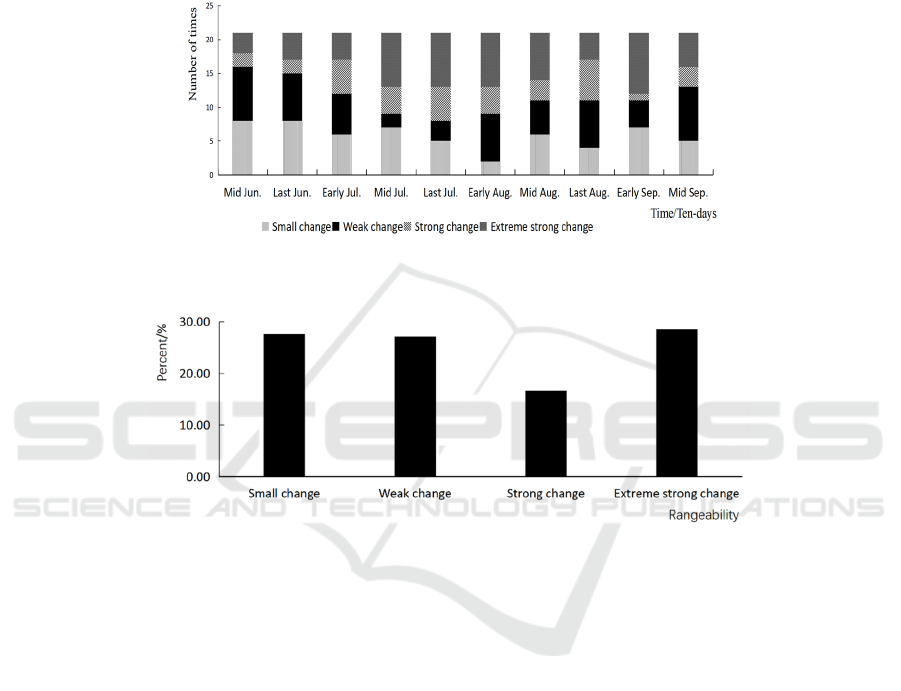
the threshold range in Table 2. The occurrence times
of the four variation ranges are statistically shown in
Fig.6. It can be seen that the most frequent strong
changes of meteorological index occurred in the
middle and late July and the first ten days of August,
the most frequent strong changes occurred in the
first ten days of July and the last ten days of August,
and the change range of meteorological index in the
middle and late June and the first and middle of
September was dominated by slight changes and
weak changes. The frequency of the four variation
ranges of the meteorological index in 210 sets of
data is shown in Fig.7. It can be seen that the highest
frequency of strong variation takes up 28.57%, and
the lowest frequency of strong variation takes up
14.70%.
Figure 6: The frequency of change of ten-day meteorological index in the whole growth period of summer maize in
Sanyizhai Irrigation Area from 1999 to 2019.
Figure 7: Percentage of change of meteorological index during the whole growth period of summer corn in Sanyizhai
Irrigation Area from 1999 to 2019.
3.2.2 Calculation of Cotton Meteorological
Index
The whole growth period of cotton is 21 days from
early April to late October every year. Based on 756
sets of ten-day meteorological data in 21 years from
1999 to 2019, the cotton meteorological factor is
calculated by Using formula (2), and the change
range of meteorological index in each ten-day in 21
years is determined according to the threshold range
in Table 2. The occurrence times of the four
variation ranges are statistically shown in Fig.8. It
can be seen that the most frequent occurrence of
strong changes of meteorological index is in the
middle and late July, early August and early
September, and the most frequent occurrence of
strong changes is in the early July, late August and
late October. In other periods, the change range of
meteorological index is dominated by slight changes
and weak changes. The frequency of the four change
ranges of the meteorological index in 441 sets of
data is shown in Fig.9. It can be seen that the highest
frequency of the slight change is 34.01%, the second
frequency of the weak change is 28.34, and the
lowest frequency of the strong change is 15.65%.
Study on Crop Meteorological Index and Change Threshold in Yellow River Sanyizhai Irrigated Area
45
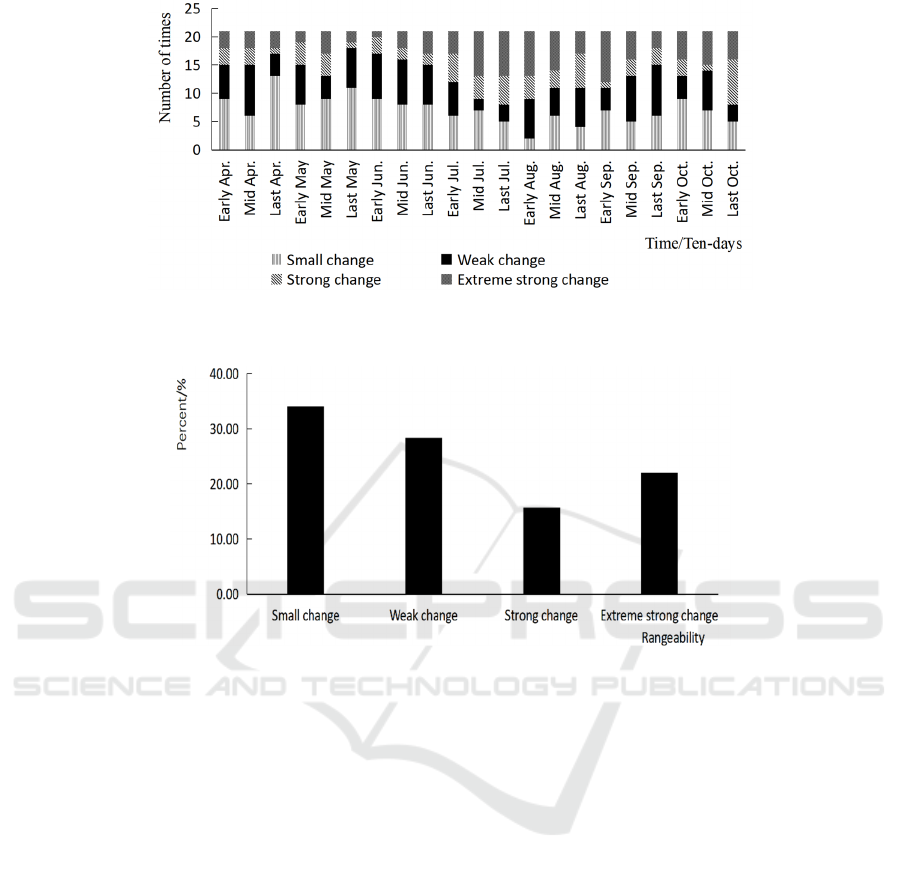
Figure 8: The frequency of change of ten-day meteorological index during the whole growth period of cotton in Sanyizhai
Irrigation Area from 1999 to 2019.
Figure 9: Percentage of different variation ranges of meteorological index in the whole growth period of cotton in Sanyizhai
Irrigation Area from 1999 to 2019.
4 CONCLUSIONS
(1) Based on 756 sets of ten-day meteorological data
from 1999 to 2019, the most significant four
meteorological factors were selected to construct the
winter wheat meteorological index according to the
path analysis of the water demand of winter wheat
crops in Yellow River Sanyishai Irrigation area, and
the four ranges of slight, weak, strong and extremely
strong were determined. The slight change refers to
the meteorological index between -10% and 10%.
The weak variation is between -30% and 30%, and
the strong variation is between -50% and 50%.
According to the path analysis of the water demand
of cotton and summer maize crops, the most
significant three meteorological factors were
selected to construct the meteorological index, and
four ranges were determined. The slight change
means that the meteorological index is between -
10% and 10%, the weak change is between -20%
and 20%, and the strong change is between -30%
and 30%.
(2) According to the frequency and time of
occurrence of meteorological indexes of different
variation ranges of winter wheat, it can be seen that
the most frequent occurrences of strong changes
occurred in the first, middle and late January, and
the most frequent occurrences of strong changes
occurred in the first ten days of February and the last
ten days of December. In the whole growth period of
winter wheat, the frequency of weak change was the
highest (40.79%), and the frequency of strong
change was the lowest (13.87%). The period when
the strong change occurred was the non-critical
water demand of winter wheat, so the change range
of irrigation water demand of winter wheat in the
whole growth period was not large. The most
frequent occurrence of strong changes in summer
maize was in mid-July, late July and early August,
and the most frequent occurrence of strong changes
was in early July and late August. The highest
ICBEB 2022 - The International Conference on Biomedical Engineering and Bioinformatics
46

frequency of strong variation was 28.57%, and the
lowest frequency of strong variation was 14.70%.
The 10 days of the whole growth period of summer
maize belong to the period when the summer
weather is susceptible to strong or strong changes. In
these periods, special attention should be paid to the
change of irrigation water demand caused by
meteorological changes, and the water diversion and
allocation plan of the irrigated area should be
dynamically adjusted in advance according to the
meteorological forecast. The strongest changes of
cotton meteorological index occurred most
frequently in the middle and late July, early August
and early September, and the strongest changes
occurred most frequently in the early July, late
August and late October. In other periods, the
change ranges of meteorological index were slight
and weak changes. The highest frequency of micro
change was 34.01%, and the lowest frequency of
strong change was 15.65%. The probability of small
and weak changes in the whole growth period of
cotton is high, but the fluctuation of irrigation water
requirement in summer when the weather is prone to
strong changes should also be concerned.
ACKNOWLEDGEMENT
This paper is supported by the following projects:
National Natural Science Foundation of China (No.
51809110); Science and Technology project of
Henan Province in 2021(No.212102311147); Key
Project of Water Resources Science and Technology
of Henan Province in 2019 (No.GG201938,
No.GG201930); Kaifeng Yellow River Basin
Ecological Protection and High-quality
Development Innovation Special Program in 2020
(No.2019012). This paper is the stage research result
of the above research projects.
REFERENCES
CAI Jiabing, LIU Yu, XU Di, et al. Sensitivity analysis on
water deficit indicator of winter wheat based on path
analysis theory (J). Journal of Hydraulic Engineering,
2008, 39 (1): 83-90.
Central Committee of the Communist Party of China and
State Council. About the implementation of the
development of new ideas to speed up agricultural
modernization to realize the goal of the all-round well-
off society several opinions (EB/OL). (2018-12-05)
(2020-10-21)
HTTP://http://www.xinshishe.com/html/news_2016/1
2/3133256295491281.html.
CUI Dangqun. Matrix Algorithm for Path Analysis (J).
Acta Biomathematica Sinica,1994,9(1):71-76.
FENG Feng, Ni Guangheng, Meng Yuqing. Evaluation of
water use efficiency in Yellow River Sanyizhai
Irrigation Area based on water flow tracking and
multiple weights (J). Transactions of the Chinese
Society of Agricultural Engineering,2017,33(5): 145-
153.
FENG Feng, SUN Ying, FENG Yuehua, et al. Evaluation
of completeness degree of Yellow River Sanyizhai
Irrigation Area based on flow direction tracking and
difference degree (J). Yellow River, 2019, 41(11):
159-164.
WEI Qingshun, SUN Xihuan, LIU Zailun, et al.Path
Analysis of Influence of Geometric Parameters of
Diversion on Performance of Submersible Pump (J).
Journal of Drainage and Irrigation Machinery
Engineering, 2014, 32(3):202-207.
WU Bin, WANG Aizhen, ZHAO Yi, et al.Planning Report
on the Renewal of Supporting Facilities and Water
Saving Transformation in Sanyizhai Yellow River
Sanyizhai Irrigation Area in Henan Province (R).
Kaifeng: Kaifeng Water Conservancy Building
Exploration and Design Institute, 2008.68-72.
Xinhua: At this symposium, Xi Jinping put forward a
major national strategy (EB/OL).
http://www.xinhuanet.com/politics/xxjxs/2019-
09/19/c_1125016382.htm.
Study on Crop Meteorological Index and Change Threshold in Yellow River Sanyizhai Irrigated Area
47
