
Research on Sector Rotation of China's A-share Market by using
Stock Data
Zhiqi Sun
1a
, Wenzheng Li
2b
, Ning Jiang
3c
and Huan Zhao
4d
1
Finance, Shandong University of Finance and Economics of China, Jinan, Shandong, China
2
The management of the cultural industry, Shandong University of Finance and Economics of China, Jinan, Shandong,
China
3
International Engineer, Anhui Polytechnic University, Wuhu, Anhui, China
4
Traffic Engineering, Harbin Institute of Technology at Weihai, Weihai, Shandong, China
Keywords: Sector Rotation, Correlation Coefficient Analysis, Time Series Analysis.
Abstract: Taking the data of China's A-share stocks in 2019 as the research object, this paper analyzes the correlation
between the price volatility of different stocks by Spearman correlation coefficient, and finally classifies it by
clustering algorithm to determine the real existence of the sector. Use Python to randomly sample stock from
each sector, calculate the price increase and decrease, daily rate of return. Weight the stock market value to
calculate the daily rate of return of the sector and use it for time series analysis, draw the time series plot to
determine the existence of sector rotation.
1 INTRODUCTION
With the development of the stock market, people
began to gradually find that there is a correlation
between the rise and fall of some stocks, and these
stocks are called a sector. When the stock market
rises and falls, some sectors usually rise or fall first,
while others rise and fall one after another. This
phenomenon is called "Sector Rotation". Sector
rotation is often expressed as a phenomenon of stock
market in China. In the process of market
development, the investment hotspot shifts from one
industry or several industries to another. However, it
remains to be explored whether this phenomenon
really exists and whether investors can make use of
the sector rotation phenomenon to make profits.
2 RELATED WORK
At present, domestic research mainly includes the
following two aspects.
a
https://orcid.org/0000-0002-8483-2706
b
https://orcid.org/0000-0002-3742-7353
c
https://orcid.org/0000-0002-1286-0839
d
https://orcid.org/0000-0003-4799-0649
2.1 Identification of Sector Rotation
Firstly, it is to identify the sector rotation
phenomenon, including qualitative and quantitative
aspects.
For qualitative dentification of sector history
phenomenon, He Chengying (2001) (He, 2001) first
made a theoretical analysis of the "sector
phenomenon" in China's stock market, and through
the relative yield index CR and its variance, gave a
quantitative index reflecting the intensity of sector
phenomenon. The study shows that the larger the
variance CR is, the smaller the sector rotation is.
For quantitative identification of sector
phenomenon, Wang Ning (2009) (Wang, 2009) used
Kendall synergy coefficient to study 30 secondary
industries of CSRC in China's stock market, found
that there were obvious industry sector phenomena in
China's stock market. Liu Yan and Li Xingping
(2013) (Liu, 2013, Li, 2013) used correlation analysis
and Granger causality analysis to empirically study
the relationship between 22 industry sectors. It is
found that there is Granger causality between various
366
Sun, Z., Li, W., Jiang, N. and Zhao, H.
Research on Sector Rotation of China’s A-share Market by using Stock Data.
DOI: 10.5220/0011178900003440
In Proceedings of the International Conference on Big Data Economy and Digital Management (BDEDM 2022), pages 366-370
ISBN: 978-989-758-593-7
Copyright
c
2022 by SCITEPRESS – Science and Technology Publications, Lda. All rights reserved

industry sectors, and the relationship between
industry sectors is changeable at different stages.
Liang Ye (2014) (Liang, 2014) made an empirical
study on 32 industry sectors in Shanghai and
Shenzhen stock markets by multidimensional scaling
method, and found that the phenomenon of industry
sectors was obvious.
In addition, there are some scattered studies that
believe that other factors, such as capital flow, The
banker's hype can also explain the phenomenon of hot
spot switching and sector rotation.
2.2 Sector Rotation as Investment
Strategies
At present, there are also some studies that analyze
sector rotation as investment strategies, including
qualitative and quantitative aspects.
First, a qualitative understanding, such as Zhang
Wei (2001), divides market stocks into high-priced
stocks, medium-priced stocks and low-priced stocks
from the perspective of technology investment, and
holds that in the rising market, the high-priced stocks
begin to rise first, followed by the medium-priced
stocks. Finally, it is the low-priced stock sector.
The second is the quantitative analysis of the
sector rotation strategy. For example, Huang Yin
(2019) (Huang, 2019) obtained different dimensions
of sector data by processing China's A-share data, and
trained the neural network for different data to obtain
the optimal quantitative investment strategy based on
Recurrent Neural Network. Yu Zeqi (2019) (Yu,
2011) quantified investment strategy of industry
sector rotation based on regression model. The
regression model is used to quantitatively study
whether there is real investment value in the sector
rotation strategy, taking the market itself as the
research object.
Through reading the literature, it is found that
although there are many researchers on sector
rotation at present, there are not any research on
sector rotation identification by using stock data to
establish a model. Therefore, this paper mainly
establishes a model through many stock data,
explores the existence of sectors and sector rotation,
and illustrates the problem through data.
3 DENTIFICATION OF SECTOR
In previous studies, people default that sectors exist,
but whether sectors really exist has not been verified.
In this section we use stock data to verify the
authenticity of sectors through mathematical models
and algorithms.
3.1 Model Preparation
1)Python package such as Glob, Pandas and
Openpyxl is used to read the file name, filter the data,
and store the rise and fall of each stock in the new
xlsx file.
2) Pearson correlation coefficient is used to
measure whether two data sets are on a line, that is,
to measure the linear relationship between distance
variables. When both variables are normal continuous
variables and there is a linear relationship between
them, Pearson correlation coefficient is often used to
describe the degree of correlation between them. The
specific calculation formula is as follows:
𝑟=
∑
𝑋
−𝑋
𝑌
−𝑌
∑
𝑋
−𝑋
∙
∑
𝑌
−𝑌
1
3) Spearman Grade correlation coefficient is
used to estimate correlation between variables The
correlation between variables can be described by
monotone function. The formula is as follows:
𝜌=1−
6
∑
𝑑
𝑁
𝑁
−1
2
4) K-Mean clustering algorithm is a kind of
iterative clustering algorithm. The K-Mean clustering
algorithm for solving the problem includes the
following steps:
Pre-dividing the data into K groups, randomly
selecting K objects as initial cluster centers, then
calculating the distance between each object and each
seed cluster center. After that assign each object to
the nearest cluster center. Cluster centers and the
objects assigned to them represent one cluster. Every
time a sample is assigned, the cluster center of the
cluster is recalculated according to the existing
objects in the cluster. This process will be repeated
until a certain termination condition is met.
The termination condition can be that no (or
minimum number) objects are reassigned to different
clusters, no (or minimum number) cluster centers
change again, error sum of squares local minimum.
Research on Sector Rotation of China’s A-share Market by using Stock Data
367
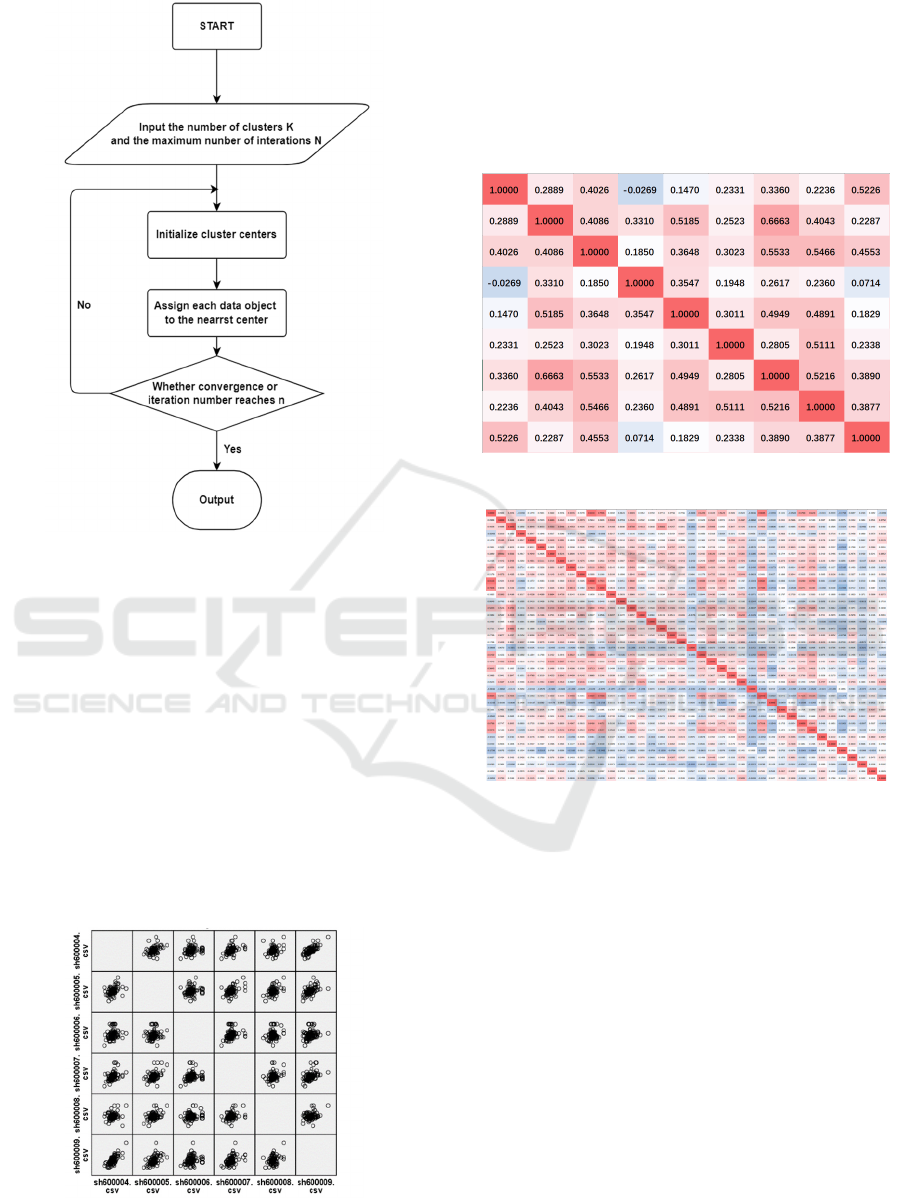
Figure 1: Clustering flow chart.
3.2 Establishment and Solution of
Model
1) Process the data through python and obtain
Stcok1.xlsx. The document contains the data of the
price increase and decrease of all stocks from January
1, 2019 to December 31, 2019. Then carry out the
correlation analysis.
2) Process original data series through SPSS
to get matrix scatter plot which shows that there is no
obvious linear relationship between variables, so
Pearson correlation coefficient cannot be used. We
can only use Matlab to get Spearman grade
correlation coefficient to analyze.
Figure 2: Matrix scatter plot.
3) Make Descriptive statistics of the data
using Matlab, finding that there is no big error. Then,
calculate the correlation coefficient and the P value
corresponding to the correlation coefficient, save the
correlation coefficient and P value as a File,
processing data through conditional format-gradation
using Excel, the results are as follows:
Figure 3: Conditional format-gradation result 1.
Figure 4:Conditional format-gradation result 2.
The deeper the red, the stronger the correlation.
From the above figure, we can preliminarily judge the
existence of sectors, and guess that there are 9 sectors
in total. Then, we use SPSS to verify the classification
of sectors.
Transpose the data of Stock1.xlsx to carry out K-
means clustering analysis using SPSS. The results are
as follows:
BDEDM 2022 - The International Conference on Big Data Economy and Digital Management
368
Table 1: Number of cases.
1. Number of cases in each
cluster
Clustering
1 167
21
3 905
41
5 379
6 147
7 433
8 202
9 289
effective
2524
lost
2
It can be seen from the results that although the
cluster is divided into 9 sectors, there are only 7
effective sectors, sector 2 and sector 4 only have 1
object. So we can came to the conclusion that the
sectors really exist and these stocks are divided into 7
stock sectors.
4 IDENTIFICATION OF SECTOR
ROTATION
As we have found that sectors really exist, whether
the sector rotation phenomenon is still unknow, In
this section we use stock data to verify the
authenticity of sectors rotation through mathematical
models and algorithms.
4.1 Model Preparation
Use python randomly take 10 stocks from each sector
as sample tickets, and take out the daily price increase
and decrease of the sample tickets from June 1st to
December 31st, 2019. Use pandas library to calculate
the daily rate of return; So time series analysis of
daily total rate of return of each sector is obtained by
weighting stock market value.
𝐹
=
∑
3
𝑅
=
,𝑖 = 1,2,3⋯10
4
𝑅𝑂𝐴
= 𝐹
×𝑅
,𝑁 = 1,2,3⋯7
5
4.2 Model Establishment and Solution
Using python to calculate results and save them as
Stock3.xlsx. Partial data is shown as follows:
Table 2: ROA data (1-5).
Time ROA1 ROA2 ROA3 ROA4 ROA5
2014-
12-31
-0.035 0.052 0.078 0.273 -0.033
2014-
12-30
-0.027 -0.130 -0.088 -0.137 -0.015
2014-
12-29
0.007 -0.023 -0.069 -0.172 0.066
2014-
12-26
0.103 0.110 0.131 0.073 -0.010
2014-
12-25
0.289 0.039 0.043 0.184 0.103
2014-
12-24
-0.177 0.141 0.129 0.065 0.159
2014-
12-23
-0.280 -0.127 -0.013 -0.176 -0.153
2014-
12-22
0.179 -0.440 -0.028 -0.297 -0.128
2014-
12-19
0.194 -0.108 -0.123 -0.130 0.068
2014-
12-18
0.013 -0.050 -0.051 0.132 -0.016
2014-
12-17
0.153 -0.059 -0.156 -0.087 -0.035
2014-
12-16
0.149 0.038 0.074 0.125 -0.076
2014-
12-15
-0.080 0.101 0.052 0.021 0.050
2014-
12-12
-0.070 0.037 -0.018 0.001 0.069
Analyze total rate of return (ROA) of each sector
using the time series and draw the time series diagram
as follows:
Research on Sector Rotation of China’s A-share Market by using Stock Data
369
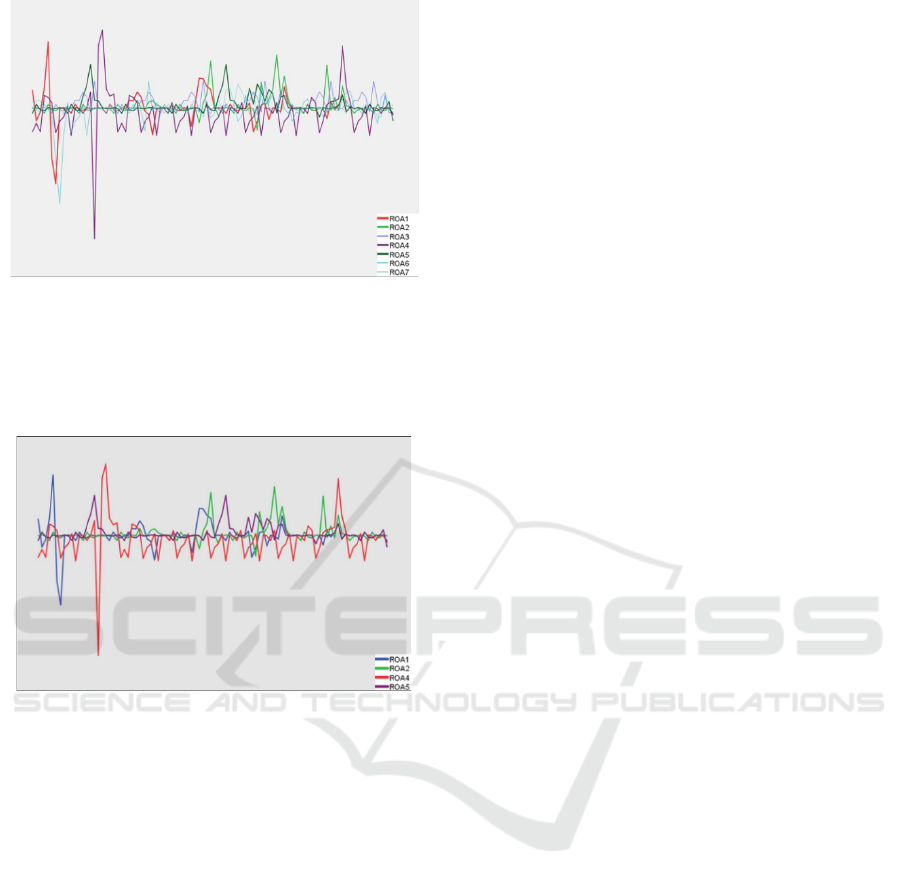
Figure 5: Time series one.
The preliminary results show that sectors 1, 2, 4,
5 have strong sector rotation. Now remove the
redundant sectors, and verify the sector rotation by
analyzing sectors 1, 2, 4 and 5.
Figure 6: Time series two
By analyzing the four sectors, it can be clearly
seen that when the stock market rises and falls, some
sectors usually rise or fall first, while other sectors
rise and fall successively, that is, the phenomenon of
sector rotation.
5 CONCLUSIONS
Taking the stock market in 2019 as the research
background, this paper selects the stock data traded in
Shanghai and Shenzhen A-share markets as the
research object. Through empirical analysis, it shows
that there is a phenomenon of sector rotation in
China's A-share market. When the stock market rises
and falls, some plates usually rise or fall first, while
others rise and fall one after another. There is a strong
correlation between the yield of each rotating sector.
Therefore, for investors, it is necessary to pay
attention to the information and development
released by different industries, the information and
development of one industry may fluctuate to other
industries. Then there will be a sector rotation
phenomenon, and investors can obtain excess returns
accordingly, which is also a problem worthy of
further exploration.
ACKNOWLEDGMENT
This paper was supported by my teammate of SDUFE
and 77 Development Program of China
REFERENCES
He Chengying. Analysis of ‘sector phenomenon’ in Chine
se stock market. Economic Research Journal, 2001
(12), 82-87.
Huang Yin. Construction of quantitative investment strate
gy of sector rotation based on recurrent neural networ
k. Zhejiang University. May 2019.
Liang Ye. Analysis of sector linkage effect of China A sha
re market. Modern Economic Information, 2014
(12X), 358-360.
Liu Yanyan, Li Xingping. Empirical analysis of industry s
ector fluctuation in Chinese stock market. The Science
Education Article Collects, 2013 (3), 199-200.
Wang Ning. An empirical study on the sector effect of Chi
nese stock market. Commercial Times, 2009 (28), 88-
89.
Yu Zeqi. Research on quantitative strategy of industry
sector rotation based on regression model.
Capital University of Economics and Business,
June 30, 2011.
BDEDM 2022 - The International Conference on Big Data Economy and Digital Management
370
