
Green Credit Policy and Enterprise Strategic Transformation:
Empirical Test of Heavy Pollution Industry
Fenglin Duan
a
School of International Education,Wuhan University of Technology, 122 Luoshi Road, Wuhan, China
Keywords: Green Credit, Heavy Polluting Enterprises, Enterprise Strategy, Difference in Difference Method, Financing
Constraints.
Abstract: The implementation of the ‘green credit guidelines’ is an important measure to promote the green and low-
carbon development of China's economy. Under the background of big data economy and digital management,
how to better play the role of green credit policy and promote the green transformation of enterprises is an
important topic to be studied and solved urgently. This paper takes the implementation of green credit policy
as a quasi natural experiment, selects China's A-share listed companies from 2010 to 2018 as the research
sample, and empirically tests the impact of green credit policy on enterprise strategy and its mechanism by
constructing PSM-DID model. It is found that the implementation of green credit policy has significantly
improved the strategic incentive progress of heavy polluting enterprises. After a series of robustness tests, the
conclusion is still valid. The intermediary effect test results show that financing constraints play a significant
intermediary role in the promotion of green credit to the progress of enterprise strategy. The research of this
paper provides a certain theoretical basis and policy enlightenment for the strategic transformation of heavy
polluting enterprises and the adjustment of green credit policy.
1 INTRODUCTION
In recent years, with the increasingly serious problem
of environmental pollution, the party and the state
attach great importance to the construction of
ecological civilization. The report of the 19th CPC
National Congress clearly pointed out "developing
green finance" and took it as one of the ways to
promote green development. On October 29, 2020,
the proposal of the Central Committee of the
Communist Party of China on formulating the 14th
five year plan for national economic and social
development and the long-term objectives for 2005
pointed out that we should accelerate the promotion
of green and low-carbon development, improve and
optimize the legal and policy guarantee for green
development, vigorously develop green finance and
promote the green transformation of key industries
and important fields. In addition, 2020 is the 15th
anniversary of China's concept of "green water and
green mountains are golden mountains and silver
mountains" and the key year for the conclusion of the
13th five year plan. It can be said that green finance
a
https://orcid.org/0000-0003-23338-4444
was, is and will still be one of the important economic
construction goals in the future. At the same time, it
is an important measure and necessary way for China
to achieve green development. As a key measure to
guide the green allocation of credit resources, green
credit plays an important role in promoting green and
low-carbon economic development and promoting
green innovation of enterprises. In 2012, the former
CBRC issued the guidelines on green credit, which
put forward clear requirements for banking financial
institutions to effectively carry out green credit and
vigorously promote energy conservation, emission
reduction and environmental protection. On the one
hand, through green credit, give full play to the role
of banking financial institutions in guiding the flow
of social funds and allocating resources, and guide the
internal funds and social funds of the financial system
to flow from the pollution field to the green field. On
the other hand, it is required to promote green credit
from a strategic perspective, improve support for
green economy, low-carbon economy and circular
economy, and strengthen the supervision of financial
institutions on fund users, so as to better serve the real
262
Duan, F.
Green Credit Policy and Enterprise Strategic Transformation: Empirical Test of Heavy Pollution Industry.
DOI: 10.5220/0011173600003440
In Proceedings of the International Conference on Big Data Economy and Digital Management (BDEDM 2022), pages 262-274
ISBN: 978-989-758-593-7
Copyright
c
2022 by SCITEPRESS – Science and Technology Publications, Lda. All rights reserved

economy and promote the transformation of
development mode.
The existing literature on green credit in China
mainly focuses on the following aspects: First,
analyze the risk and uncertainty of green credit from
the macro level. For example, Shen Hongtao and Ma
Zhengbiao (Shen, Ma, 2014) studied from the
normative level of empirical analysis and believed
that the implementation of green credit must solve the
contradiction between environmental protection and
economic benefits, and correct the concept of GDP
only performance of local governments. Xu Sheng et
al (Xu, et al, 2018) analyzed the impact of green
credit on high-quality regional economic
development by studying the mechanism of green
credit on industrial structure upgrading. Second,
analyzed the implementation effect of green credit
policy from the micro level. For example, Wen Subin
and Zhou Liuliu (Wen, Zhou, 2017) found that green
credit can effectively drive enterprises to carry out
technological innovation and improve pollution
control level by analyzing the impact of green credit
on enterprise financial performance and enterprise
value. Chen Xingxing et al. (Chen, et al, 2019) took
the implementation of the green credit guidelines as a
quasi natural experiment. By constructing the
commercial credit index of 17873 A-share listed
companies from 2006 to 2015, they found that green
credit had a significant financing penalty effect,
increased the investment in environmental
governance of heavy polluting enterprises and
promoted the structural adjustment of heavy polluting
industries. Zhan Hua (Zhan 2021) analyzed the
measurement indicators of enterprise environmental
disclosure level and found that green credit promoted
the improvement of enterprise environmental
information disclosure level through financing
constraints and environmental performance channels.
In conclusion, we know that green credit inhibits the
credit financing of heavily polluting enterprises,
significantly improves the level of environmental
information disclosure of enterprises, helps to
promote technological innovation and industrial
structure upgrading of enterprises, so as to promote
the transformation of economic development mode
and the construction of ecological civilization.
However, there is little literature on the relationship
between green credit and enterprise strategy. Will the
implementation of green credit policy change the
strategic choice of heavy polluting enterprises? Does
this impact have differentiated performance among
different enterprises? This will become the core issue
of this paper.
This paper takes the implementation of green
credit policy as a quasi natural experiment, selects
China's A-share listed companies from 2010 to 2018
as the research sample, and empirically tests the
impact of green credit policy on enterprise strategy
and its mechanism by constructing PSM-DID model.
Based on the enterprise strategy theory of miles et al
(1978, 2003), enterprises are divided into
prospectors, defenders and analyzers according to the
differences of enterprise strategy and progress in this
paper. This paper expands the relevant research on
the economic consequences of green credit policy,
and has some enlightenment for the strategic
transformation of heavy polluting enterprises, which
has both academic and practical significance. The
contributions of this paper include: First, with the
help of green credit policy as a quasi natural
experiment, the double difference regression after
propensity score matching is used to better alleviate
the endogenous problem. Secondly, it examines the
impact of green credit policy on corporate strategy
from the micro perspective of listed enterprises, and
provides the theoretical basis of impact mechanism
and heterogeneity. Thirdly, it examines the economic
consequences of the green credit policy from the
strategic level of the company, which provides an
empirical reference for promoting the green and low-
carbon development of the domestic capital market.
2 THEORETICAL ANALYSIS
AND HYPOTHESIS
2.1 Green Credit Policy and Enterprise
Strategic Transformation
The guidelines on green credit put forward clear
requirements for China's banking financial
institutions to effectively carry out green credit and
vigorously promote energy conservation, emission
reduction and environmental protection. The policy
promotes the implementation of incentive and
restraint measures through a series of measures,
promotes the standardization and institutionalization
of the system, and shows the strong determination of
the Chinese government to deal with environmental
problems. This paper holds that the implementation
of green credit policy will promote the strategic
transformation of China's heavily polluting
enterprises from the following three aspects, and
there are two possibilities for the change of enterprise
strategy.
Green Credit Policy and Enterprise Strategic Transformation: Empirical Test of Heavy Pollution Industry
263

First, the green credit policy has a significant
financing penalty effect. Green finance measures
require commercial banks to strictly control the
direction and scale of credit and curb the lending
space for polluting projects, Thus, heavy polluting
enterprises face higher financing threshold and
financing cost (Liu, et al., 2019; Chen, 2019).
According to Su Dongwei and Lian Lili (Lian 2018),
the financing decisions of enterprises are greatly
affected by the supply of financial markets. The
increase of credit threshold has significantly reduced
the long-term debt financing of heavily polluting
enterprises. On the one hand, under financing
constraints, heavily polluting enterprises lack funds
to carry out projects, so they may change from
prospectors to defenders and adopt a more
conservative enterprise strategy. On the other hand,
considering the obvious capital oriented mechanism
in the green credit policy, heavily polluting
enterprises may tend to change their development
mode and find a new way out (Wang, 2021, Wang,
2021), so they may choose a more radical enterprise
strategy and change from defender to prospectors.
Second, the green credit policy has an investment
restriction effect on heavily polluting enterprises.
Under the green financial measures, the financial
asset allocation of heavily polluting enterprises is
interfered by the government and the market, and the
financing cost of non green projects increases.
Therefore, the inefficient investment of enterprises,
especially over investment, has decreased
significantly (Wu, et al., 2012). In addition, the green
credit policy requires heavily polluting enterprises to
reduce pollutant emissions and improve their
environmental governance capacity. Under the
condition of limited financial resources,
environmental governance investment must have a
"crowding out effect" on productive investment in the
short term (Wang, etc. 2021). The investment of
heavy polluting enterprises is limited, and the
enterprise strategy may tend to be conservative.
However, from the perspective of transformation and
development, facing the dilemma of double
restrictions on financing and investment, heavy
polluting enterprises may increase green investment
in order to find a new development outlet (Wang, etc.,
2021), making the enterprise strategy from
conservative to radical.
Third, the green credit policy will bring greater
public pressure and moral condemnation to heavily
polluting enterprises. In addition to reducing the debt
financing of heavily polluting enterprises, public
opinion will also affect the investment and financing
behavior and enterprise strategy of enterprises
through supervision mechanism and reputation
mechanism (Zhu, Tan, 2020). On the one hand,
public opinion pressure forces heavily polluting
enterprises to strengthen environmental governance,
improve the level of environmental information
disclosure and reduce inefficient investment (Zhan,
2021). In this case, the corporate strategy may tend to
be conservative , making the corporate change
from prospectors to defenders. On the other hand, the
social reputation mechanism will promote enterprises
to establish a corporate image in line with the concept
of green development. Heavily polluting enterprises
may increase green investment, seek strategic
transformation and adopt more radical strategies to
change from defender to prospectors.
Based on the above analysis, this paper puts
forward the following assumptions:
Hypothesis H1a: Green credit policy will turn
heavy polluting enterprises from prospectors to
defenders.
Hypothesis H1b: Green credit policy will turn
heavy polluting enterprises from defender to
prospectors.
2.2 Intermediary Effect of Financing
Constraints
Firstly, the green credit policy has reduced the total
amount of funds and financing channels of heavily
polluting enterprises to a certain extent, making
enterprises face more severe financing constraints.
From the perspective of banking financial
institutions, under the strict green financial measures,
commercial banks are bound to strictly control the
credit gateway of heavily polluting enterprises and
improve their loan threshold. Banks use credit
supervision means to strictly control the credit
approval process for enterprises with high energy
consumption and high pollution, Raise the financing
threshold and cost of enterprises (allet, 2015; Zhu,
Tan, 2020). From the perspective of the whole capital
market, green credit guides social funds from the
polluting field to the green field. Under this policy
guidance, the willingness of external creditors to
provide debt capital for heavily polluting enterprises
is weakened (Wu, et al., 2012), investors will reduce
their investment in polluting enterprises, so the debt
financing level of heavily polluting enterprises will
decline. Secondly, the aggravation of the financing
constraint level of enterprises will change the
strategic choice of enterprises. Specifically, there are
two possible changes. On the one hand, after the
implementation of the green credit policy, heavily
polluting enterprises facing financing constraints lack
BDEDM 2022 - The International Conference on Big Data Economy and Digital Management
264

free cash flow for investment. Therefore, managers
will be more cautious in making investment
decisions, reduce unnecessary investment and choose
defensive enterprise strategies (Hovakimian, 2011).
Using the investment cash flow sensitivity model,
Fazzari et al (Fazzari, et al, 1988) found that
financing constraints will inhibit enterprise
performance, which makes the corporate change from
prospector to defender and choose a more
conservative strategy. On the other hand, green credit
dynamically increases the opportunity cost of
environmental pollution through credit channels. In
order to get rid of the current situation of financing
constraints, heavily polluting enterprises tend to
increase clean investment and reduce polluting
investment. Enterprises hope to seek transformation
and development through green innovation (Wang,
2021). Therefore, they may adopt a more radical
corporate strategy, changing from defenders to
prospectors. Based on the above analysis, this paper
puts forward the following assumptions:
Hypothesis H2: The level of corporate financing
constraints plays an intermediary role between green
credit policy and corporate strategy.
3 RESEARCH DESIGN
3.1 Sample Selection and Data Source
This paper takes the listed companies on China's
Shanghai and Shenzhen main board, small and
medium-sized board and gem as the research object,
and the data sample interval is 2006-2018. The
sample data are taken from guotai'an financial
database (CSMAR). In order to improve the
reliability of the data, this paper processes the original
data as follows: (1) Exclude listed companies in the
financial industry and ST listed companies. (2)
Eliminate the data that are obviously abnormal, such
as sample with an asset liability ratio greater than 1
or a share price bubble less than 0. (3) Samples with
missing or partially missing data are excluded. (4) A
total of 1% tail reduction is performed on both sides
of continuous variables to avoid the influence of
extreme values. After the above processing, this
paper obtains the unbalanced panel data of 14966
samples from 2006 to 2018.
3.2 Variable Setting
3.2.1 Enterprise Strategy Type
Drawing on the empirical measurement method of
enterprise strategy proposed by Bentley et al.
(Bentley, et al, 2013) and Higgins et al. (2014), this
paper uses the following six indicators to construct
the enterprise strategy index: (1) The tendency of
enterprises to develop new products, which is
measured by the proportion of R & D expenditure in
sales revenue. (2) The ability of an enterprise to
effectively produce and distribute its products and
services, which is measured by the ratio of the
number of employees to sales revenue. (3) Enterprise
growth potential, which is measured by the historical
growth rate of sales revenue. (4) Product
expansibility, which is measured by the proportion of
sales expenses and management expenses in sales
revenue. (5) Organizational stability, which is
measured by the fluctuation of the number of
employees, that is, the standard deviation of the
number of employees divided by the average number
of employees. (6) Capital intensity, which is
measured by the proportion of fixed assets in total
assets. According to the research of Zhang Yanchao
et al (Zhang, et al, 2021), compared with defenders:
(1) Prospectors have stronger desire to develop new
products and higher research expenditure. (2)
Prospectors have lower requirements for production
efficiency and have a larger ratio between the number
of employees and sales revenue. (3) The revenue
growth trend of prospectors is obvious and the growth
is stronger. (4) Prospectors pay attention to the
expansion of product market and have higher sales
and management expenses. (5) The organizational
stability of prospectors is poor, and the tenure of
employees is generally short. (6)Prospectors pay
more attention to human capital investment, the
investment in fixed assets is relatively lower than that
of defensive enterprises, and the capital intensity is
lower.
The above six indicators take the moving average
value of the past five years, and each "year industry"
sample is divided into five groups from small to large.
For the first five variables, the minimum group is
assigned 0 and the maximum group is assigned 4. For
the last indicator, the reverse method is adopted. The
maximum group is assigned 0 points and the
minimum group is assigned 4 points. Finally, for each
"company year" observation value, the values of the
six indicators are summed up, and finally the
enterprise strategy index strategy with a value range
of 0-24 is obtained. This indicator measures the
Green Credit Policy and Enterprise Strategic Transformation: Empirical Test of Heavy Pollution Industry
265

degree of strategic radicalization of an enterprise. The
higher the strategic score, the more inclined the
enterprise is to become an prospector, and the higher
the degree of strategic radicalization of the enterprise.
3.2.2 Green Credit Policy
Treated is the company dummy variable. This paper
distinguishes heavy polluting enterprises according
to the notice on printing and distributing the classified
management directory of environmental protection
verification industry of Listed Companies in 2008
and the industry classification standard of CSRC in
2012. If the sample is a heavily polluting enterprise,
the variable is taken as 1, otherwise it is taken as 0.
Post is a time dummy variable. The green credit
guidelines were officially published in February
2012. Therefore, if the sample year is 2012 and later,
the variable is taken as 1, otherwise it is taken as 0.
3.2.3 Financing Constraint Index
Referring to the research of Jiang Fuxiu et al. (2016)
and Li Wenjing et al. (2017), this paper uses KZ index
to measure the level of enterprise financing
constraints. The index is calculated by Kaplan and
Zingales (1997). The larger the value, the higher the
degree of financing constraints faced by enterprises.
The calculation formula of KZ index is as follows:
𝐾𝑍 = −
𝑂𝐶𝐹
𝐴𝑠𝑠𝑒𝑡
+ 3.14𝐿𝑒𝑣𝑒𝑟𝑎𝑔𝑒
− 36.37
𝐷𝑖𝑣𝑖𝑑𝑒𝑛𝑑𝑠
𝐴𝑠𝑠𝑒𝑡
−1.31
𝐶𝑎𝑠ℎ
𝐴𝑠𝑠𝑒𝑡
+ 0.28𝑇𝑜𝑏𝑖𝑛𝑄
(1)
In the formula, OCF, asset, dividers and cash are
operating net cash flow, total assets at the beginning
of the period, dividends payable and cash holding
level respectively, and leverage and tobinq represent
asset liability ratio and Tobin Q value respectively.
The larger the KZ index, the higher the level of
corporate financing constraints and the more
seriously affected by financing constraints.
3.2.4 Control Variable
Based on the research of Wang Yejing et al. (2021),
Meng Qingbin et al. (2019), Zhang Yanchao et al.
(2021) and Han Yanjin (2021), this paper sets 10
control variables, including enterprise size (Size0,
return on total assets (ROA), asset liability ratio
(Lev), cash flow (Cf), equity concentration (Top5),
combined title of board chair and CEO (Dual),
executive compensation (Pay), board size (Board),
state-owned enterprise (Soe) and listed years
(FirmAge).In addition, in this paper, in order to
control the impact of industry and year variables on
financial risk, the industry (Industry) dummy
variables are set according to the industry
classification standard of the industry guidelines for
listed companies (2012) of the CSRC. And the year
dummy variables are set according to the year. The
definitions of all variables in this paper are shown in
Table1.
Table 1: Variable definition table.
Variable t
yp
e Variable name Variable s
y
mbol Definition
Dependent
variables
Enterprise
Strateg
y
Strategy
Refer to the measurement methods of Bentley et al.
(2013) and Wang Huacheng et al. (2016).
Independent
variables
Time dummy
variable
Post
Based on the green credit guidelines issued in 2012, it
is 0 before im
p
lementation and 1 after im
p
lementation.
Enterprise
dumm
y
variable
Treated
When the company belongs to heavy pollution
industr
y
, the value is 1; otherwise, the value is 0.
Intermediary
variable
Financing
constraint level
KZ KZ index of Kaplan and Zingales(1997)
Control variable
Enterprise size Size Natural logarithm of total assets
Return on total
assets
ROA Net profit divided by total assets
Asset liability
ratio
Lev Total liabilities divided by total assets
Cash flow Cf
Net cash flow from operating activities divided by total
assets
BDEDM 2022 - The International Conference on Big Data Economy and Digital Management
266

Equity
concentration
Top5 Shareholding ratio of the top five shareholders
Combined title of
board chair and
CEO
Dual
When the chairman and general manager are held by
one person, it is 1, otherwise it is 0.
Executive
com
p
ensation
Pay
Natural logarithm of top three executives'
com
p
ensation
Board size Boar
d
Number of board directors
State-owned
enter
p
rise
Soe
1 for state-owned enterprises and 0 for non-state-owned
enter
p
rises
Listed
y
ears FirmA
g
e Years of listin
g
3.3 Model Building
Taking listed companies in heavy pollution industries
as the experimental group, this paper uses the
following fixed effect double difference model to test
the impact of green credit policy on enterprise
strategy types. The specific model is as follows:
𝑆𝑡𝑟𝑎𝑡𝑒𝑔𝑦
,
=𝛼+𝛽
𝑃𝑜𝑠𝑡
×𝑇𝑟𝑒𝑎𝑡𝑒𝑑
+𝛽
𝑇𝑟𝑒𝑎𝑡𝑒𝑑
+𝛽
𝑃𝑂𝑆𝑇
+𝐶𝑜𝑛𝑡𝑟𝑜𝑙𝑠
,
+
∑
𝐼𝑛𝑑𝑢𝑠 +
∑
𝑌𝑒𝑎𝑟 + 𝜀
,
(2)
In the model, 𝑆𝑡𝑟𝑎𝑡𝑒𝑔𝑦
,
is the enterprise
strategy type of company i at time point t.The
independent variable 𝑇𝑟𝑒𝑎𝑡𝑒𝑑
is taken as 1 when
company i belongs to heavy pollution industry,
otherwise it is taken as 0, which individually reflects
the strategic difference between heavy pollution
enterprises and non heavy pollution enterprises. The
independent variable 𝑃𝑜𝑠𝑡
,
is 1 after the
promulgation of the green credit policy, otherwise it
is 0, which reflects the difference of enterprise
strategy before and after the implementation of the
green credit policy. The coefficient 𝛽
of the
interaction term Post×Treated measures the
processing effect of green credit policy. Controls
include a series of control variables at the company
level. Industry and year control the fixed effects at the
industry and year levels respectively, and 𝜀
,
is the
random disturbance term. If 𝛽
is significantly less
than 0, it indicates that the implementation of green
credit policy has significantly transformed heavy
polluting enterprises from prospectors to defenders.
At this time, H1a is assumed to be true. Conversely,
if 𝛽
is significantly greater than 0, H1b is assumed
to be true.
Further, referring to the sequential test method of
intermediary effect proposed by Wen Zhonglin and
ye Baojuan (Wen, ye, 2014), this paper examines the
role channels of green credit policy affecting
enterprise strategic transformation. The test
procedures of intermediary effect are as follows:
𝑆𝑡𝑟𝑎𝑡𝑒𝑔𝑦
,
=𝛼+𝛽
𝑃𝑜𝑠𝑡
×𝑇𝑟𝑒𝑎𝑡𝑒𝑑
+𝜇𝐶𝑜𝑛𝑡𝑟𝑜𝑙𝑠+𝜀
,
𝐾𝑍
,
=𝛼+𝜑𝑃𝑜𝑠𝑡
×𝑇𝑟𝑒𝑎𝑡𝑒𝑑
+𝜇𝐶𝑜𝑛𝑡𝑟𝑜𝑙𝑠 + 𝜀
,
𝑆𝑡𝑟𝑎𝑡𝑒𝑔𝑦
,
=𝛼+𝛽
𝑃𝑜𝑠𝑡
×𝑇𝑟𝑒𝑎𝑡𝑒𝑑
+𝜏𝐾𝑍
,
+𝜇𝐶𝑜𝑛𝑡𝑟𝑜𝑙𝑠+𝜀
,
(3)
(4)
(5)
In the model, the intermediary variable 𝐾𝑍
,
represents the financing constraint level of the
enterprise. If the 𝜑 and 𝜏 coefficients in equations
(3) and (4) are statistically significant at the same
time and the direction meets the expectation, it
indicates that the intermediary effect exists, that is,
the implementation of green credit will change the
strategic type of the enterprise by changing the
financing constraint level of the enterprise. At this
time, it is assumed that H2 is true.If at least one of 𝜑
and 𝜏 is not statistically significant, this paper adds
a bootstrap test to judge whether the mediating effect
exists.
4 EMPIRICAL RESULTS AND
ANALYSIS
4.1 Descriptive Statistics
Table 2 presents the descriptive statistical results of
the main variables. The average value of enterprise
strategy index is 12.08 and the median is 12. It can be
seen that Chinese listed companies are generally
analyzers, which is neither too radical nor too
conservative. The standard deviation of enterprise
strategic indicators is 4.897, indicating that there are
great differences in the strategic types of different
enterprises. The average ROA of total asset return is
3.201%. The average value and median of equity
concentration are 49.88% and 49.69% respectively,
which is in line with the reality of equity
concentration of Listed Companies in China. The
Green Credit Policy and Enterprise Strategic Transformation: Empirical Test of Heavy Pollution Industry
267

average value of property right is 0.582, which
reflects that in the research sample of this paper,
state-owned enterprises account for 58.2% and non-
state-owned enterprises account for 41.8%.
Table 2: Variable descriptive statistics.
Variable N mean median sd min max
Strategy 14966 12.08 12 4.897 2 24
Post 14966 0.670 1 0.470 0 1
Treated 14966 0.371 0 0.483 0 1
KZ 14966 4.002 3.753 2.182 -5.983 15.91
Size 14966 22.33 22.20 1.250 19.12 25.92
ROA 14966 3.201 2.968 5.809 -25.62 21.07
Lev 14966 49.22 50.08 19.87 5.353 89.27
Cf 14966 4.583 4.455 7.185 -15.56 23.95
Top5 14966 49.88 49.69 14.97 19.41 88.46
Dual 14966 0.173 0 0.379 0 1
Pay 14966 14.28 14.29 0.772 12.15 16.21
Board 14966 8.943 9 1.794 5 15
Soe 14966 0.582 1 0.493 0 1
FirmAge 14966 20.78 22 5.516 9 29
4.2 Correlation Analysis
Pearson correlation test was performed on the main
variables, and the results are shown in Table 3. There
is a significant positive correlation between the level
of financing constraints KZ and the degree of
enterprise strategic radicalization, indicating that the
intensification of financing constraints makes the
enterprise's strategic choice more radical, which
preliminarily verifies H2. In addition, the absolute
values of correlation coefficients between variables
are far less than 0.8, so there is no serious multi
collinearity problem in the model. At the same time,
most control variables have significant correlation
with enterprise strategic progress indicators, and the
setting of control variables is meaningful.
Table 3: Pearson correlation coefficient table.
Strategy Post Treated KZ Size ROA Lev Cf Top5 Dual Pay Board Soe FirmAge
Strategy 1
Post
0.201
***
1
Treated
0.205
***
-0.036
***
1
KZ
0.039
***
0.164
***
0.054
***
1
Size
0.064
***
0.221
***
-0.008
0.074
***
1
ROA
-0.067
***
-0.039
***
0.030
***
0.508
***
0.092
***
1
Lev
-0.036
***
-0.107
***
-0.050
***
-0.545
***
0.374
***
-0.338
***
1
Cf 0.002
-0.045
***
0.152
***
0.606
***
0.022
***
0.344
***
-0.163
***
1
Top5
-0.046
***
0.040
***
0.024
***
0.128
***
0.324
***
0.147
***
0.047
***
0.100
***
1
Dual
0.023
***
0.105
***
-0.019
**
0.013
*
-0.074
***
-0.004
-0.072
***
-0.026
***
-0.070
***
1
Pay 0.060 0.369 -0.135 0.237 0.486 0.241 -0.004 0.063 0.118 0.037 1
BDEDM 2022 - The International Conference on Big Data Economy and Digital Management
268
*** *** *** *** *** *** *** *** ***
Board
-0.033
***
-0.120
***
0.088
***
0.024
***
0.220
***
0.036
***
0.125
***
0.069
***
0.085
***
-0.159
***
0.057
***
1
Soe
-0.037
***
-0.184
***
0.023
***
-0.077
***
0.163
***
-0.041
***
0.185
***
0.022
***
0.136
***
-0.244
***
-0.121
***
0.258
***
1
FirmAge
-0.173
***
-0.351
***
-0.007
-0.162
***
0 -0.013
0.229
***
-0.008
-0.082
***
-0.174
***
-0.136
***
0.106
***
0.371
***
1
Note: *, * *, * * * respectively indicate that the correlation between variables is significant at the statistical levels of 10%, 5% and 1%.
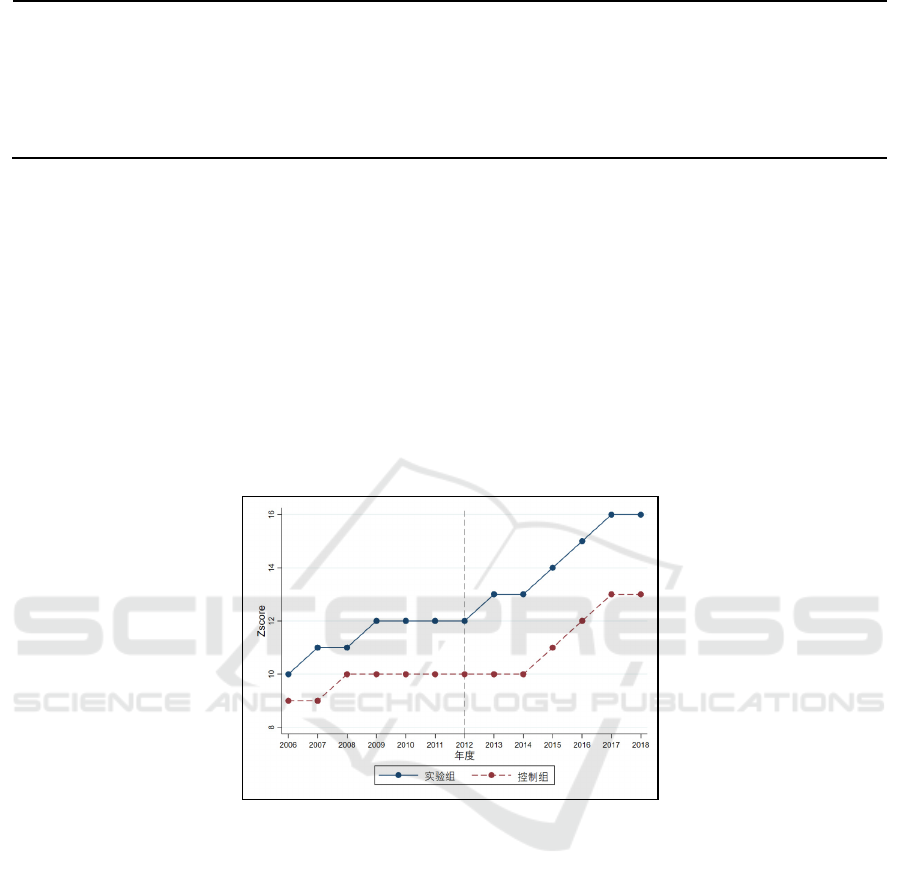
4.3 Parallel Trend Test
Bertrand (Bertrand 2004) pointed out that one of the
preconditions for the effectiveness of the double
difference estimation is that the experimental group
and the control group meet the same trend hypothesis
before being processed. Therefore, in order to verify
the applicability of the DID model, this paper
conducted a same trend test on the enterprise strategy
types of the green credit policy experimental group
and the control group, as shown in Figure 1 below.
The results show that before the implementation of
the green credit policy in 2012, the growth trend of
the enterprise strategic incentive progress of the
experimental group and the control group remains
roughly the same. While after the implementation of
the policy, the growth trend of the strategic incentive
progress of the experimental group and the control
group is obviously different. Therefore, the premise
of the same trend hypothesis is tenable, which means
that it is appropriate to use DID model to test the
impact of green credit policy on enterprise strategic
incentive progress.
Figure 1: Parallel trend of enterprise strategic progress.
4.4 Regression Result Analysis
The benchmark regression results are shown in Table
4. Columns (1) and (2) of Table 4 show the regression
results without control variables and with control
variables respectively. The degree of enterprise
strategic radicalization is significantly positively
correlated with the implementation of green credit
policy at the level of 1%, indicating that the green
credit policy can significantly improve the strategic
radicalization progress of heavily polluting
enterprises whether or not the influence of other
factors is controlled. Column (3) controls the impact
of year and industry. The results show that the
regression coefficient between green credit policy
and enterprise strategic incentive progress is 0.858,
which is significant at the level of 1%, that is, after
jointly controlling other factors, year and industry
fixed effects, the implementation of green credit
policy still plays a role in improving enterprise
strategic incentive progress. Based on the regression
results of column (1) (2) (3), hypothesis H1a is
verified.
Green Credit Policy and Enterprise Strategic Transformation: Empirical Test of Heavy Pollution Industry
269

Table 4: Test of the impact of green credit policy on enterprise strategic progress.
(1) (2) (3)
VARIABLES Strate
gy
Strate
gy
Strate
gy
Post×Treate
d
3.002*** 2.623*** 0.858***
(34.74) (28.88) (7.22)
Size 0.346*** 0.036
(8.23) (1.13)
ROA -0.074*** -0.024***
(-9.61) (-4.34)
Lev -0.010*** -0.005***
(-4.20) (-2.92)
Cf 0.005 0.032***
(0.90) (7.85)
To
p
5 -0.028*** -0.016***
(-10.09) (-8.14)
Dual -0.091 -0.159**
(-0.87) (-2.16)
Pa
y
0.131** 0.074
(2.18) (1.57)
Boar
d
-0.095*** -0.005
(-4.23) (-0.32)
SOE 0.440*** 0.703***
(4.93) (10.78)
FirmA
g
e -0.136*** 0.004
(-17.46) (0.60)
Constant 11.293*** 7.376*** 2.829***
(270.13) (8.46) (3.23)
Yea
r
NONOYES
Industry NO NO YES
Observations 16,934 14,966 14,966
R-square
d
0.067 0.102 0.567
Note: *, * *, * * * respectively indicate that the correlation between variables is significant at the statistical levels of 10%,
5% and 1%.The value of t is in parentheses.
Table 5 shows the regression test results of the
intermediary effect of corporate financing
constraints.Among them, column (1) is the regression
result when the intermediary variable is not included.
At this time, the estimation coefficient of
Post×Treated is significantly positive at the level of
1%, indicating that the implementation of green
credit policy has significantly improved the strategic
incentive progress of heavy polluting
enterprises.Column (2) shows the regression results
of the impact of policy implementation on
intermediary variables. The estimation coefficient of
Post×Treated is significantly positive at the level of
5%, indicating that green credit has significantly
tightened the financing constraints of
enterprises.Column (3) is the regression situation
after the intermediary variable is included. It can be
seen that the estimated coefficients of Post×Treated
and KZ are significantly positive at the level of 1%,
and the estimated coefficient of Post×Treated is lower
than column (1), indicating that the financing
constraint plays a significant intermediary role in the
impact of green credit on the strategic incentive
progress of enterprises (Wen and Ye, 2014), which is
verified The influence path of "green credit →
improvement of financing constraint level →
improvement of enterprise strategic incentive
progress".Based on the regression results of column
(1) (2) (3), the hypothesis H2 is verified.
BDEDM 2022 - The International Conference on Big Data Economy and Digital Management
270

Table 5: Intermediary effect test of financing constraint level.
(1) (2) (3)
VARIABLES
Strategy KZ Strategy
Post×Treated 0.858*** 0.088** 0.850***
(7.22) (2.25) (7.15)
KZ 0.068***
(3.12)
Size 0.036 0.370*** 0.010
(1.13) (35.58) (0.29)
ROA -0.024*** 0.061*** -0.028***
(-4.34) (32.36) (-4.94)
Lev -0.005*** -0.057*** -0.002
(-2.92) (-98.59) (-0.72)
Cf 0.032*** 0.147*** 0.023***
(7.85) (108.46) (4.38)
Top5 -0.016*** 0.003*** -0.016***
(-8.14) (5.11) (-8.20)
Dual -0.159** 0.038* -0.157**
(-2.16) (1.74) (-2.14)
Pay 0.074 0.112*** 0.066
(1.57) (7.31) (1.41)
Board -0.005 0.016*** -0.006
(-0.32) (2.92) (-0.39)
SOE 0.703*** -0.019 0.702***
(10.78) (-0.84) (10.77)
FirmAge 0.004 -0.026*** 0.005
(0.60) (-14.34) (0.75)
Constant 2.829*** -4.270*** 3.112***
(3.23) (-3.29) (3.53)
Year YES YES YES
Industry YES YES YES
Observations
14,966 22,664 14,966
R-squared
0.567 0.692 0.567
Note: *, * *, * * * respectively indicate that the correlation between variables is significant at the statistical levels of 10%,
5% and 1%.The value of t is in parentheses.
5 ROBUSTNESS TEST
5.1 Replace Interpreted Variable
Referring to the practice of Sun Jian et al. (2016), this
paper replaces the strategic incentive progress index
strategy with the dummy variable PROS representing
offensive strategy and the dummy variable DEFE
representing defensive strategy. When strategy ≥ 18,
PROS takes 1, otherwise 0. When strategy ≤ 6, DEFE
takes 1, otherwise 0. Then, according to the model
(1), logit regression is used again for estimation. The
regression results are shown in columns (1) and (2) of
table 6, and the research conclusions remain
unchanged.
5.2 Change Estimation Method
In order to avoid the influence of company
characteristics on the regression results, this paper
controls the fixed effect at the company level and
clusters the standard errors at the company level. The
regression results are shown in column (3) in Table 6,
and the research conclusions remain unchanged. At
the same time, this paper changes the time interval of
policy impact. The sample interval set in column (4)
Green Credit Policy and Enterprise Strategic Transformation: Empirical Test of Heavy Pollution Industry
271
(5) (6) in Table 6 is 2 years before and after the
policy, 3 years before and after the policy, and 4 years
before and after the policy. The regression result is
positive and significant, which is consistent with the
previous conclusion.
Table 6: Robustness test results.
VARIABLES
Replace dependent variable Change estimation method Change time interval
(1)
PROS
(2)
DEFE
(3)
Firm Effect
(4)
[-2,2]
(5)
[-3,3]
(6)
[-4,4]
Post×Treated
0.293***
(7.26)
-1.294***
(-15.17)
0.183***
(2.68)
2.05***
(12.82)
0.312**
(1.95)
0.577***
(4.05)
KZ
Convars Control Control Control Control Control Control
Constant
9.958
(25.17)
-1.886
(-3.69)
19.984
(16.23)
8.056
(5.40)
1.844
(1.27)
2.016
(1.72)
Year YES YES YES YES YES YES
Industry YES YES YES YES YES YES
Firm NO NO YES NO NO NO
R2 0.29 0.09 0.11 0.27 0.52 0.53
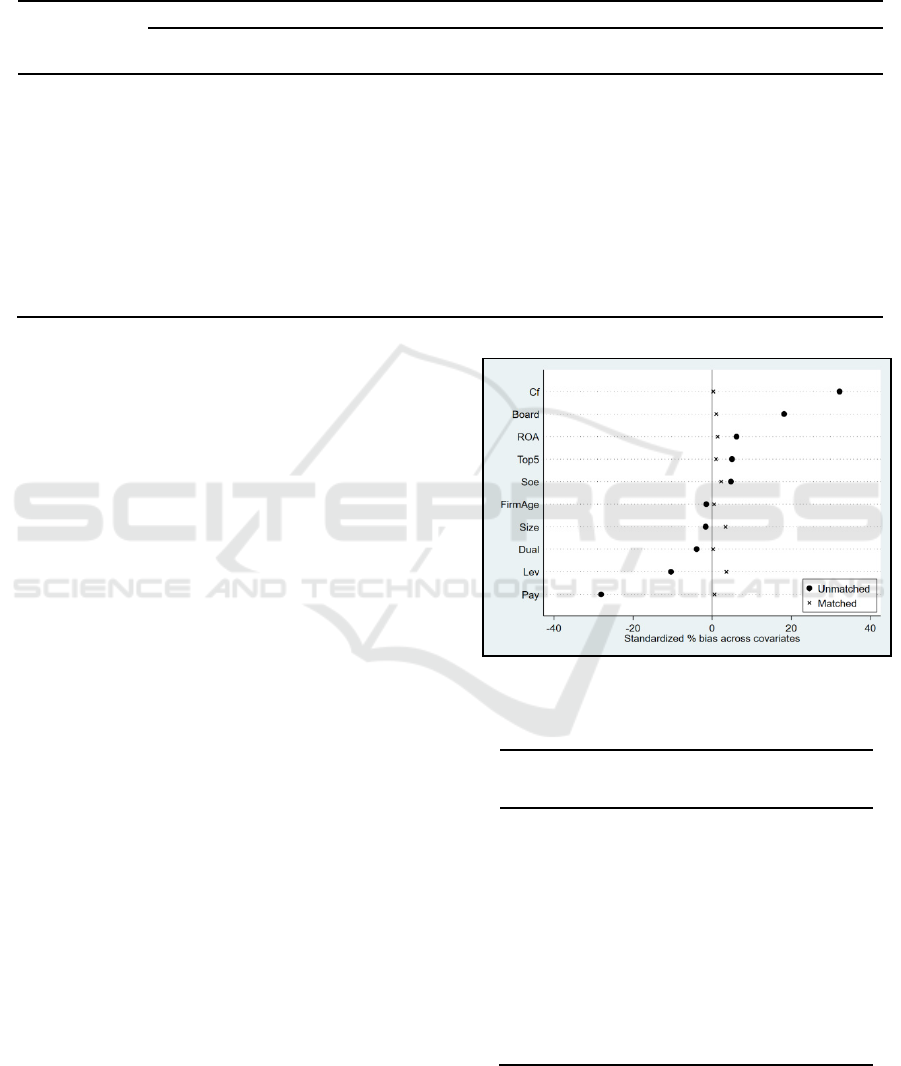
5.3 Propensity Score Matching(PSM)
In order to avoid the deviation of the results caused
by the possible problem of sample self selection, this
paper uses the propensity score matching method
(PSM) to perform 1:1 nearest neighbor matching on
the samples. Like the main regression, this paper
successively matches the control variables in the
PSM robustness test, including Size, ROA, Lev, Cf,
Top5, Dual, Pay, Board, Soe, FirmAge. The matching
process is shown in Fig.2. From the value and
comparison relationship of the specific statistics of
each variable before and after matching, it can be seen
that there are significant differences in each variable
before matching, and there is no significant
difference in the mean value of each variable after
matching. After the nearest neighbor matching of the
control variables, the double difference model is used
for regression estimation again. The regression
results of PSM-DID are shown in Table 7. The
empirical results of this paper are robust, and the
research conclusion is still valid.
Figure 2: Results before and after PSM matching.
Table 7: PSM-DID Inspection results.
(1) (2) (3)
VARIABLES
Strategy Strategy Strategy
Post×Treated
2.920*** 2.625*** 0.860***
(32.23) (28.90) (7.23)
Convars NO
YES YES
Constant
11.381*** 7.404*** 2.866***
(256.23) (8.49) (3.27)
Year NO NO YES
Industry NO NO YES
Observations
14,961 14,961 14,961
R-squared
0.065 0.103 0.567
BDEDM 2022 - The International Conference on Big Data Economy and Digital Management
272

6 CONCLUSION AND
ENLIGHTENMENT
At present, China is vigorously developing green
finance and promoting the green transformation of
key industries and important fields. The introduction
of green credit policy is of great significance to guide
heavy polluting enterprises to carry out strategic
transformation and realize green development as
soon as possible. Based on this, this paper takes the
formal implementation of the green credit guidelines
in 2012 as a quasi natural experiment, selects China's
A-share listed companies from 2006 to 2018 as a
research sample, constructs a PSM-DID model to
quantitatively evaluate the impact of green credit
policy on enterprise strategy and its action
mechanism. The study found that: First, after the
implementation of the green credit policy, the
strategic incentive progress of heavy polluting
enterprises has been significantly improved. After a
series of robustness tests such as replacing the
dependent variable, changing the estimation method
and changing the time interval, the conclusion is still
valid. Second, according to the intermediary effect
test, financing constraints play a significant
intermediary role in the impact of green credit on
enterprise strategic incentive progress. The green
credit policy intensifies the financing constraints of
heavy polluting enterprises, and then promotes the
strategy of heavy polluting enterprises from attack to
defense. Based on the above conclusions, the
empirical results of this paper have the following
enlightenment for the improvement and follow-up
implementation of green credit policy:
First, local governments should vigorously
implement the green credit policy to ensure that the
policy is implemented in place. The government and
commercial banks should give full play to the
financing punishment effect of green credit policy
and adjust the opportunity cost of environmental
pollution through credit channels, so as to promote
heavily polluting enterprises to increase clean
investment and reduce polluting investment.
Therefore, heavily polluting enterprises will have the
motivation to carry out green innovation and strategic
transformation. Second, local governments should
actively optimize the systems and regulations related
to green credit, establish an evaluation system for the
effect of policy implementation according to the
actual development of local enterprises, improve the
relevant institutional environment and ensure the
effect of policy implementation. Third, avoid "one
size fits all" green credit. Even if the empirical results
show that the green credit policy promotes the
heavily polluting enterprises to seek more radical
strategic transformation, the financing constraints
brought by the policy actually cause some obstacles
to the green transformation of enterprises. Enterprises
show more passive stress response, while active
strategic response is insufficient. Therefore, local
governments and banking institutions can provide
financial support for environmental protection
investment and green development for heavy
polluting enterprises in combination with the actual
situation, so as to better guide the green
transformation of heavy polluting enterprises and
stimulate the transformation power of enterprises.
REFERENCES
Allet M, Hudon M. Green Microfinance: Characteristics of
Microfinance Institutions Involved in Environmental
Management[J]. Journal of Business Ethics, 2015,
126(3):395-414.
Bentley, K. A., Omer, T. C., Sharp. N. Y. Business
Strategy, Financial Reporting Irregularities, and Audit
Effort. Contemporary Accounting Research, 2013,
30(2): 780-817.
Bertrand, M. How much should we trust differences-in-
differences estimates[J]. Risk Management and
Insurance Review,2004,119(1):173-199.
Chen Qi Has China's green credit policy been implemented
-- Based on the analysis of loan scale and cost of "two
high and one surplus" enterprises [J] Contemporary
finance and economics, 2019 (3): 118-129.
Chen Xingxing, Shi Yaya, song Xianzhong Green credit
constraints, commercial credit and corporate
environmental governance [J] International financial
research, 2019, (12): 13-22.
Fazzari S M, Petersen B C , Hubbard R G . Investment,
Financing Decisions, and Tax Policy[J]. Social Science
Electronic Publishing,1998,78(2):200-205.
Gayané Hovakimian. Financial constraints and investment
efficiency: Internal capital allocation across the
business cycle[J]. Journal of Financial Intermediation,
2011, 20(2):264-283.
Han Yanjin Enterprise strategic difference and executive
compensation -- new evidence from efficiency contract
theory [J] Scientific research management, 2021,42
(02): 181-189.
Higgins, D., Omer, T. C., Phillips, J. D. The Influence of a
Firm`s Business Strategy on Its Tax Aggressiveness.
Contemporary Accounting Research, 2015, 32(2): 674-
702.
Jiang Fuxiu, Shi Beibei, Ma Yunbiao Financial experience
of information publishers and corporate financing
constraints [J] Economic research, 2016,51 (06): 83-97.
Kaplan, S. N. and Luigi, Z., 1997, "Do Investment-Cash
Flow Sensitivities Provide Useful Measures of
Financing Constraints?", Quarterly Journal of
Economics, (1): 169-215.
Green Credit Policy and Enterprise Strategic Transformation: Empirical Test of Heavy Pollution Industry
273

Li Wenjing, Li Mangmang "Entity + finance": financing
constraints, policy catering or market competition——
Empirical research based on different property rights
[J] Financial research, 2017 (08): 100-116.
Liu X H, Wang E X, Cai D T. Green credit policy, property
rights and debt financing: Quasi-natural experimental
evidence from China[J]. Finance Research
Letters,2019,29:129-135.
Meng Qingbin, Li Xinyu, Zhang Xiuping Short selling
mechanism, capital market pressure and corporate
strategic choice [J] China industrial economy, 2019
(08): 155-173.
Miles, R. E., Snow. C. C. Organizational Strategy,
Structure and Process. New York: McGraw-Hill Press,
1978.
Miles, R. E., Snow. C. C. Organizational Strategy,
Structure, and Process. Stanford, CA: Stanford
University Press, 2003.
Shen Hongtao, Ma Zhengbiao Regional economic
development pressure, enterprise environmental
performance and debt financing [J] Financial research,
2014, (02): 153-166.
Su Dongwei, Lian Lili Does green credit affect the
investment and financing behavior of heavily polluting
enterprises? [J]. Financial research, 2018, (12): 123-
137.
Sun Jian, Wang Baiqiang, Cao Feng, Liu xiangqiang Does
corporate strategy affect earnings management? [J].
Management world, 2016 (03): 160-169 DOI:
10.19744/j.cnki. 11-1235/f.2016.03.013.
Wang Huacheng, Zhang Xiuping, Gao Shenghao Does
corporate strategy affect over investment [J] Nankai
management review, 2016,19 (04): 87-97 + 110.
Wang Liping, Xu Jiahui, Li Chuang Action mechanism and
stage evolution of green financial policy promoting
enterprise innovation [J] Soft science: 1-11.
Wang Xin, Wang Ying Research on green credit policy
promoting green innovation [J] Management world,
2021,37 (06): 173-188 + 11.
Wang Yanli, Lei Xiaodong, long Ruyin Does the green
credit policy improve the investment efficiency of
enterprises—— From the perspective of financial
resource allocation of heavily polluting enterprises [J]
China population, resources and environment, 2021,31
(01): 123-133.
Wang Yejing, Liu Yong, Shan Peng Research on the impact
of entrepreneurial orientation on enterprise strategic
focus [J] Scientific research: 1-16.
Wen Subin, Zhou Liuliu Influence mechanism of enterprise
carbon information disclosure on financial
performance -- the "inverted U" regulation of media
Governance [J] Management review, 2017,29 (11):
183-195.
Wen Zhonglin, ye Baojuan Intermediary effect analysis:
method and model development [J] Progress in
psychological science, 2014,22 (5): 731-745.
Wu chaopeng, Wu Shinong, Cheng Jingya, Wang Lu An
empirical study on the impact of venture capital on the
investment and financing behavior of Listed
Companies [J] Economic research, 2012,47 (01): 105-
119 + 160.
Xu Sheng, Zhao Xinxin, Yao Shuang Effect analysis of
green credit on industrial structure upgrading [J]
Journal of Shanghai University of Finance and
economics, 2018,20 (02): 59-72.
Zhan Hua How green credit affects enterprise
environmental information disclosure -- An Empirical
Test Based on listed enterprises in heavy pollution
industries [J] Nankai economic research, 2021, (03):
193-207.
Zhang Yanchao, sun Guangguo, Chen Siyang Industrial
policy, resource allocation and enterprise strategy [J]
Macroeconomic research, 2021 (06): 17-33 + 92.
Zhu Zhaohui, Tan Yafei Contract supervision and
investment efficiency of heavily polluting enterprises -
- a quasi natural experiment based on green credit
guidelines [J] East China economic management,
2020,34 (10): 74-86.
BDEDM 2022 - The International Conference on Big Data Economy and Digital Management
274
