
Different Metrics Results in Text Summarization Approaches
Marcello Barbella
a
, Michele Risi
b
, Genoveffa Tortora
c
and Alessia Auriemma Citarella
d
Department of Computer Science, University of Salerno, Fisciano (SA), Italy
Keywords:
Automatic Text Summarization Algorithms, Extractive, Abstractive, ROUGE, BLEU, METEOR.
Abstract:
Automatic Text Summarization is the result of more than 50 years of research. Several methods for creating a
summary from a single document or a group of related documents have been proposed over time, all of which
have shown very efficient results. Artificial intelligence has enabled advancement in generating summaries
that include other words compared to the original text. Instead, the issue is identifying how a summary may
be regarded as ideal compared to a reference summary, which is still a topic of research that is open to new
answers. How can the outcomes of the numerous new algorithms that appear year after year be assessed?
This research aims to see if the ROUGE metric, widely used in the literature to evaluate the results of Text
Summarization algorithms, helps deal with these new issues, mainly when the original reference dataset is
limited to a small field of interest. Furthermore, an in-depth experiment is conducted by comparing the results
of the ROUGE metric with other metrics. In conclusion, determining an appropriate metric to evaluate the
summaries produced by a machine is still a long way off.
1 INTRODUCTION
Nowadays, we observe a massive expansion of digital
material into textual form. This huge amount of data
(“infobesity”) allows the researchers to apply multi-
ple data mining and data analysis techniques to extract
information from it. In particular, with the growth of
the data available, machine learning and deep learn-
ing methodologies start to be the reference analysis
approach being able to use to look for correlation in
data, hidden pattern, syntactic and semantic analysis.
Extracting information from data is a significant
challenge (Aries et al., 2019) due to the computational
power required and the complexities that must be ad-
dressed.
Specifically, information extraction must preserve
semantic coherence: given the vast amount of data
available, the most fundamental challenge is to create
immediately understandable data summaries.
Text Summarization (TS) should provide a sim-
plified, concise, fluent and immediate comprehension
regarding data to the users, by preserving the most rel-
evant content from a source text and displaying it in a
compact form.
a
https://orcid.org/0000-0002-7973-4722
b
https://orcid.org/0000-0003-1114-3480
c
https://orcid.org/0000-0003-4765-8371
d
https://orcid.org/0000-0002-6525-0217
The purpose of Automatic Text Summarization
(ATS) strategies is to achieve this goal by develop-
ing algorithms designed to generate summaries that
contain all the relevant aspects of a topic. The length,
writing style, and grammar are the most relevant as-
pects to consider while generating a coherent sum-
mary
1
.
For humans, executing the summarization process
need to perform the cognitive process related to un-
derstanding the meaning of the text (Kucer, 1987). As
reported in the study, how humans perform this task
does not follow a unique way, even if we look at the
same people at a different time (Lin and Hovy, 2002).
The results show that summarization outcomes
can differ significantly even among the same people.
This concept is critical because many questions re-
main unanswered, although ATS has taken advantage
of cutting-edge technologies like information retrieval
and extraction (El-Kassas et al., 2021a), Natural Lan-
guage Processing (NLP) (Haque et al., 2013) and ma-
chine learning (Patel et al., 2018).
Therefore, understanding how to evaluate the
summarization quality could be considered one of the
most critical tasks for the text summarization prob-
lem. Furthermore, it is possible to investigate the TS
evaluation issue by performing experiments designed
1
http://www.hunter.cuny.edu/rwc/handouts/the-writing-
process-1/invention/Guidelines-for-Writing-a-Summary
Barbella, M., Risi, M., Tortora, G. and Auriemma Citarella, A.
Different Metrics Results in Text Summarization Approaches.
DOI: 10.5220/0011144000003269
In Proceedings of the 11th International Conference on Data Science, Technology and Applications (DATA 2022), pages 31-39
ISBN: 978-989-758-583-8; ISSN: 2184-285X
Copyright
c
2022 by SCITEPRESS – Science and Technology Publications, Lda. All rights reserved
31
to answer multiple research questions. In particular:
• How can we evaluate objectively whether one
summary is better than another?
• Is there a best-practice summary for any docu-
ment written according to specific standards?
• What are the criteria for determining this level of
quality?
In this contribution, we reported the results of our ex-
perimentation on the ROUGE metric. We aim to un-
derstand how it performs in evaluating summarization
output. Additionally, we use METEOR and BLUE as
other comparison metrics. Also, this research is car-
ried out by following the steps outlined in (Barbella.
et al., 2021), taking into account all the variables and
limitations that were employed. In this paper, we have
deepened the obtained results in our previous work
using additional datasets and reducing the focus to
narrow interest fields. The paper is organized as fol-
lows. Section 2 presents a complete overview of the
various ATS types of approach and evaluation met-
rics. Section 3 analyzes the current state of the art,
focusing on some of the most recent summarization
techniques. Then, the proposed approach is described
in Section 4 whilst in Section 5 the experimentation
is explained. Section 6 discusses the analysis of the
results, and finally, Section 7 concludes the work and
offers some suggestions for future research.
Figure 1: Text Summarization approaches.
2 BACKGROUND
2.1 Text Summarization Approaches
TS can be used for a variety of purposes: determin-
ing the topic of a text (Sarkar and Bandyopadhyay,
2005; Lawrie et al., 2001), and extracting a sum-
mary in a general context (Allahyari et al., 2017).
As the third hypothesis, the purpose could be to gen-
erate a summary based on a single user’s specific
queries entered into a search engine (Kumar, 2021;
Afsharizadeh et al., 2018).
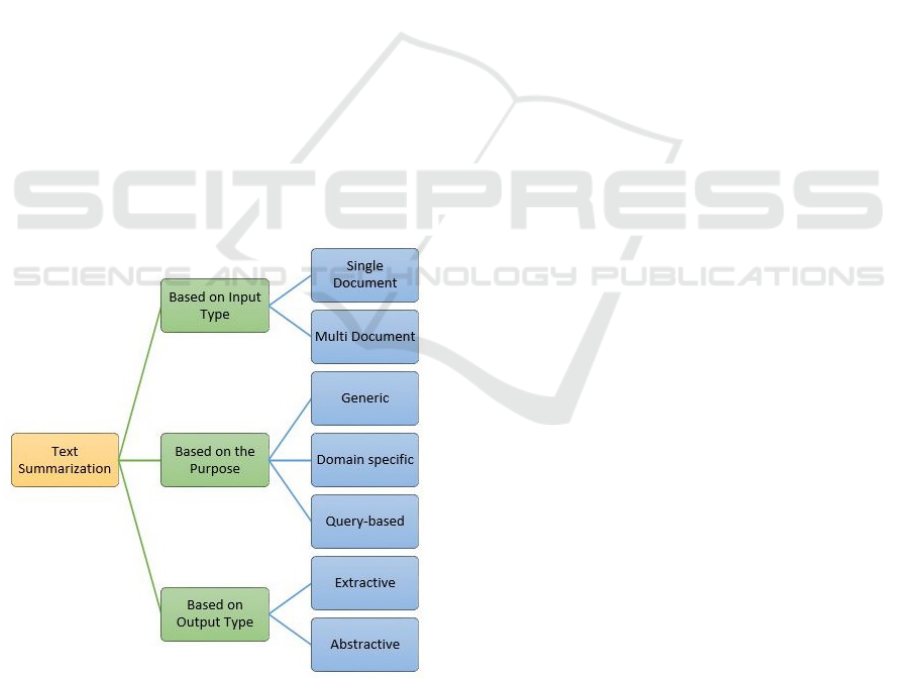
Over time, different summarization approaches
have been established based on various concepts and
applied to different contexts. They consider both
technical elements in the generating method and
choices imposed by the application domain. These
categories are classified based on the type of input,
purpose and output (see Figure 1).
The type of input can be single or multiple: the
first is related to the summary generation from a sin-
gle document, while the second is for summarizing
multiple documents, often on the same topic. The
challenge of multiple document TS emerges mainly
when information must be extracted from the web.
In this scenario, a single summary is generated from
documents connected by one or more hypertext links.
A hypertext link is a unidirectional reference inserted
in an electronic document.
Finally, the majority of existing techniques can be
divided into two broad categories, extractive and ab-
stractive (Verma and Verma, 2020).
In the Extractive Automatic Text Summarization
(EATS) approaches, a score is assigned to each phrase
or paragraph from the source text based on criteria;
then, the EATS approaches generate a summary by
selecting each of them. The Abstractive Automatic
Text Summarization (AATS) approaches instead use
artificial intelligence techniques: the input is para-
phrased to provide a summary with words and, in
some cases, entire sentences that differ from the orig-
inal text (Kry
´
sci
´
nski et al., 2019).
2.2 Evaluation of Summaries
The quality of the summary can be evaluated using
one of the various metrics that compare a machine-
generated summary, called system summary (Sys-
Sum), to one considered optimal called reference
summary or gold standard (Ref-Sum), based on a set
of different criteria. In order to “objectively” evaluate
how good the TS algorithm output is, several metrics
and approaches were proposed. They considered dif-
ferent aspects of the summarization output. Surely,
DATA 2022 - 11th International Conference on Data Science, Technology and Applications
32

exposing the output to an expert of the field regarding
the text can provide a complete quality score.
ROUGE (Recall Oriented Understudy for Gisting
Evaluation) is one of the metrics used in the literature
for the Text Summarization challenge (Lin, 2004),
and it is based on the overlapping of n-grams between
a Sys-Sum and a Ref-Sum.
In addition, there are several other metrics.
BLEU (Papineni et al., 2002) and METEOR (Baner-
jee and Lavie, 2005) born for the examination of
translations, but that are well suited to the evalua-
tion of summaries generated by a machine. Pyra-
mid (Nenkova and Passonneau, 2004) is based on
simple context units. SSAS (Vadapalli et al., 2017)
focuses on semantic correlations between texts. LSA-
based evaluation measures (Steinberger et al., 2009)
and a variety of additional methods.
3 RELATED WORK
It is essential to remember Luhn’s study from
1958 (Luhn, 1958) when working in the ATS field.
It concentrated on the development of summaries for
scientific papers of various journals. This research
established the way for all later research, providing
valuable insight into how to develop algorithms for
the automatic generation of summaries.
The intuition was that some words in a document
describe the content of the document itself and that
sentences in which these words are very close to one
another are more indicative of the document’s mean-
ing.
The two primary categories for developing algo-
rithms for ATS are extractive and abstractive tech-
niques (Mahajani et al., 2019; Nazari and Mahdavi,
2019). At the foundation of the EATS algorithms is
what Luhn stated: assigning a relevance index to the
sentences in a document, then selecting those with
a higher score and combining them as a summary.
These methods have taken several directions based on
clustering, neural networks, and graphs.
One of the most recent studies proposed in (Al-
guliyev et al., 2019) for a TS task is COSUM, a two-
stage phrase selection model based on clustering and
optimization methodologies. The first stage in find-
ing all the arguments in a text is to use the k-means
algorithm to group the phrases. In the second phase,
an optimization approach is developed for picking the
most significant sentences from the clusters, to gener-
ate the final summary.
Also, Neural networks are often used for the
ATS task. (Sharma et al., 2020) presents a new
model that combines the Restricted Boltzmann Ma-
chine (RBM) (Rezaei et al., 2019) with fuzzy logic
approaches. These processes have different methods
for delivering precision to a summary, but being a
part of the unsupervised world together, has outper-
formed their efforts to summarize the text. Compared
to RBM, the built-in algorithm gives a better represen-
tation in probability modelling on visible and hidden
units.
Graph-based approaches, such as Google’s
PageRank (Dixit et al., 2019), have made significant
progress in obtaining information on the structure
of the Web. For the summarization task, these have
been changed. They approach the document from
the perspective of a graph, with nodes represent-
ing sentences and arcs representing the degree of
similarity between them, depending on particular
criteria. LexRank (Erkan and Radev, 2004) and
TextRank (Mihalcea and Tarau, 2004) are two of the
algorithms employed.
New methods of creating a summary, known as
abstractive techniques, have emerged as a result of
the development of artificial intelligence, in which the
generated text is a reworked version of the original
document with new words and concepts compared to
the original text (Lin and Ng, 2019). Several ways
have been proposed, most of which are based on the
seq2seq model and the attention mechanism (Vaswani
et al., 2017).
Various NLP tasks, including the TS task, have
been effectively applied to Seq2seq models. In (Nal-
lapati et al., 2016), AATS is examined using a model
based on recurrent encoder-decoder neural networks,
as well as various new models that solve crucial chal-
lenges in summarization tasks such as word mod-
elling key and acquisition of the phrase-word hier-
archy. Moreover, the authors in (See et al., 2017)
propose a novel architecture to improves the typi-
cal sequence-to-sequence attentional system, outper-
forming the existing abstractive state-of-the-art.
4 RESEARCH METHODOLOGY
The framework of this study activity is represented in
the chart in Figure 2, which includes the different text
summarization algorithms involved, the datasets used
to generate the final results, and the evaluation metrics
that we compared throughout the experiment.
Seven text summarization algorithms were inves-
tigated (El-Kassas et al., 2021b), involving four ex-
tractive (textrank, lsa, luhn and lexrank) and three
abstractive (word2vec, doc2vec and glove), following
the approach reported in (Barbella. et al., 2021) to
verify if the previous results obtained are also valid in
Different Metrics Results in Text Summarization Approaches
33
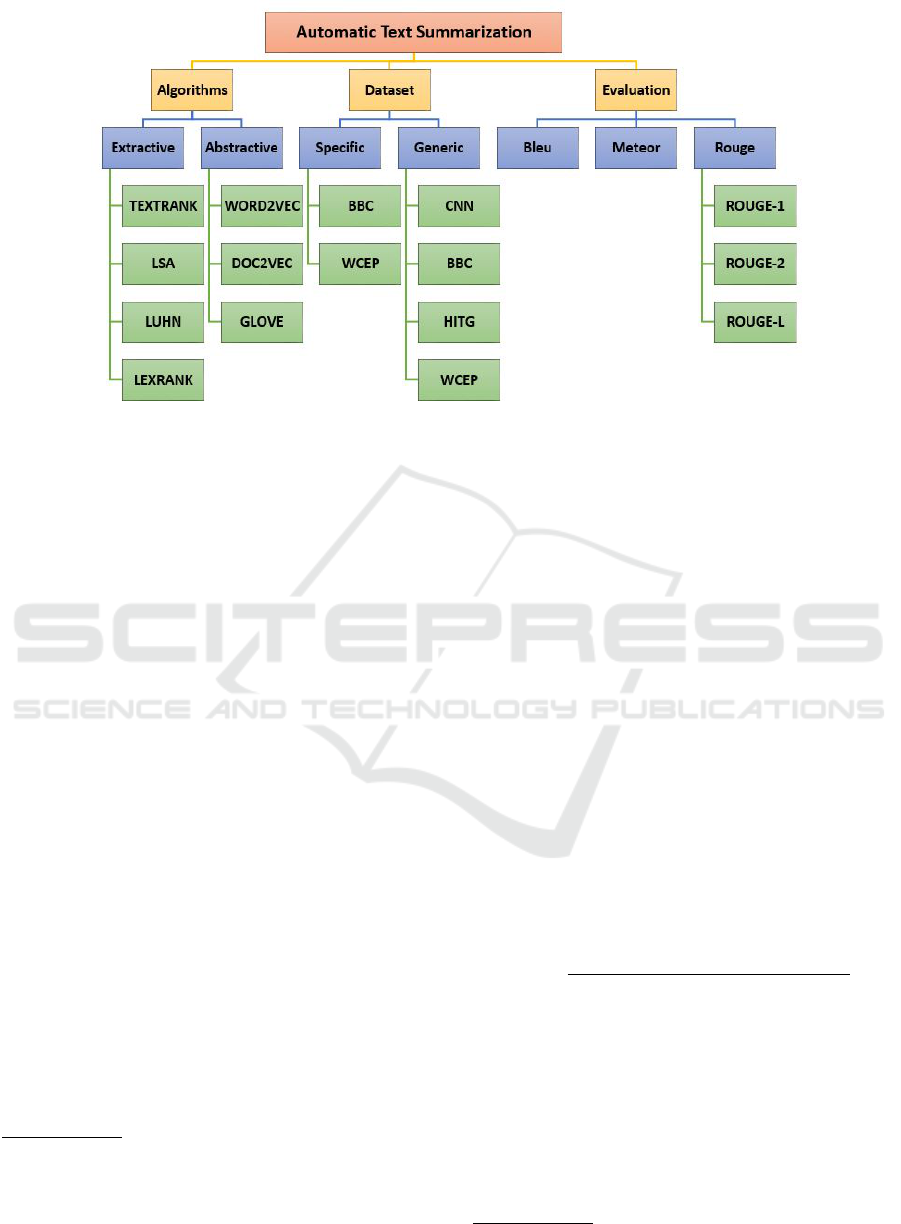
Figure 2: Research study framework.
other scenarios.
4.1 Dataset
All of the experiments were done on four different
datasets:
• CNN/Daily Mail, which consists of CNN and
Daily Mail articles and editorial news. This
dataset, which was first introduced for Abstrac-
tive Summarization, has roughly 287.000 articles,
including summaries, and is one of the most fre-
quently utilized datasets for ATS algorithm evalu-
ation (Nallapati et al., 2016);
• BBC News, used often for extractive text sum-
marization. It contains documents from the BBC
news website that correspond to articles in five
thematic areas from 2004 to 2005 (Greene and
Cunningham, 2006);
• HITG summaries dataset
2
contains about
100.000 texts, each of which includes various
information in addition to the articles and a brief
description
3
;
• WCEP contains a multi-document summary
dataset from Wikipedia’s Current Events Por-
tal (Gholipour Ghalandari et al., 2020). Each
summary consists of short, human-written sum-
maries of news events, each matched with a col-
lection of news items related to the event
4
.
2
https://www.kaggle.com/sunnysai12345/news-summary
3
Only news articles from Hindu, Indian Times, and
Guardian were scraped and the summarized news from In-
shorts. The time period changes from February to August
2017.
4
These articles are made up of sources referenced by WCEP
4.2 Evaluation Metrics
This research study considers three evaluation met-
rics: ROUGE, BLEU, and METEOR. Here are some
specifics on what they try to assess for the TS task.
4.2.1 ROUGE
When we talk about the ROUGE metric, we refer to a
collection of multiple sub-metrics and not to a single
one. Specifically, it is based on the overlapping of
ngrams between a Sys-Sum and a Ref-Sum.
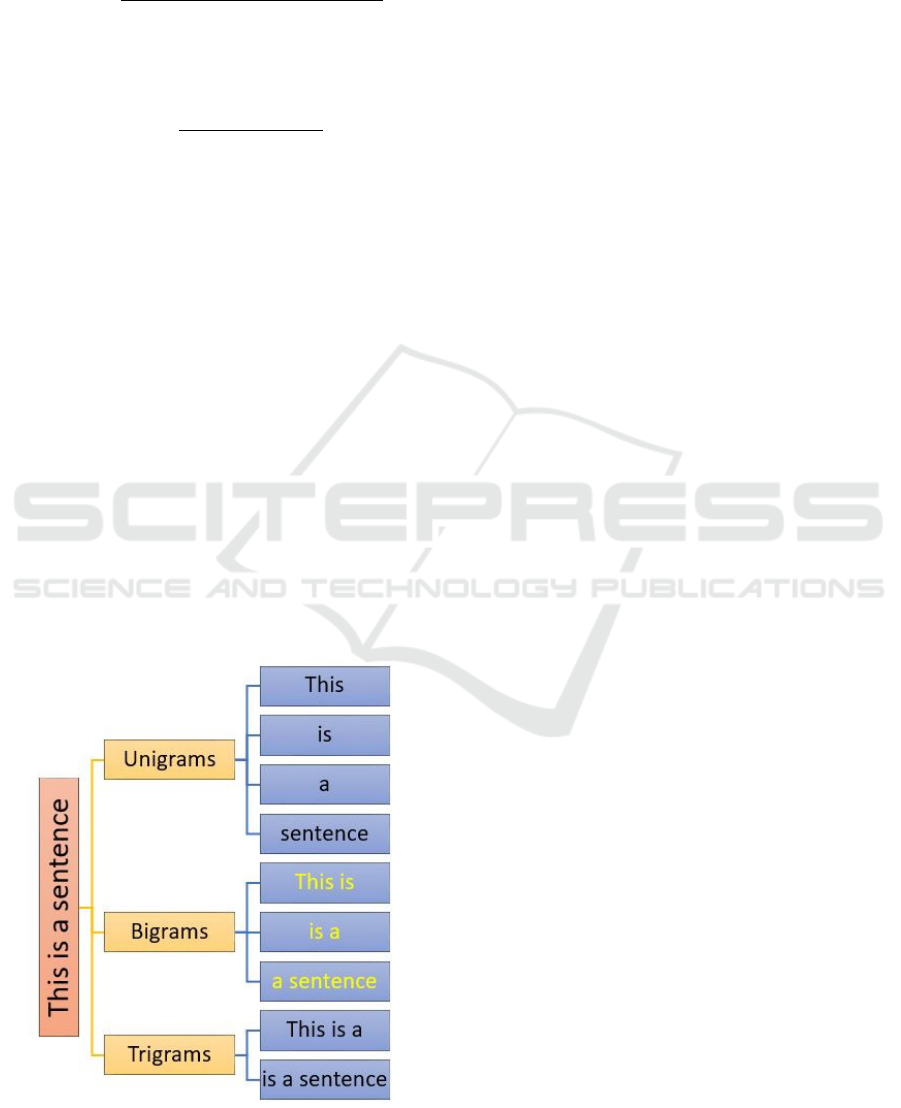
In detail, ROUGE-n counts the number of n-
grams that matches the machine-generated text and
a reference one (where an n-gram is just a group of
tokens or words). Based on n, it is possible to have
unigrams composed of a single word, bigrams (two
words), trigrams (three words) and so on (see Fig-
ure 3). For each n-gram, it can be computed the
ROUGE recall, precision or F1-score. Precision is
defined in Equation 1 as:
recall =
num of overlapping n-grams
num of reference summary n-grams
(1)
The recall tries to measure how many n-grams
in the reference summary have been captured by the
summarization output.
It is important to note that a machine-generated
summary can be quite long due to redundancy. A hu-
man can easily remove redundant parts from a text.
Instead, automatic tools could contain too many terms
of the reference text, making the summary exces-
sively long. Therefore precision, try to capture how
editors and articles pulled automatically from the Common
Crawl News dataset.
DATA 2022 - 11th International Conference on Data Science, Technology and Applications
34
brief the system summary is and how it avoids using
unnecessary words in its corpus. It is defined as fol-
lows (Equation 2):
precision =
num of overlapping n-grams
num of system summary n-grams
(2)
Finally, the F1-score can be used to combine
precision and recall to quantify this measure’s accu-
racy. It is calculated as follows (Equation 3):
F1 = 2 ∗
precision ∗ recall
precision + recall
(3)
In our experimentation, summaries are obliged to
be concise due to the limited number of words or pre-
fixed phrases and the limited length of the reference
summaries. Therefore, we focused only on the recall
evaluation due to the short summarization output. In
particular, in this study, we have considered:
• the ROUGE-1 (based on the overlapping of uni-
grams between the system summary and the ref-
erence one)
• the ROUGE-2 (based on the overlapping of bi-
grams between the system summary and the ref-
erence one)
• and ROUGE-L (measures the longest common
word sequence, computed by the Longest Com-
mon Subsequence algorithm).
4.2.2 BLEU
BLEU stands for Bilingual evaluation understudy and
compares how many n-grams in a Sys-Sum are dis-
covered in the Ref-Sum. BLEU ranges from 0 to 1,
Figure 3: N-Grams in a sentence.
and it is closer to 1 the more the generated text is sim-
ilar to the reference summary.
Furthermore, BLEU does not consider the posi-
tion of the generated words when assigning a score,
resulting in a value that is different from that of its
cancellation or replacement. Then, we can calculate
the overall quality of the summary by taking into ac-
count the average of all the scores. One of the most
severe issues with BLEU is that it is unaware of para-
phrases or synonyms.
BLEU can be similar to the ROUGE-n precision
but is not equivalent because BLEU includes a brevity
penalty term and computes the n-gram match for a
set of n-gram sizes (instead, the ROUGE-n considers
only a single chosen n-gram size).
4.2.3 METEOR
METEOR is the acronym of Metric for Evaluation
of Translation with Explicit Ordering, and is an au-
tomatic metric for machine translation evaluations. It
is also used for the TS task for its intrinsic features.
In this case, it can be seen as an analytic metric
for evaluating system summaries, based on a gener-
alized concept of unigram correspondence between
machine-generated text and human-generated refer-
ence.
Unigrams can be combined using their primary
and derivative forms and meanings. METEOR cal-
culates a score for this mix using a combination of
unigram-precision, unigram-recall, and a fragmenta-
tion measure. This calculation is planned to directly
highlight how well-ordered the words in the system
summary are concerning the reference one, once all
generalized unigram matches between the two texts
to be compared are found. The assigned scores vary
in a range of 0 to 1.
5 EXPERIMENTS
The initial step in the experimental process is plan-
ning. The goals that we intend to achieve are de-
scribed clearly here, and they guarantee that key com-
ponents of the experiment are defined before planning
the execution. The two research questions are:
• RQ1: How different is the ROUGE score obtained
by the EATS approaches compared to the AATS
ones, when it is restricted the starting dataset for
the different algorithms to a narrow interest field
against a general interest field?
Object of study is the ROUGE score obtained for
the different starting datasets for all algorithms.
Different Metrics Results in Text Summarization Approaches
35

The purpose is to confirm the unsuitability and ef-
ficiency of this metric also for these restrictions.
• RQ2: Are the various evaluation metrics BLEU,
METEOR, and ROUGE capable of comparing the
different algorithms to determine a clear distinc-
tion between the extractive and abstractive ap-
proaches?
Object of study are the different scores of the three
metrics for the different datasets taken into ac-
count. The purpose is to demonstrate that no one
of these metrics efficiently evaluates the different
EATS and AATS approaches.
The goal of the experiment is to compare the validity
and accuracy of the ROUGE metric (from a research
point of view) of two types of approaches (EATS and
AATS) in order to highlight the inefficiency of this
metric by also comparing the results to two other met-
rics widely used in the literature for the evaluation of
TS algorithms.
When experimenting, the subject selection is cru-
cial. It is closely related to the generalization of the
experiment’s results. For this purpose, the popula-
tion must be represented in the choice. Probabilis-
tic and non-probabilistic approaches can be used for
sampling.
The subject sampling in our trials, both for RQ1
and RQ2, follows the Simple Random Sampling
paradigm. Since the subjects are picked at random
from a population list, the texts to be summarized are
randomly chosen from the reference datasets, and the
results of distinct samples are merged in our scenario.
We investigated two distinct datasets grouped into
different subjects for the RQ1 and all of the general
topics. We have chosen:
• for the BBC dataset we ran 300 blocks of 200 text
each one;
• for the WCEP dataset we ran 300 blocks of 120
text each one.
For RQ2, on the other hand, we have chosen:
• for the BBC dataset we ran 300 blocks of 200 text
each one;
• for the CNN dataset we ran 300 blocks of 200 text
each one;
• for the HITG dataset we ran 300 blocks of 1000
text each one;
• for the WCEP dataset we ran 300 blocks of 120
text each one;
The various chunk sizes are determined by the assur-
ance that they are representative of the entire popu-
lation, as well as the size of the datasets, computing
complexity, and time required to run the experiment.
Table 1: Rouge-1 results for BBC dataset.
BUSINESS ENTERT. POLITICS SPORT TECH ALL
Extractive 0,268 0,282 0,290 0,369 0,265 0,298
Abstractive 0,275 0,283 0,285 0,339 0,259 0,291Rouge-1
Differences 0,007 0,001 0,005 0,030 0,006 0,007
Extractive 0,192 0,207 0,207 0,280 0,181 0,217
Abstractive 0,194 0,204 0,198 0,239 0,172 0,203Rouge-2
Differences 0,002 0,003 0,009 0,041 0,009 0,014
Extractive 0,264 0,277 0,285 0,363 0,259 0,293
Abstractive 0,271 0,279 0,278 0,331 0,253 0,285Rouge-l
Differences 0,007 0,002 0,007 0,032 0,006 0,008
Table 2: Rouge-1 results for WCEP dataset.
ART BUSINESS DISASTERS . . . WAR ALL
Extractive 0,235 0,224 0,243 .. . 0,259 0,240
Abstractive 0,232 0,232 0,238 .. . 0,254 0,238Rouge-1
Differences 0,003 0,008 0,005 .. . 0,005 0,002
Extractive 0,053 0,045 0,055 .. . 0,058 0,052
Abstractive 0,049 0,044 0,050 .. . 0,053 0,048Rouge-2
Differences 0,004 0,001 0,005 .. . 0,005 0,004
Extractive 0,194 0,186 0,198 .. . 0,209 0,195
Abstractive 0,191 0,192 0,192 .. . 0,205 0,192Rouge-l
Differences 0,003 0,006 0,006 .. . 0,004 0,003
A significant amount of tests required many days to
be completed.
6 RESULTS
6.1 RQ1 Results
In Tables 1-2 the results from the first and second
datasets (only for Rouge-1) are shown. The results
from the generic dataset are highlighted in the last col-
umn.
In the previous columns, the results of reducing
the various samples to texts relevant to a narrow sub-
ject of interest are provided.
The findings show that, even by restricting the
datasets to the topic of the same field of interest (first
columns of the tables), the scores of the algorithms
are equivalent to those in which the topics are not dis-
tinct (last column of the tables).
Consequently, we can observe how the results ob-
tained in (Barbella. et al., 2021) are confirmed and
so independent from the restriction to single topics of
the datasets.
In addition, the scores of the AATS and EATS, on
average, are not very dissimilar. As a result, ROUGE
is an inadequate evaluation metric.
6.2 RQ2 Results
The second experiment examined three separate met-
rics across four massive datasets. The goal was to
calculate the average of these metrics’ scores for each
of the algorithms under consideration to see if one
of them could separate extractive algorithms from ab-
stractive ones (evaluating the average of the scores for
the two categories).
DATA 2022 - 11th International Conference on Data Science, Technology and Applications
36
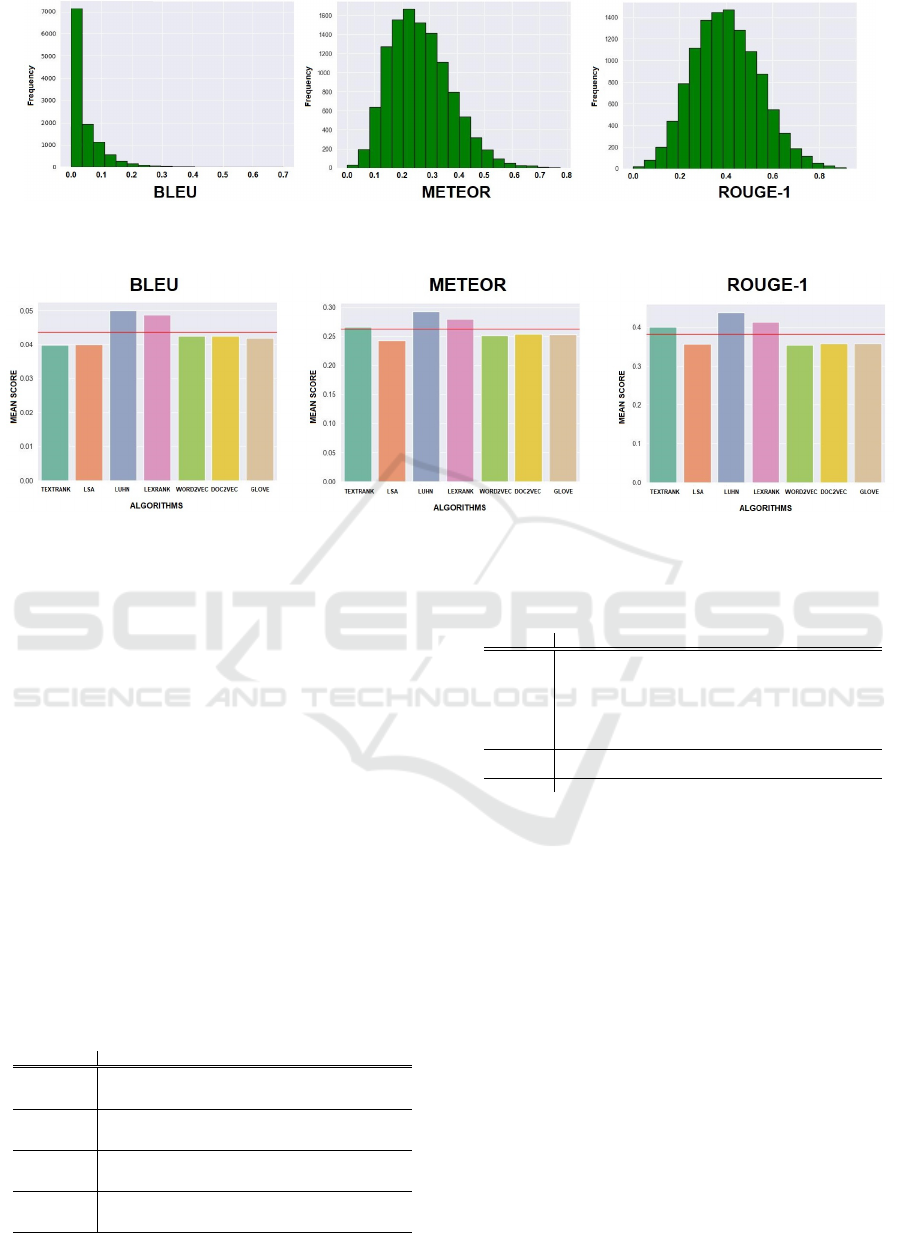
Figure 4: Histograms showing the CNN Daily-Mail Dataset scores distribution for BLEU, METEOR and ROUGE-1 using
the TextRank algorithm.
Figure 5: Mean average scores on CNN Daily-mail dataset for Abstractive and Extractive algorithms for BLEU, METEOR
and ROUGE-1 metrics.
Table 3 shows the results approximated to the third
decimal place, as well as the differences between the
two average scores for each metric and each category
of algorithms.
The distribution of scores for one of the extractive
algorithms, the text rank, for the metrics covered in
the research, may be seen in Figure 4 by three rep-
resentative histograms (for ROUGE it is shown only
the ROUGE-1 distribution, for simplicity of view). It
can be seen that the scores of METEOR and ROUGE
approximate quite well the normal distribution.
Specific details for one of the datasets used, the
CNN Daily-mail dataset, are shown in Table 4.
A graphic representation of the comparison of all
the scores of the various algorithms for this dataset,
is shown in Figure 5, with a red line representing the
average of the scores.
We can observe that these metrics are not able to
Table 3: Results summary for all datasets.
BLEU METEOR ROUGE-1 ROUGE-2 ROUGE-L
Ext 0,103 0,222 0,298 0,217 0,293
Abs 0,090 0,218 0,291 0,203 0,285BBC
Diff 0,013 0,004 0,007 0,014 0,008
Ext 0,044 0,270 0,402 0,142 0,367
Abs 0,043 0,253 0,357 0,117 0,322CNN
Diff 0,001 0,017 0,045 0,025 0,045
Ext 0,017 0,306 0,399 0,147 0,347
Abs 0,015 0,299 0,395 0,142 0,342HITG
Diff 0,002 0,007 0,004 0,005 0,005
Ext 0,009 0,167 0,241 0,053 0,196
Abs 0,008 0,164 0,238 0,048 0,192WCEP
Diff 0,001 0,003 0,003 0,005 0,004
Table 4: Comparison of metrics mean for the CNN Daily-
mail dataset.
algorithm BLEU METEOR ROUGE-1 ROUGE-2 ROUGE-L
textrank 0,040 0,267 0,400 0,136 0,365
lsa 0,040 0,243 0,356 0,111 0,326
luhn 0,050 0,293 0,438 0,169 0,401
lexrank 0,049 0,279 0,414 0,151 0,378
word2vec 0,043 0,251 0,354 0,116 0,320
doc2vec 0,043 0,254 0,358 0,118 0,324
glove 0,042 0,253 0,358 0,117 0,323
Extractive 0,044 0,270 0,402 0,142 0,367
Abstractive 0,043 0,253 0,357 0,117 0,322
Difference 0,001 0,017 0,045 0,025 0,045
distinguish well between extractive and abstractive al-
gorithms. As we can see, the average results are very
close to each other (in the order of hundredths of the
unit). This confirms that none of these three met-
rics can be considered suitable in evaluating the sum-
maries generated by the various algorithms.
7 CONCLUSIONS AND FUTURE
WORK
The primary goal of this research was to confirm that
the ROUGE evaluation metric for text ATS algorithms
is inefficient, even when the dataset’s field of interest
is narrowed, and that there is still no efficient metric
for evaluating summaries generated automatically.
The ROUGE metric is the most generally used
technique in the literature for evaluating a summary,
and it compares a system-generated summary to one
Different Metrics Results in Text Summarization Approaches
37

created by a human. The final score is determined by
counting how many n-grams overlap between the two
texts. However, a high score does not imply that the
summary is of high quality, especially when readabil-
ity and syntactic accuracy are taken into account.
Extractive algorithms, which are created using
portions of the original text, should perform better
than abstractive ones due to how this evaluation mea-
sure is formed. This served as the foundation for
our in-depth investigation, formulating two research
questions that validated the basic theory.
Even when the field of interest of a dataset is re-
duced, the ROUGE score produces extremely com-
parable results for both techniques, suggesting that
ROUGE is inefficient for judging the quality of a sum-
mary.
However, the second research question reveals
that there is currently no effective metric for evalu-
ating automatically generated summaries, indicating
that this is still an open field of research.
Future research directions could be in attempting
to identify exact features that can allow objective eval-
uation of a summary, taking into account the syntax
and the semantics of the phrases, such as how much
the summary created can include the original text’s
important concepts.
REFERENCES
Afsharizadeh, M., Ebrahimpour-Komleh, H., and Bagheri,
A. (2018). Query-oriented text summarization us-
ing sentence extraction technique. In 2018 4th inter-
national conference on web research (ICWR), pages
128–132. IEEE.
Alguliyev, R. M., Aliguliyev, R. M., Isazade, N. R., Abdi,
A., and Idris, N. (2019). Cosum: Text summarization
based on clustering and optimization. Expert Systems,
36(1):e12340.
Allahyari, M., Pouriyeh, S., Assefi, M., Safaei, S., Trippe,
E. D., Gutierrez, J. B., and Kochut, K. (2017). Text
summarization techniques: a brief survey. arXiv
preprint arXiv:1707.02268.
Aries, A., Hidouci, W. K., et al. (2019). Automatic text
summarization: What has been done and what has to
be done. arXiv preprint arXiv:1904.00688.
Banerjee, S. and Lavie, A. (2005). Meteor: An automatic
metric for mt evaluation with improved correlation
with human judgments. In Proceedings of the acl
workshop on intrinsic and extrinsic evaluation mea-
sures for machine translation and/or summarization,
pages 65–72.
Barbella., M., Risi., M., and Tortora., G. (2021). A com-
parison of methods for the evaluation of text summa-
rization techniques. In Proceedings of the 10th In-
ternational Conference on Data Science, Technology
and Applications - DATA,, pages 200–207. INSTICC,
SciTePress.
Dixit, A., Rathore, V. S., and Sehgal, A. (2019). Im-
proved google page rank algorithm. In Emerging
trends in expert applications and security, pages 535–
540. Springer.
El-Kassas, W. S., Salama, C. R., Rafea, A. A., and Mo-
hamed, H. K. (2021a). Automatic text summarization:
A comprehensive survey. Expert Systems with Appli-
cations, 165:113679.
El-Kassas, W. S., Salama, C. R., Rafea, A. A., and Mo-
hamed, H. K. (2021b). Automatic text summarization:
A comprehensive survey. Expert Systems with Appli-
cations, 165:113679.
Erkan, G. and Radev, D. R. (2004). Lexrank: Graph-
based lexical centrality as salience in text summa-
rization. Journal of artificial intelligence research,
22:457–479.
Gholipour Ghalandari, D., Hokamp, C., Pham, N. T.,
Glover, J., and Ifrim, G. (2020). A large-scale multi-
document summarization dataset from the Wikipedia
current events portal. In Proceedings of the 58th An-
nual Meeting of the Association for Computational
Linguistics, pages 1302–1308.
Greene, D. and Cunningham, P. (2006). Practical solutions
to the problem of diagonal dominance in kernel doc-
ument clustering. In Proceedings of the 23rd inter-
national conference on Machine learning, pages 377–
384.
Haque, M. M., Pervin, S., and Begum, Z. (2013). Literature
review of automatic single document text summariza-
tion using nlp. International Journal of Innovation
and Applied Studies, 3(3):857–865.
Kry
´
sci
´
nski, W., McCann, B., Xiong, C., and Socher,
R. (2019). Evaluating the factual consistency
of abstractive text summarization. arXiv preprint
arXiv:1910.12840.
Kucer, S. (1987). The cognitive base of reading and writing.
The dynamics of language learning, pages 27–51.
Kumar, K. (2021). Text query based summarized
event searching interface system using deep learn-
ing over cloud. Multimedia Tools and Applications,
80(7):11079–11094.
Lawrie, D., Croft, W. B., and Rosenberg, A. (2001). Finding
topic words for hierarchical summarization. In Pro-
ceedings of the 24th annual international ACM SIGIR
conference on Research and development in informa-
tion retrieval, pages 349–357.
Lin, C.-Y. (2004). Rouge: A package for automatic evalu-
ation of summaries. In Text summarization branches
out, pages 74–81.
Lin, C.-Y. and Hovy, E. H. (2002). Manual and automatic
evaluation of summaries. In ACL 2002.
Lin, H. and Ng, V. (2019). Abstractive summarization:
A survey of the state of the art. In Proceedings of
the AAAI Conference on Artificial Intelligence, vol-
ume 33, pages 9815–9822.
Luhn, H. P. (1958). The automatic creation of literature
abstracts. IBM Journal of research and development,
2(2):159–165.
DATA 2022 - 11th International Conference on Data Science, Technology and Applications
38

Mahajani, A., Pandya, V., Maria, I., and Sharma, D. (2019).
A comprehensive survey on extractive and abstractive
techniques for text summarization. Ambient commu-
nications and computer systems, pages 339–351.
Mihalcea, R. and Tarau, P. (2004). Textrank: Bringing or-
der into text. In Proceedings of the 2004 conference
on empirical methods in natural language processing,
pages 404–411.
Nallapati, R., Zhou, B., Gulcehre, C., Xiang, B.,
et al. (2016). Abstractive text summarization us-
ing sequence-to-sequence rnns and beyond. arXiv
preprint arXiv:1602.06023.
Nazari, N. and Mahdavi, M. (2019). A survey on automatic
text summarization. Journal of AI and Data Mining,
7(1):121–135.
Nenkova, A. and Passonneau, R. J. (2004). Evaluating con-
tent selection in summarization: The pyramid method.
In Proceedings of the human language technology
conference of the north american chapter of the asso-
ciation for computational linguistics: Hlt-naacl 2004,
pages 145–152.
Papineni, K., Roukos, S., Ward, T., and Zhu, W.-J. (2002).
Bleu: a method for automatic evaluation of machine
translation. In Proceedings of the 40th annual meet-
ing of the Association for Computational Linguistics,
pages 311–318.
Patel, M., Chokshi, A., Vyas, S., and Maurya, K. (2018).
Machine learning approach for automatic text summa-
rization using neural networks. International Journal
of Advanced Research in Computer and Communica-
tion Engineering, 7(1).
Rezaei, A., Dami, S., and Daneshjoo, P. (2019). Multi-
document extractive text summarization via deep
learning approach. In 5th Conf. on Knowledge Based
Engineering and Innovation (KBEI), pages 680–685.
IEEE.
Sarkar, K. and Bandyopadhyay, S. (2005). Generating head-
line summary from a document set. In International
Conference on Intelligent Text Processing and Com-
putational Linguistics, pages 649–652. Springer.
See, A., Liu, P. J., and Manning, C. D. (2017). Get to
the point: Summarization with pointer-generator net-
works. arXiv preprint arXiv:1704.04368.
Sharma, B., Tomer, M., and Kriti, K. (2020). Extractive text
summarization using f-rbm. Journal of Statistics and
Management Systems, 23(6):1093–1104.
Steinberger, J. et al. (2009). Evaluation measures for
text summarization. Computing and Informatics,
28(2):251–275.
Vadapalli, R., Kurisinkel, L. J., Gupta, M., and Varma,
V. (2017). Ssas: semantic similarity for abstractive
summarization. In Proceedings of the Eighth Inter-
national Joint Conference on Natural Language Pro-
cessing (Volume 2: Short Papers), pages 198–203.
Vaswani, A., Shazeer, N., Parmar, N., Uszkoreit, J., Jones,
L., Gomez, A. N., Kaiser, Ł., and Polosukhin, I.
(2017). Attention is all you need. Adv. in Neural Inf.
Processing Systems, 30:5998–6008.
Verma, P. and Verma, A. (2020). A review on text sum-
marization techniques. Journal of Scientific Research,
64(1):251–257.
Different Metrics Results in Text Summarization Approaches
39
