
Using Machine Learning for Classification of Cancer Cells from Raman
Spectroscopy
Lerina Aversano
1 a
, Mario Luca Bernardi
1 b
, Vincenzo Calgano
3
, Marta Cimitile
2 c
,
Concetta Esposito
3
, Martina Iammarino
1 d
, Marco Pisco
3
, Sara Spaziani
3
and Chiara Verdone
1
1
University of Sannio, Department of Engineering, Benevento, Italy
2
Unitelma Sapienza University, Rome, Italy
3
University of Sannio, Optoelectronic Division - Engineering Department, Benevento, Italy
Keywords:
Machine Learning, Classification, Raman Spectroscopy Analisys, Health Informatics.
Abstract:
Since cancer represents one of the leading causes of death worldwide, the development of approaches ca-
pable of discerning healthy from diseased cells would be of fundamental importance to support diagnostic
and screening techniques. Raman spectroscopy is the most effective molecular analysis technique currently
available and provides information on the molecular composition, bonds, chemical environment, phase, and
crystalline structure of the samples under examination. This work exploits a combination of Raman spec-
troscopy and machine learning models to discriminate patients’ liver cells between tumor and non-tumor. The
research uses real patient data, provided by the Center for Nanophotonics and Optoelectronics for Human
Health (CNOS), which analyzed the cells of a patient with liver cancer. Specifically, the dataset has been built
through a long data collection process, which first involved the analysis of the cells with Raman spectroscopy
and then the training of two classifiers, Decision Tree and Random Forest. The results show good performance
for the trained classifiers, especially those relating to the Random Forest, which reaches an accuracy of 90%.
1 INTRODUCTION
Health institutions’ reports clearly highlight that one
of the leading causes of death in the world is cancer
(Torre et al., 2016; Miller et al., 2016). Just restricting
to 2020, we can count about 19.3 million new cases of
cancer in the world and about 10 million deaths due
to the disease.
Tumors represent a very complex disease and can
manifest in distinct phases, (i) the initial or localized
disease, in which there is only a single tumor in a
single site; (ii) the phase of relapse, whether or not
surgery, in which the disease recurs, but always and
only in the site where it appeared for the first time
and (iii) the disseminated form, in which the malig-
nant cells have exited the organ of origin to colonize
other organs even at a distance (metastasis). The main
problem for its identification and possible treatment
a
https://orcid.org/0000-0003-2436-6835
b
https://orcid.org/0000-0002-3223-7032
c
https://orcid.org/0000-0003-2403-8313
d
https://orcid.org/0000-0001-8025-733X
concerns the fact that each type of tumor requires a
different approach and, often, also different treatment
times.
Research in this regard is always in constant evo-
lution and currently, medicine has several methodolo-
gies at its disposal to fight cancer. Active surveillance
is reserved for very slow-growing cancers, surgery,
radiotherapy that uses X-rays to destroy cancer cells,
chemotherapy uses cytotoxic drugs, which are toxic
to cells, as they block the division of rapidly repli-
cating cells, without distinguishing between healthy
cells and diseased cells, hormone therapy, biologi-
cal or molecular target drugs are substances capa-
ble of ”recognizing” the tumor cell and promoting
its destruction by the immune system, and finally im-
munotherapy consists of drugs capable of stimulating
the immune system against cancer cells. In general,
the earlier a diagnosis is, the more timely and effec-
tive the treatment can be. The study (Neal et al., 2015)
showed that there is a correlation between diagnosis
made in a short time and a favorable outcome for the
patient. Therefore, developing approaches capable of
distinguishing healthy cells from compromised ones
Aversano, L., Bernardi, M., Calgano, V., Cimitile, M., Esposito, C., Iammarino, M., Pisco, M., Spaziani, S. and Verdone, C.
Using Machine Learning for Classification of Cancer Cells from Raman Spectroscopy.
DOI: 10.5220/0011142600003277
In Proceedings of the 3rd International Conference on Deep Learning Theory and Applications (DeLTA 2022), pages 15-24
ISBN: 978-989-758-584-5; ISSN: 2184-9277
Copyright
c
2022 by SCITEPRESS – Science and Technology Publications, Lda. All rights reserved
15

that can support diagnostic and screening techniques
would be fundamental. During the first phase of diag-
nosis, the most important step is between cancer cells
and normal cells. Currently, the methods in use for
tumor detection include several approaches including
MRI, tomography, endoscopy, different biochemical
pathways in combination with mass or optical spec-
troscopy (Henschke et al., 1999; Sun et al., 2008; Zhu
et al., 2008). Unfortunately, however, these require
very sensitive times and equipments for the early di-
agnosis of the tumor.
In the late 1970s, Raman spectroscopy with an op-
tical microscope was introduced and has been used
for microanalysis in many fields (Mulvaney and Keat-
ing, 2000). Micro-Raman spectroscopy has become
an important tool in biology, particularly for single-
cell studies (Smith et al., 2016). Raman spectroscopy
exploits the interaction of light through a process of
diffusion with matter (called scattering) to obtain in-
formation on the characteristics of a material and
its molecular structure but, infrared spectroscopy is
based on the absorption of light, Raman spectroscopy
provides information on intra- and intermolecular in-
teractions. Therefore, analyzing Raman spectra, it
should be possible to identify differences in molec-
ular compositions and structures between normal and
cancer cells and tissues.
At the same time, the technique of machine learn-
ing is spreading more and more in different fields of
medicine and bioengineering (Aversano et al., 2021b;
Ardimento et al., 2021; Aversano et al., 2020). Ma-
chine learning algorithms are fast and effective in
learning from the data that is provided in input, gener-
ating calculation models capable of automatically and
rapidly producing evaluation results.
Therefore, the combination of Raman spec-
troscopy and machine learning could lead to a reduc-
tion in the time required for the diagnosis of patient
cells, in order to subject the patient to specialist ex-
aminations as soon as possible in case of need (Zhang
et al., 2021; Zhang et al., 2022).
This research study is placed in this context and
has as its objective the classification of cells into
the tumor and non-tumor cells analyzed with Raman
spectroscopy.
This document is structured as follows. The fol-
lowing section provides some basic information. In
Section 2 there is a brief discussion of the related
work. The proposed approach is described in Section
4, while the results of the experiment are discussed in
Section 5. Finally, in Section 6 and 7, respectively,
the threats to validity and conclusions are reported.
2 RELATED WORKS
In recent years, numerous studies have focused on
the classification and prediction of human diseases of
different types. In particular, machine learning tech-
niques have been largely used for the early diagnosis
of many diseases, such as diabetes(G. and K., 2019),
heart disease(Karayılan and Kılıc¸, 2017), Parkinson’s
disease (Aversano et al., 2020) and thyroid diseases
(Aversano et al., 2021a). More recently they have
also been used for Covid-19 diagnosis (Rasheed et al.,
2021). These works are intended to reduce the time
and costs required for the diagnosis and treatment of
the patient.
Similarly, the proposed study aims to develop a
predictive model of liver cancer in a patient, start-
ing from the Raman spectroscopy analysis of patient
cells.
Few other studies have investigated approaches
based on the combination of Raman spectroscopy and
machine learning with this objective.
The study (Germond et al., 2018) concerns the
application of techniques based on machine learn-
ing for the classification of cell types. The authors
present different approaches to exploit the Raman hy-
perspectral images: they extract information of the
cell from the calculation of the average spectrum (i)
and from the wave numbers used to map the distri-
bution of molecular compounds (ii) combining the
two previous methods (iii). The adopted classifi-
cation method is the PCA-DA approach consisting
of a principal components analysis (PCA) step fol-
lowed by discriminant analysis (DA). In addition, au-
thors investigated projection on latent structure (PLS-
DA), predictive model K-means and Support Vector
Machine (SVM). With spectrum-based classification,
the PCA-DA model showed an accuracy of 83.3%,
while image-based classification scored an accuracy
of 96.3%. The combination of the two approaches
archives a 100% accuracy in cell line discrimination
in their experimentation.
Like the previous work, also in (Pavillon et al.,
2018) the authors used the statistical approach of PCA
for the analysis of small cellular changes in response
to stimuli, acquiring different parameters with unla-
beled microscopy and achieving an accuracy of the
model equal to 85
In (Schie et al., 2016) the authors used Ra-
man spectroscopy for the diversification of eukaryotic
from prokaryotic cells. Since the former is smaller
than the latter, a single Raman spectrum is often
enough to generate a dataset sufficient for the train-
ing phase. For the latter, more than one spectrum
is necessary. Since probing entire cells with Raman
DeLTA 2022 - 3rd International Conference on Deep Learning Theory and Applications
16

spectroscopy using high resolution takes a long time,
the authors propose a method that acquires integrated
Raman spectra that can cover a large portion of the
cell. The approach exploits support vector machines
for classification by comparing single spectra with in-
tegrated Raman images and spectra of cells. Their
results show that the sensitivity of the model can be
as high as 90%.
The study (Hsu et al., 2020) deals with stem cells,
which can self-renew and differentiate into multiple
cell types, allowing the evaluation of pharmaceuti-
cal effects and allowing the treatment of various neu-
ral diseases. The authors propose a platform exploit-
ing Raman-labeled spectroscopy to classify cells into
the different classes of neural cells (from induced cell
stem). For this reason, the authors used several clas-
sification models (i.e., Support Vector Machine, Ran-
dom Forest, K-Nearest Neighbor, and the Stochastic
Gradient (SGB) enhancement model) that achieve an
average accuracy of 97.5%.
In (Ren, 2020), the authors used normal breast
cells and prostate cancer cells and an NGK machine
learning approach to obtain a prediction value be-
tween 87% and 89% without considering the outliers.
The study (Lussier et al., 2019) reports an ap-
proach based on the combination of Raman spec-
troscopy and Deep Learning for the analysis at the
same time of at least eight in vitro metabolites close
to different cell lines. Analyzing these components
is fundamental because it allows research on living
cells for responses to inflammation and wound heal-
ing. The authors propose a supervised ANN neu-
ral network that assigns multiple spectra to the same
metabolite. The network consists of two convolu-
tional layers and two pooling layers and uses the soft-
max function at the output. The results show good
model performance, which achieves an accuracy of
86.8%.
Our study aims to classify tumor cells from non-
tumor cells through Machine Learning methods for
the first time. Moreover, the proposed model was
tested on true patients’ records as provided by the
Center for Nanophotonics and Optoelectronics for
Human Health (CNOS).
3 RAMAN SPECTROSCOPY
Raman spectroscopy is a widely used spectroscopic
method. It is an analysis technique providing infor-
mation on the chemical structure and molecular inter-
actions of a target sample (e.g., a tissue segment or
even a single cell). It works by pointing a laser beam
at a sample. Like is shown in Figure 1 ,a scattered
Figure 1: Scattering processes occurring when light inter-
acts with a molecule.
light excites molecules in the sample and the scatter-
ing effect is observed. Then, the scattered light is col-
lected by an optical system including a microscope
objective, and decomposed by the spectrograph.
A small amount of the scattered light shifts in en-
ergy from the laser frequency because of interactions
between the incident electromagnetic waves and the
vibrational energy levels of the molecules in the sam-
ple. Plotting the intensity of the shifted light against
the frequency produces a Raman spectrum of the sam-
ple.
The measured scattered light showed a broader
spectrum with additional wavelengths. A second fil-
ter (emission filter) behind the probe allowed block-
ing the incident wavelength. The observed resid-
ual scattered light could now be clearly distinguished
from the incident light. Raman spectra are usually
plotted according to the laser frequency, meaning the
Rayleigh band falls between 0 cm and 1 cm. On this
scale, the band positions sit at the frequencies corre-
sponding to the energy levels of varying functional
group vibrations.
Therefore, in summary, the light exits the system
hit by the laser in three components. A part of the
radiation spreads elastically in all directions without
loss of energy, i.e. at the same frequency as the in-
cident radiation (elastic scattering or Rayleigh). A
large portion passes through the sample and a very
small portion is diffused inelastically. This diffusion
can be of three types: anelastic ceding diffusion (Ra-
man Stokes diffusion); Acquisition of anelastic diffu-
sion (Raman anti-Stokes diffusion); and Energy in the
interaction with the molecule.
As for the excitation source, an intense monochro-
matic beam is used. Monochromatic because the fre-
quency shifts of the radiation diffused by the incident
radiation are very small and therefore the source must
be monochromatic to facilitate observation. Intense
because the intensity of the diffused radiation is very
low and therefore the incident radiation must have a
much greater intensity.
Using Machine Learning for Classification of Cancer Cells from Raman Spectroscopy
17
4 PROPOSED APPROACH
In this section, we report the proposed approach,
which aims to classify a cell as a tumor or not a tumor.
First, we describe the process used for data collection,
then the machine learning algorithms used and the pa-
rameters we have set for their operation, and finally,
the metrics used for the validation of the model.
4.1 Data Collection
The data for the research was provided by the Cen-
ter for Nanophotonics and Optoelectronics for Hu-
man Health (CNOS), which have analyzed the cells
of a patient with liver cancer (hepatocarcinoma) using
RAMAN spectroscopy. In this regard, two tissue sam-
ples from the liver have been taken from the patient,
one in the area affected by the tumor, and another lo-
cated in a part distant from the tumor but belonging to
the same liver tissue as the patient.
The cells have been supplied to the laboratory by
the National Cancer Institute IRCCS G. Pascale Foun-
dation
1
. These are real cells that have not undergone
any preliminary process and that compared to cell
lines, which correspond to a cell taken from the pa-
tient and replicated thousands of times, have not been
cultured or immortalized. Therefore, the lack of repli-
cation ensures that there is no loss of information re-
lated to their fundamental properties.
For the analysis using Raman spectroscopy,
LabRAM HR Evolution has been used, a system that,
thanks to the Raman effect, can obtain high spatial
and spectral resolution spectra using ultra-fast confo-
cal images. This instrument offers a wide range of
wavelengths, from 200 to 2200 nm, and can reach fre-
quencies of the order of 10 cm
−1
using an ultra-low
frequency module. For the processing and setup of
the measurements, the instrument has been supplied
with the LabSpec software.
During the measurement, the first phase consists
of the self-calibration of the instrument to set the right
parameters to obtain the Raman effect. The instru-
ment also has a Rayleigh filter which takes care of
filtering the non-informative vibrations, thus show-
ing only the Raman Stokes vibrations. In the second
phase, instead, the cell suitable for measurement is
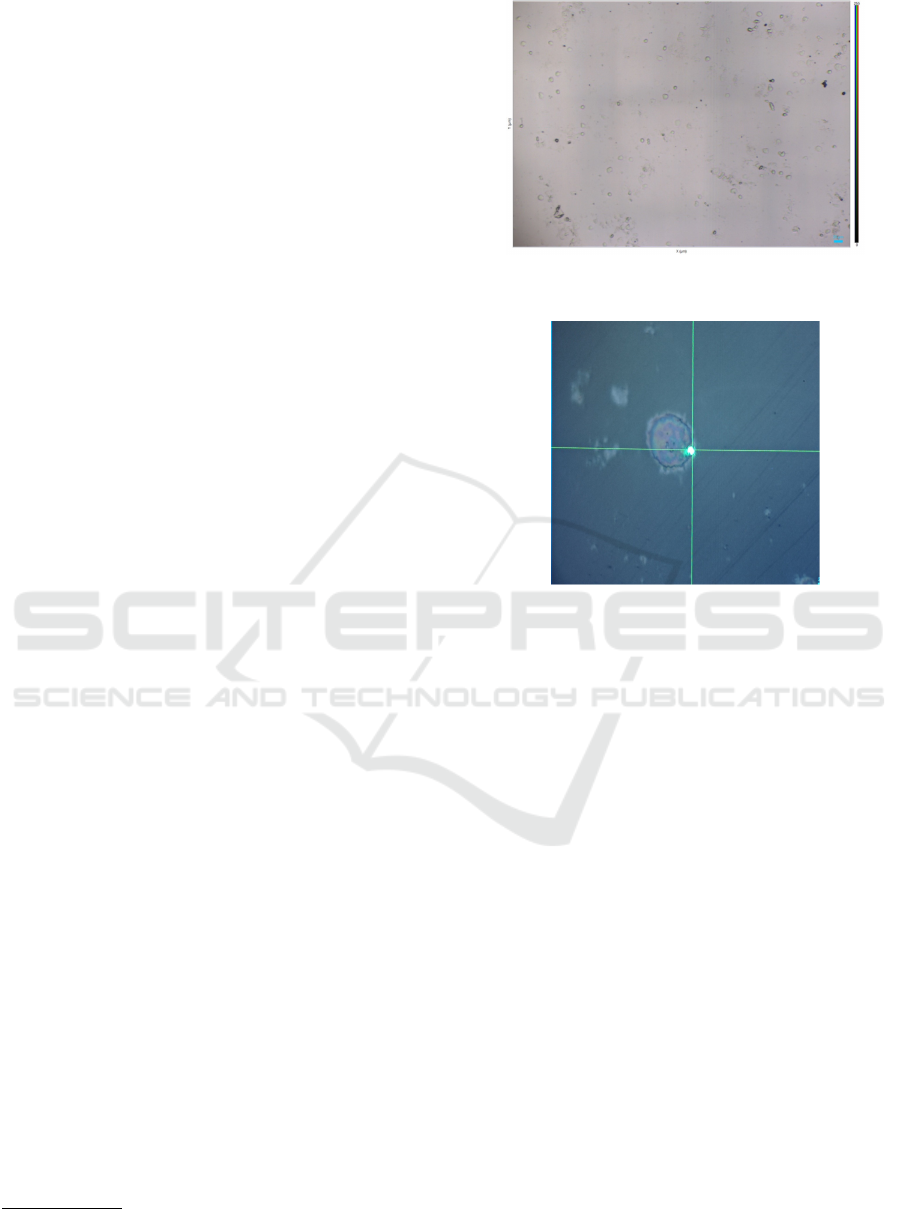
searched for using a resolution of 10x. In the figure
2 it’s possible to see the candidate cells for possible
measurement.
The selection of the suitable cell for measurement
is made based on the experience of the operator, who
1
https://www.alleanzacontroilcancro.it/en/istituto/istituto-
nazionale-tumori-fondazione-pascale/
Figure 2: Candidate cells for measurement with 10x resolu-
tion.
Figure 3: Visualization of a cell with resolution 100x and
laser positioning.
chooses the one that has the best visual characteris-
tics, excluding cells with irregular shapes or cells that
are involved in the cell division process. Once the cell
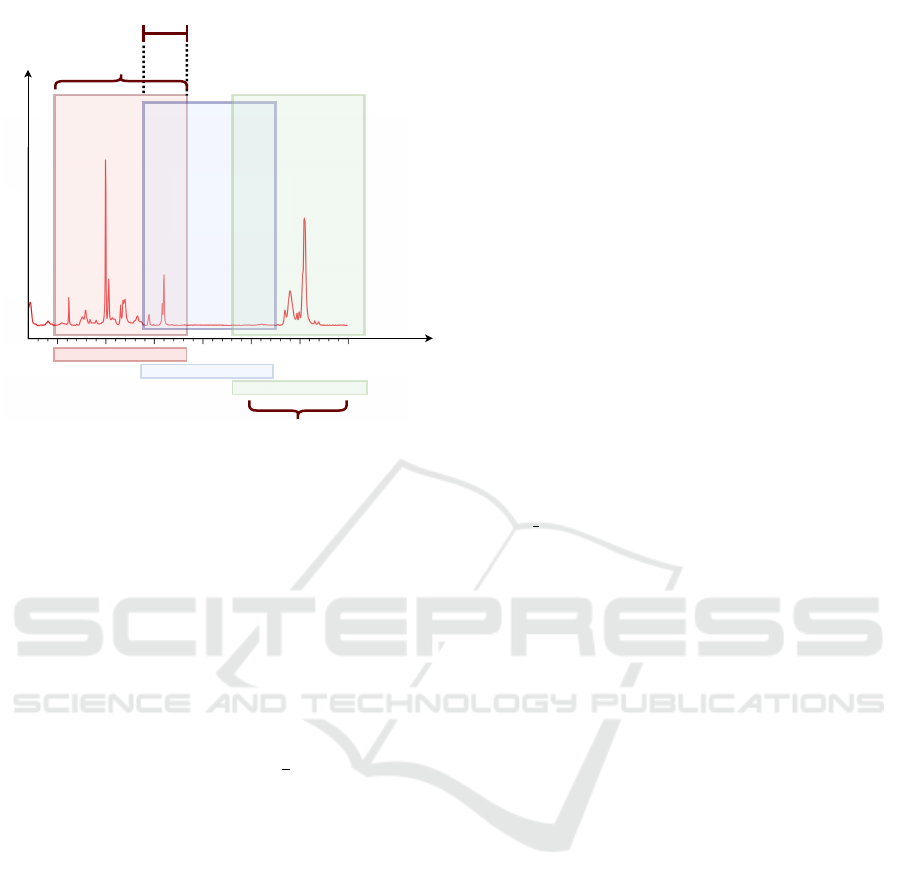
is selected, 100x resolution is used for a more detailed
view of the cell At this point, the operator moves the
laser towards a point within its nucleus, making 5
measurements for each cell at different points within
the nucleus of the same cell. The figure 3 shows the
cell with 100x resolution, where the green dot repre-
sents the laser that is manually guided by the operator.
The measurements carried out concern the Finger
Print Region which captures the Raman spectrum in
the region ranging from 600 cm
−1
up to 1800 cm
−1
.
There is also another region for acquisitions, the High
Wawe Length Region which instead ranges from 1800
cm
−1
up to 3100
−1
. In other cases, it is possible to
make measurements on the union of the two regions,
therefore from 600 cm
−1
up to 3100 cm
−1
.
Once the data was collected, these have been sub-
jected to preprocessing operations: vector normaliza-
tion, and windowing.
Having available a vector space that has an inter-
nal product and a norm, the vector normalization has
been performed because it allows obtaining a unitary
norm to the vector space In addition to normaliza-
tion, the removal of outliers, background, and sub-
DeLTA 2022 - 3rd International Conference on Deep Learning Theory and Applications
18
Window Size
Overlap
W
n-1
W
n
W
n+1
Amplitude
900 1000 1100
Window
Frequencies
Range
1100
1200 1300
Raman shift/cm
-1
600 700 900
Figure 4: Dataset is built using a sliding windows approach.
strate was also performed.
The windowing technique, exemplified in Figure
4, has been used to divide the sample into windows
of varying widths on which the ensemble is trained.
In particular, the window size ranges from 2 samples
to 90 samples. Data is divided into multiple win-
dows, characterized by different sizes and overlaps.
In this regard we have used four levels of overlap:
(i) no overlap; (ii) overlap of 0.5, meaning that win-
dows overlap by half of their size; (iii) overlap of 0.75,
meaning that windows overlap by
3
4
of their size and
(iv) leave-one-out overlap, meaning that the overlap is
almost total advancing the window by just one sam-
ple.
The final dataset that we have used consists of 364
frequencies, and each of them corresponds to a sam-
ple of amplitude in the various records of the dataset.
Specifically, within the dataset used, each record has:
• a progressive number representing the cell num-
ber and the measurement number, separated by a
dot. These two numbers, taken together, identify
one of the five points measured in the cell nucleus
(for instance, “1.1” identifies the first measure-
ment of the first cell);
• the measurement samples that represent the am-
plitudes corresponding to the various frequencies.
• the class label to predict, which identifies the type
of cell, and can take two values: Tumor if it is a
measurement made on a tumor cell, Non Tumor if
the cell is healthy.
4.2 Data Augmentation
To mitigate the problem of the reduced size of the
dataset, a data augmentation step has been per-
formed. It is a set of techniques that extend the
available dataset without actually collecting new el-
ements: data augmentation applies random controlled
changes to the already existing data, making modi-
fied copies. Augmented data can be either slightly
modified copies of already existing data or synthetic
data created starting from the initial dataset (van Dyk
and Meng, 2001). Therefore, with this technique, we
have increased the set of spectral data. In summary,
for spectral data, data augmentation is mainly carried
out with changes in the slope of the spectrum, random
multiplication of the amplitudes, addition of random
offsets, or, as achieved in this study, with the shift of
the wavelengths of the spectra. Another advantage of
this technique is that it reduces the phenomenon of
overfitting. Therefore, in this work an augmentation
was carried out based on the random generation of
new spectra shifted in wavelength, with the help of
the aug xshift() function.
More specifically, to use this function we have set
the following parameters:
• the spectrum, randomly selected from the set of
spectra available;
• the shift range specifies the range of possible ran-
dom shift values for the spectrum. In this case, 6
indicates the left limit at -6 and the right limit at
+6, corresponding to the interval [-6, + 6];
• the quantity, the number of new spectra generated
starting from the original spectrum. In this case,
we have opted for a value of 1 corresponding to
the default value of the function, so only a new
spectrum will be generated;
• the classes to predict, 1 in the case of tumor cell
spectra, 0 for non-tumor cells.
Therefore, an equal number of new spectra were gen-
erated for the two prediction classes, where each spec-
trum was randomly selected from the available set.
With this technique, we conducted an additional anal-
ysis, using a dataset made up of 632 samples as the
input of the classifiers, doubling the initial dataset.
4.3 Classification Methods and Setup
For the classification of cells into the tumor and non-
tumor cells, different classifiers have been used, vary-
ing the algorithm, the window size, the window over-
lap, and the adopted features. The goal is to train a
model that can support the diagnosis of liver cancer
Using Machine Learning for Classification of Cancer Cells from Raman Spectroscopy
19

Table 1: Validation Metrics.
Metrics Formula Description
Accuracy A =
T P+T N
T P+F P+T N+FN
(1)
The accuracy of the model on the test set, it defines true
positives (TP) and true negatives (TN) as correctly clas-
sified instances while false positives (FP) and false nega-
tives (FN) as classified instances incorrectly
Precision P =
T P
T P+F P
(2)
The ability of a classifier not to label as positive an in-
stance that is in fact negative, it represents the ratio be-
tween correct forecasts (TP) and the total forecasts (TP +
FP).
Recall R =
T P
T P+F N
(3)
The sensitivity of the model, it represents the ratio be-
tween the correct predictions for a given class on the total
of cases in which the class is verified
F1 Score F1 = 2 ∗
Precision∗Recall
Precision+Recall
(4)
The harmonic and weighted average of the Precision and
Recall. A classifier gets a high F1-Score only for high
Precision and Recall values.
effectively. More specifically, we have used learning
algorithms based on decision trees.
The Decision Tree Classifier (DTC) (Rokach and
Maimon, 2014) is an algorithm for which classifica-
tion functions are learned in the form of a tree. Within
the tree, the variables are represented by the nodes,
the possible value for that property is represented by
an arc at a child node and the expected value for a
given class based on the values of the other properties
is represented by a leaf. For each iteration, each at-
tribute is evaluated and the information gain is calcu-
lated, the attribute that gets the most information gain
is set as the new tree node. Once at the leaf node, the
algorithm assigns the class to which they belong to
the remaining instances. If there are multiple classes,
a probability distribution is assigned.
The Random Forest Classifier (RFC) (Breiman,
2001) is a classifier obtained by aggregating multiple
decision trees, which are trained with a random subset
of the training dataset. Each tree produces a predic-
tion of the class. Once all the predictions have been
produced, the result will be the one that appears most
frequently.
To train the classifiers we have used these param-
eters:
• DecisionTreeClassifier(criterion = ’entropy’,
max dept = 5000) where the criterion parameter
sets the way the quality of the split function is
evaluated. We have used entropy which sets
the criterion based on informational gain. The
max dept parameter indicates the maximum
depth of the decision tree. In our case, a depth of
5000 was set.
• RandomForestClassifier(max dept =1000
n estimators =1000), where the max dept
parameter has the same meaning as in the pre-
vious case and has been set to a depth of 1000,
while n estimators represents the number of trees
belonging to the forest, in our case 1000.
The dataset construction and the classifiers have
been built in Python, using the open-source scikit-
learn library for machine learning algorithms and the
Seglearn library to perform windows generation with
different sizes and overlaps.
4.4 Validation
To validate the performance of the different classi-
fiers, we have used the metrics reported in Table 1.
More specifically, the first column contains the name
of the metrics, the second the formula to calculate it,
and the third a brief description.
5 DISCUSSION OF RESULTS
In this section, we report the results obtained. Specifi-
cally, we have conducted, for each classification algo-
rithm, five different experiments, with a different set
of features provided in input to the classifiers:
• original dataset, as provided to us by the CNOS
center;
• addition of the base frequency (i.e., the lowest fre-
quency of each window) to the windows samples;
• addition of the frequency range (i.e., the lowest
and the highest frequencies of each window) to
the windows samples;
• addition of all the frequencies to the windows
samples (hence doubling the features);
• original dataset, as provided to us by the CNOS
center, extended with data augmentation (hence
doubling the samples).
In the second, third, and fourth experiments, we have
added more information to allow the classifier to learn
relationships among the peaks in the spectrum to the
frequencies where they happen.
For each experiment conducted, the results are
shown in Tables 2, 3, 4, 5, 6. Each table shows the
DeLTA 2022 - 3rd International Conference on Deep Learning Theory and Applications
20

results obtained with both classifiers used, the Deci-
sion Tree and the Random Forest. Respectively, the
first six columns refer to the first classifier, and those
following to the second. For each experiment, we re-
port the four cases in which we found the best results.
More specifically, in the first two columns, col-
ored in yellow, we report the parameters we have set
for the windows size and overlap, and in the following
columns the metrics we used for model validation. In
particular, accuracy, precision, recall, and F measure.
Therefore, Table 2 reports the results obtained
by training and evaluating the model on the starting
dataset, containing the progressive number represent-
ing the cell number and the measurement number, the
amplitudes corresponding to the various wavenum-
bers, and the type of cell (tumor or non-tumor). As
you can see in the table, with the Decision Tree the
best performances have been obtained by setting the
window size to 85 and an overlap equal to 50%. In
this case, the model has an accuracy of 70%, a preci-
sion of 75%, recall of 77%, and F measure of 76%.
With the Random Forest, the results are better, the
F-measure oscillates between 85% and 86% for all
four of the best cases reported. In particular, with this
classifier, the best results were obtained by setting the
window size to 60 and considering a null overlap. In
this case, the validation metrics are respectively 82%,
83%, 88%, and 85%. These results attest that the
classifier, specifically Random Forest, albeit with a
modestly sized dataset, can classify the instances with
some success.
In Table 3 we show the results obtained for the
second experiment. In particular, in addition to the
information previously described, we have added the
lowest frequency of each window as an additional fea-
ture. With these input data, the Decision Tree clas-
sifier has got the best results with window size 80
and null overlap, it reaches an F-score equal to 74%.
Therefore, compared to the previous experiment, in
this case, the additional information did not help, but
led to a lowering, albeit minimal, of the model valida-
tion metrics.
This did not happen in the case of Random Forest,
where the F-score reached 86% in the best case. In
particular, the best case is the one with a window size
of 60 and null overlap.
In the third experiment, the frequency range (i.e.,
lowest and highest frequencies of the windows) have
been added as additional features. Table 4 shows that
in the case of the Decision Tree there is still no in-
crease in the F-score, this being almost 75% in the
best case, the one with a window size of 50 and zero
overlap. In the original dataset, however, the high-
est F-score with this model was 76%. With the Ran-
dom Forest instead there continues to be a slight in-
crease in the best case (i.e., window size 75 and zero
overlap). Specifically, it shows a slight improvement
in the F-score equal to 86% and a strong increase in
the Recall that reaches 91%. Therefore, these results
show that with the addition of this information Ran-
dom Forest is able to learn relationships among peaks
and the frequencies better than other classifiers, man-
aging to further minimize the classification errors of
the input instances.
Table 5 instead shows the results related to the
fourth experiment where all the frequencies corre-
sponding to each window have been added as addi-
tional features (doubling the features). As in the two
previous cases, for the Decision Tree, there are no
substantial variations in the scores obtained for the
validation metrics, which remain stable. On the con-
trary, with Random Forest we continue to have a small
increase in the F-score. In fact, in the best case, with a
window size equal to 75 and without overlap, we ob-
tain an increase of 0.3% compared to the experiment
conducted including the frequency intervals. These
improvements, albeit small, say that the classifier is
improving its performance during the training phase.
Finally, the last experiment has been conducted
using the data augmentation technique, the results of
which are shown in Table 6. The results show a de-
cisive improvement in the case of the Decision Tree,
which in the best case with a window size of 70 and
without overlap obtains a substantial increase in ac-
curacy, going from 70% on the initial dataset to 82%
in this case. The other metrics, on the other hand, re-
main stable. This is also true for the Random Forest,
which in the best case has a window size of 75 and an
overlap of 50%. With these parameters we obtain an
accuracy of almost 90%, precision almost 81%, recall
84%, and F-score 82%.
Therefore, it is possible to note that among the
classifiers chosen, the one that best fits the data is
the Random Forest, which in all five experiments con-
ducted obtained the best results with an overlap equal
to 0 and which is the best performance ever. were ob-
tained in the fourth experiment, where the classifier
received the starting dataset as input with the addition
of all the frequencies of the window under examina-
tion.
6 THREATS TO VALIDITY
The proposed study suffers from three types of threats
to validity: internal, external, and constructive.
Threat to internal validity could be classification
errors due to incorrect data labeling. This risk is
Using Machine Learning for Classification of Cancer Cells from Raman Spectroscopy
21
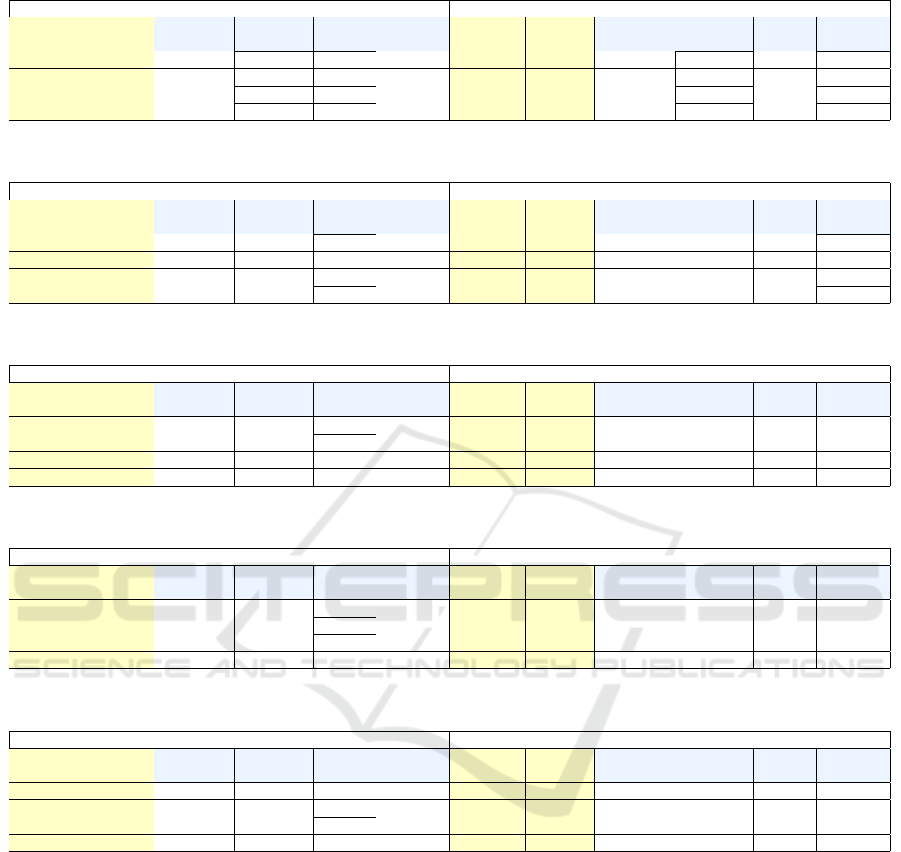
Table 2: Results on the original Dataset.
Decision Tree Random Forest
Windows
Size
Overlap Accuracy Precision Recall F1-Score
Windows
Size
Overlap Accuracy Precision Recall F1-Score
85 0 68,95% 72,84% 77,29% 75,00% 90 0.5 81,17% 82,71% 87,41% 84,99%
90 0.5 70,03% 76,14% 74,07% 75,09% 75 0 81,32% 80,86% 90,39% 85,36%
80 0 69,47% 73,84% 76,42% 75,11% 55 0 81,90% 82,48% 88,95% 85,59%
85 0.5 70,33% 75,00% 77,04% 76,00% 60 0 82,25% 83,11% 88,66% 85,79%
Table 3: Results with the base Frequency.
Decision Tree Random Forest
Windows
Size
Overlap Accuracy Precision Recall F1-Score
Windows
Size
Overlap Accuracy Precision Recall F1-Score
80 0.75 68,42% 71,89% 74,94% 73,38% 75 0.75 80,89% 78,17% 92,41% 84,69%
65 0.75 68,87% 72,20% 75,31% 73,72% 75 0 81,32% 80,86% 90,39% 85,36%
75 0.75 69,91% 72,83% 75,60% 74,19% 55 0 82,43% 82,97% 89,24% 85,99%
80 0 68,95% 74,03% 74,67% 74,35% 60 0 82,60% 83,75% 88,37% 86,00%
Table 4: Results with the interval Frequency.
Decision Tree Random Forest
Windows
Size
Overlap Accuracy Precision Recall F1-Score
Windows
Size
Overlap Accuracy Precision Recall F1-Score
75 0.75 69,42% 72,79% 74,30% 73,54% 75 0.75 80,58% 77,91% 92,19% 84,45%
75 0 68,95% 74,67% 73,36% 74,01% 60 0 82,25% 83,47% 88,08% 85,71%
80 0.75 69,48% 72,95% 75,42% 74,17% 55 0 82,43% 82,80% 89,53% 86,03%
50 0 70,33% 77,37% 72,59% 74,90% 75 0 82,37% 81,64% 91,27% 86,19%
Table 5: Results with all Frequencies.
Decision Tree Random Forest
Windows
Size
Overlap Accuracy Precision Recall F1-Score
Windows
Size
Overlap Accuracy Precision Recall F1-Score
50 0 69,28% 76,52% 71,60% 73,98% 80 1 80,77% 78,56% 91,59% 84,57%
60 0 68,89% 74,78% 73,26% 74,01% 55 0 82,07% 82,70% 88,95% 85,71%
75 0.75 70,22% 73,46% 75,05% 74,25% 60 0 82,25% 83,47% 88,08% 85,71%
80 0 68,95% 74,03% 74,67% 74,35% 75 0 82,63% 81,71% 91,70% 86,42%
Table 6: Results with Data Augmentation.
Decision Tree Random Forest
Windows
Size
Overlap Accuracy Precision Recall F1-Score
Windows
Size
Overlap Accuracy Precision Recall F1-Score
75 0 83,38% 69,19% 70,19% 69,69% 85 0.75 89,97% 83,36% 81,18% 82,25%
85 0.5 82,56% 68,59% 71,65% 70,09% 85 1 89,76% 80,65% 84,13% 82,35%
75 0.5 82,25% 66,60% 74,19% 70,19% 90 1 89,82% 80,51% 84,43% 82,42%
70 0 82,39% 69,18% 72,14% 70,63% 75 0.5 89,98% 80,98% 84,19% 82,55%
strongly mitigated because the data set used was
provided by a specialized center (i.e., the Center
for Nanophotonics and Optoelectronics for Human
Health (CNOS)) which analyzed the cells of a pa-
tient under treatment at a known institute of national
prestige (National Cancer Institute IRCCS G. Pascale
Foundation).
On the other hand, the generalization of the re-
sults is about the threat to external validity. A limi-
tation of the study is represented by the classification
carried out on the cells of a single patient, for which
the dataset does not contain a very high number of in-
stances. To avoid this threat, we have used the data
augmentation technique.
Finally, threats to construct validity could be rep-
resented by inaccuracies or omissions made during
the construction phase of the dataset. To mitigate this
problem, the cells have been analyzed using Raman
spectroscopy.
7 CONCLUSIONS AND FUTURE
WORK
This paper addressed an important issue because
nowadays oncological diseases represent the leading
cause of death in the world. Developing a system
that can help the oncologist in the evaluation of tumor
markers, can lead soon to tools that greatly speed up
the time in diagnosing the pathology. The study car-
DeLTA 2022 - 3rd International Conference on Deep Learning Theory and Applications
22

ried out on real cells opens the door to ”diagnosis in
real-time”, through detection using the Raman spec-
trum, a non-invasive and non-destructive technique
for the patient.
The proposed approach, based on the combination
of Raman spectroscopy and the use of machine learn-
ing models, allows obtaining data on the patient’s
cells to be identified as “malignant” or not in a matter
of minutes. This methodology does not aim to replace
the work of the doctor who remains at the center of
the diagnosis and treatment process but is a tool made
available to him.
The main contribution of this work consists in the
use of a dataset containing real information about a
patient under treatment at the National CancerInsti-
tute IRCCS G. Pascale Foundation, whose cells have
been analyzed by the Center for Nanophotonics and
Optoelectronics for Human Health (CNOS).
Therefore, the proposed approach has been tested
on an overall dataset containing 364 wavenumbers
where each corresponds to a sample of amplitude
across the various records of the dataset. The results
show good performance of the Random Forest Clas-
sifier which in the case of data augmentation reached
an accuracy of 89.98%.
The limitation of the study concerns the fact that
the classification was carried out on cells relating to
a single patient, because some were collected in the
tumor area, and others in adjacent but healthy areas.
So, in the future it could be interesting to inves-
tigate in three different directions: classification of
cells from different patients but with the same pathol-
ogy to assess whether the pathology has similar traits
in different patients (i); classification of cells from
different patients but with different tumor patholo-
gies to evaluate if there is an indicator, that is a
set of biological components, common for all onco-
logical pathologies (ii); classification of cells from
healthy patients and patients suffering from oncologi-
cal diseases to understand if some tumor traits are also
present in healthy patients, avoiding the disease with
effective prevention therapy (iii).
REFERENCES
Ardimento, P., Aversano, L., Bernardi, M. L., and Cimitile,
M. (2021). Deep neural networks ensemble for lung
nodule detection on chest ct scans. In 2021 Interna-
tional Joint Conference on Neural Networks (IJCNN),
pages 1–8.
Aversano, L., Bernardi, M. L., Cimitile, M., Iammarino,
M., Macchia, P. E., Nettore, I. C., and Verdone,
C. (2021a). Thyroid disease treatment prediction
with machine learning approaches. Procedia Com-
puter Science, 192:1031–1040. Knowledge-Based
and Intelligent Information and Engineering Sys-
tems: Proceedings of the 25th International Confer-
ence KES2021.
Aversano, L., Bernardi, M. L., Cimitile, M., and Pecori,
R. (2020). Early detection of parkinson disease us-
ing deep neural networks on gait dynamics. In 2020
International Joint Conference on Neural Networks
(IJCNN), pages 1–8.
Aversano, L., Bernardi, M. L., Cimitile, M., and Pecori,
R. (2020). Early detection of parkinson disease us-
ing deep neural networks on gait dynamics. In 2020
International Joint Conference on Neural Networks
(IJCNN), pages 1–8.
Aversano, L., Bernardi, M. L., Cimitile, M., and Pecori,
R. (2021b). Deep neural networks ensemble to de-
tect covid-19 from ct scans. Pattern Recognition,
120:108135.
Breiman, L. (2001). Random forests. Machine Learning,
45(1):5–32.
G., S. S. and K., M. (2019). Diagnosis of diabetes diseases
using optimized fuzzy rule set by grey wolf optimiza-
tion. Pattern Recognition Letters, 125:432 – 438.
Germond, A., Ichimura, T., da Chiu, L., Fujita, K., Watan-
abe, T. M., and Fujita, H. (2018). Cell type discrimina-
tion based on image features of molecular component
distribution. Scientific Reports, 8.
Henschke, C. I., McCauley, D. I., Yankelevitz, D. F.,
Naidich, D. P., McGuinness, G., Miettinen, O. S.,
Libby, D. M., Pasmantier, M. W., Koizumi, J., Altorki,
N. K., and Smith, J. P. (1999). Early lung cancer ac-
tion project: overall design and findings from baseline
screening. The Lancet, 354(9173):99–105.
Hsu, C.-C., Xu, J., Brinkhof, B., Wang, H., Cui, Z., Huang,
W. E., and Ye, H. (2020). A single-cell raman-based
platform to identify developmental stages of human
pluripotent stem cell-derived neurons. Proceedings
of the National Academy of Sciences, 117(31):18412–
18423.
Karayılan, T. and Kılıc¸, . (2017). Prediction of heart disease
using neural network. In 2017 International Confer-
ence on Computer Science and Engineering (UBMK),
pages 719–723.
Lussier, F., Missirlis, D., Spatz, J. P., and Mas-
son, J.-F. (2019). Machine-learning-driven surface-
enhanced raman scattering optophysiology reveals
multiplexed metabolite gradients near cells. ACS
Nano, 13(2):1403–1411. PMID: 30724079.
Miller, K. D., Siegel, R. L., Lin, C. C., Mariotto, A. B.,
Kramer, J. L., and Rowland, J. H. (2016). Cancer
treatment and survivorship statistics, 2016. CA Can-
cer J Clin, 66:271–289.
Mulvaney, S. P. and Keating, C. D. (2000). Raman spec-
troscopy. Analytical Chemistry, 72(12):145–158.
Neal, R. D., Tharmanathan, P., France, B., Din, N. U.,
Cotton, S. J., Fallon-Ferguson, J., Hamilton, W. T.,
Hendry, A., Hendry, M., Lewis, R., Macleod, U.,
Mitchell, E. D., Pickett, M., Rai, T. K., Shaw, K., Stu-
art, N. S., Tørring, M. L., Wilkinson, C., Williams,
B., Williams, N., and Emery, J. D. (2015). Is increased
Using Machine Learning for Classification of Cancer Cells from Raman Spectroscopy
23

time to diagnosis and treatment in symptomatic cancer
associated with poorer outcomes? systematic review.
British Journal of Cancer, 112:S92 – S107.
Pavillon, N., Hobro, A. J., Akira, S., and Smith, N. I.
(2018). Noninvasive detection of macrophage activa-
tion with single-cell resolution through machine learn-
ing. Proceedings of the National Academy of Sciences,
115(12):E2676–E2685.
Rasheed, J., Hameed, A. A., Djeddi, C., Jamil, A., and Al-
Turjman, F. (2021). A machine learning-based frame-
work for diagnosis of covid-19 from chest x-ray im-
ages. Interdisciplinary Sciences: Computational Life
Sciences, 13(1):103–117.
Ren, X., N. W. G. P. e. a. (2020). Scalable nanolaminated
sers multiwell cell culture assay. Microsyst Nanoeng,
6(47).
Rokach, L. and Maimon, O. (2014). Data Mining with De-
cision Trees. WORLD SCIENTIFIC, 2nd edition.
Schie, I. W., Kiselev, R., Krafft, C., and Popp, J. (2016).
Rapid acquisition of mean raman spectra of eukary-
otic cells for a robust single cell classification. The
Analyst, 141 23:6387–6395.
Smith, R., Wright, K. L., and Ashton, L. (2016). Raman
spectroscopy: an evolving technique for live cell stud-
ies. Analyst, 141:3590–3600.
Sun, C., Lee, J. S., and Zhang, M. (2008). Magnetic
nanoparticles in mr imaging and drug delivery. Ad-
vanced Drug Delivery Reviews, 60(11):1252–1265.
Inorganic Nanoparticles in Drug Delivery.
Torre, L. A., Siegel, R. L., and Jemal, A. (2016). Lung
Cancer Statistics, pages 1–19. Springer International
Publishing, Cham.
van Dyk, D. A. and Meng, X.-L. (2001). The art of data
augmentation. Journal of Computational and Graph-
ical Statistics, 10(1):1–50.
Zhang, H., Chen, C., Gao, R., Yan, Z., Zhu, Z., Yang, B.,
Chen, C., Lv, X., Li, H., and Huang, Z. (2021). Rapid
identification of cervical adenocarcinoma and cervical
squamous cell carcinoma tissue based on raman spec-
troscopy combined with multiple machine learning al-
gorithms. Photodiagnosis and Photodynamic Ther-
apy, 33:102104.
Zhang, L., Li, C., Peng, D., Yi, X., He, S., Liu, F., Zheng,
X., Huang, W. E., Zhao, L., and Huang, X. (2022).
Raman spectroscopy and machine learning for the
classification of breast cancers. Spectrochimica Acta
Part A: Molecular and Biomolecular Spectroscopy,
264:120300.
Zhu, Q.-L., Jiang, Y.-X., Liu, J.-B., Liu, H., Sun, Q.,
Dai, Q., and Chen, X. (2008). Real-time ultra-
sound elastography: Its potential role in assessment of
breast lesions. Ultrasound in Medicine and Biology,
34(8):1232–1238.
DeLTA 2022 - 3rd International Conference on Deep Learning Theory and Applications
24
