
Maneuver-based Visualization of Similarities between Recorded Traffic
Scenarios
Thilo Braun, Lennart Ries, Moritz Hesche, Stefan Otten and Eric Sax
FZI Research Center for Information Technology, Haid-und-Neu-Str. 10-14, 76131 Karlsruhe, Germany
Keywords:
Scenario-based Testing, Scenario Extraction, Graph Visualization.
Abstract:
Since automated driving functions are safety-critical systems, extensive validation and verification is neces-
sary. Scenario-based testing is a promising approach for this challenge. For selection of relevant scenarios, col-
lected data and knowledge models are potential sources. In this paper we introduce a concept to use recorded
trajectory and map data, abstracted to maneuvers, to describe the scenarios and visualize them intuitively. This
enables a data-driven scenario-mining process to find relevant scenarios for the testing of automated driving
functions. To compare the scenarios, a similarity measure based on the manuevers is designed and the sce-
narios and their similarities are represented as a graph. Graph-visualization methods, already successfully
applied in other domains, structure the collected data for further analysis. The concept is exemplary applied
to an urban traffic dataset.
1 INTRODUCTION
Automated driving functions on public roads have
the potential to fundamentally change our transporta-
tion in the future. But validation and verification are
major concerns to ensure a sufficiently high level of
safety and acceptance (PEGASUS, 2019). As the
functionality and operational design domain for au-
tomated driving functions increases, the combination
of safety-critical systems in an unstructured open-
world lead to new challenges in safety argumenta-
tion. Distance-based testing, as practiced to date, is no
longer feasible to ensure safe systems because several
billions of test kilometers would have to be driven for
a valid test coverage (Wachenfeld and Winner, 2015)
(Kalra and Paddock, 2016). Even with the usage of
simulation tools, the required amount of test kilome-
ters can not be achieved (Pfeffer, 2020). Therefore, a
more efficient way to increase test coverage is needed.
Current research projects and industry are focusing
on scenario-based testing in this regard (PEGASUS,
2019)(Neurohr et al., 2020)(VVM, 2020)(Bagschik
et al., 2017). This approach exploits the redundancy
of traffic scenarios that occur during distance-based
testing: Instead of testing the same scenarios several
times, as they occur randomly in distance-based test-
ing, they are selected from a scenario catalog. Since
one test of the scenario is enough to ensure the safety
of the driving function in this scenario, the test cov-
erage increases more efficiently. The scenario cata-
log should contain all relevant scenarios for the oper-
ational design domain of the automated driving func-
tion to ensure a certain performance metric. However,
one question is unanswered yet: How to build the sce-
nario catalog and how to select the scenarios for exe-
cution and testing of automated driving functions?
Recorded real-world driving data from drones, traf-
fic infrastructure, or vehicles include helpful informa-
tion to support these challenges. They are the most
realistic source for scenarios and contain informa-
tion about their occurrence probabilities. Since the
amount of data from recorded trips is too extensive
for manual analysis and the unprocessed data does not
provide information in directly useable form, meth-
ods are needed to extract the relevant information.
The recorded data builds a scenario space with high
redundancy. A structured and intuitive representa-
tion of the recorded scenarios, e.g. as maneuvers,
enables efficient data mining in this scenario space.
Different techniques can help to extract relevant in-
formation from the data: Grouping similar scenar-
ios can reduce the high redundancy. E.g., all sce-
narios where a vehicle is driving alone on a straight
road can be considered a scenario group. Also, the
relationships between these groups contain relevant
information. From a maneuver perspective, follow-
ing another vehicle on a straight road is more simi-
lar to the previously described scenario, than driving
236
Braun, T., Ries, L., Hesche, M., Otten, S. and Sax, E.
Maneuver-based Visualization of Similarities between Recorded Traffic Scenarios.
DOI: 10.5220/0011140600003269
In Proceedings of the 11th International Conference on Data Science, Technology and Applications (DATA 2022), pages 236-244
ISBN: 978-989-758-583-8; ISSN: 2184-285X
Copyright
c
2022 by SCITEPRESS – Science and Technology Publications, Lda. All rights reserved

over an intersection in an urban environment. In ad-
dition, there are rarely occurring exceptional corner
cases that have to be identified, such as driving ma-
neuvers executed by emergency vehicles against the
rules for ordinary traffic participants, which must also
be considered in the test process. All of these tech-
niques need a similarity measure between the indi-
vidual scenarios. Furthermore, this similarity can be
used as an input for a graph representation for intu-
itive visualization. In other domains, this graph anal-
ysis approach is successfully used for challenges of
visualizing data of similar data structures by many au-
thors (Batagelj and Mrvar, 1998)(Pavlopoulos et al.,
2017)(Bastian et al., 2009). In literature manage-
ment (Perianes-Rodriguez et al., 2016) the relation-
ships of various publications and journals are visual-
ized. Biological (Shannon et al., 2003) and genomic
data (Thimm et al., 2004) (Theocharidis et al., 2009)
is represented as graphs for interpretation. Also so-
cial networks are analyzed with this method (Borgatti
et al., 2002). This paper examines the extent to which
the methods, already proven helpful in other domains,
can achieve a structured and intuitive representation
of the scenario space in the automotive context.
2 RELATED WORK
2.1 Scenario Sources and Description
A formal definition for scenarios is presented in the
(ISO21448, 2019): A scenario describes the tem-
poral development between several scenes in a se-
quence of scenes. Compared to a scene, which is
a snapshot without temporal expansion, a scenario
spans a certain amount of time. According to the
PEGASUS Project (PEGASUS, 2020) and (Neurohr
et al., 2020), there are two sources for scenarios:
Knowledge-based and data-based. In the knowledge-
based approach, scenarios are created using expert
knowledge and a knowledge model (Bagschik et al.,
2018)(Ponn et al., 2019) (Neurohr et al., 2021). For
the data-based approach, recorded real-world traffic,
simulated traffic, test drives and accident databases
build a possible set of source for the scenarios (Koop-
man and Wagner, 2018)(PEGASUS, 2020)(Hartjen
et al., 2019a)(Weber et al., 2021)(Lizenberg et al.,
2021).
(Scholtes et al., 2021) propose a 6 layer model
to describe different aspects of the scenarios: Street
level (L1), traffic infrastructure (L2), temporal mod-
ifications of L1 and L2 (L3), movable objects (L4),
environment conditions (L5) and digital information
(L6).
For the dynamic description of the movable ob-
jects in L4, which is the focus of this paper, a
sequence of driving maneuvers is an established
way (ASAM, 2020)(Pfeffer, 2020) (Hartjen et al.,
2019b)(Braun et al., 2021)(King et al., 2021). A
maneuver is an abstract description of the behavior
of a participant during a specified timespan (Bach,
2018). Compared to a description with trajectories,
the maneuvers are more concise and semantically in-
terpretable and therefore offer easier further process-
ing.
2.2 Scenario Similarity and Clustering
While not much literature exist on similarities be-
tween scenarios, there is ongoing research on the re-
lated method of scenario clustering. (Ries et al., 2021)
uses a DTW-comparison of recorded trajectories to
cluster scenarios. (King et al., 2021) cluster scenarios
based on a maneuver extraction. Scenarios with the
same maneuvers are considered as equal and build a
cluster. A more sophisticated measure for similarities
between non-equal scenarios is not created. (Hart-
jen et al., 2020) also define the equality based on
extracted maneuvers and investigate how often new
scenarios occurs during recordings. (Balasubrama-
nian et al., 2021) introduce a random forest activa-
tion pattern to build clusters of traffic scenarios based
on iterative optimization of self-supervised networks.
(Langner et al., 2019) derives the cluster based on the
static elements of the scenarios. (Ries et al., 2020)
convert trajectories to driving states to represent sce-
narios and use them for a semantic comparison of the
recorded scenarios.
2.3 Graph-visualization
As stated in chapter 1, visualization methods for
graphs give an intuitive representation of the under-
lying data. The position of the nodes in this visual-
ization is called layout and can be calculated by dif-
ferent algorithms: Force-directed algorithms offer a
flexible and domain-independent way to create lay-
outs. The underlying concept of these categories of
layout algorithm is to model the graph as a system
of particles which all exert forces on each other de-
pending on their position in the layout and their actual
relationship in the graph structure. From a general
view, force directed layouts try to find an appropri-
ate positioning of the nodes by minimizing the corre-
sponding energy in the modelled system. A compre-
hensive comparison of existing force-directed meth-
ods is given in (Kobourov, 2012). Besides the force-
embedders, multidimensional scaling is a collective
Maneuver-based Visualization of Similarities between Recorded Traffic Scenarios
237
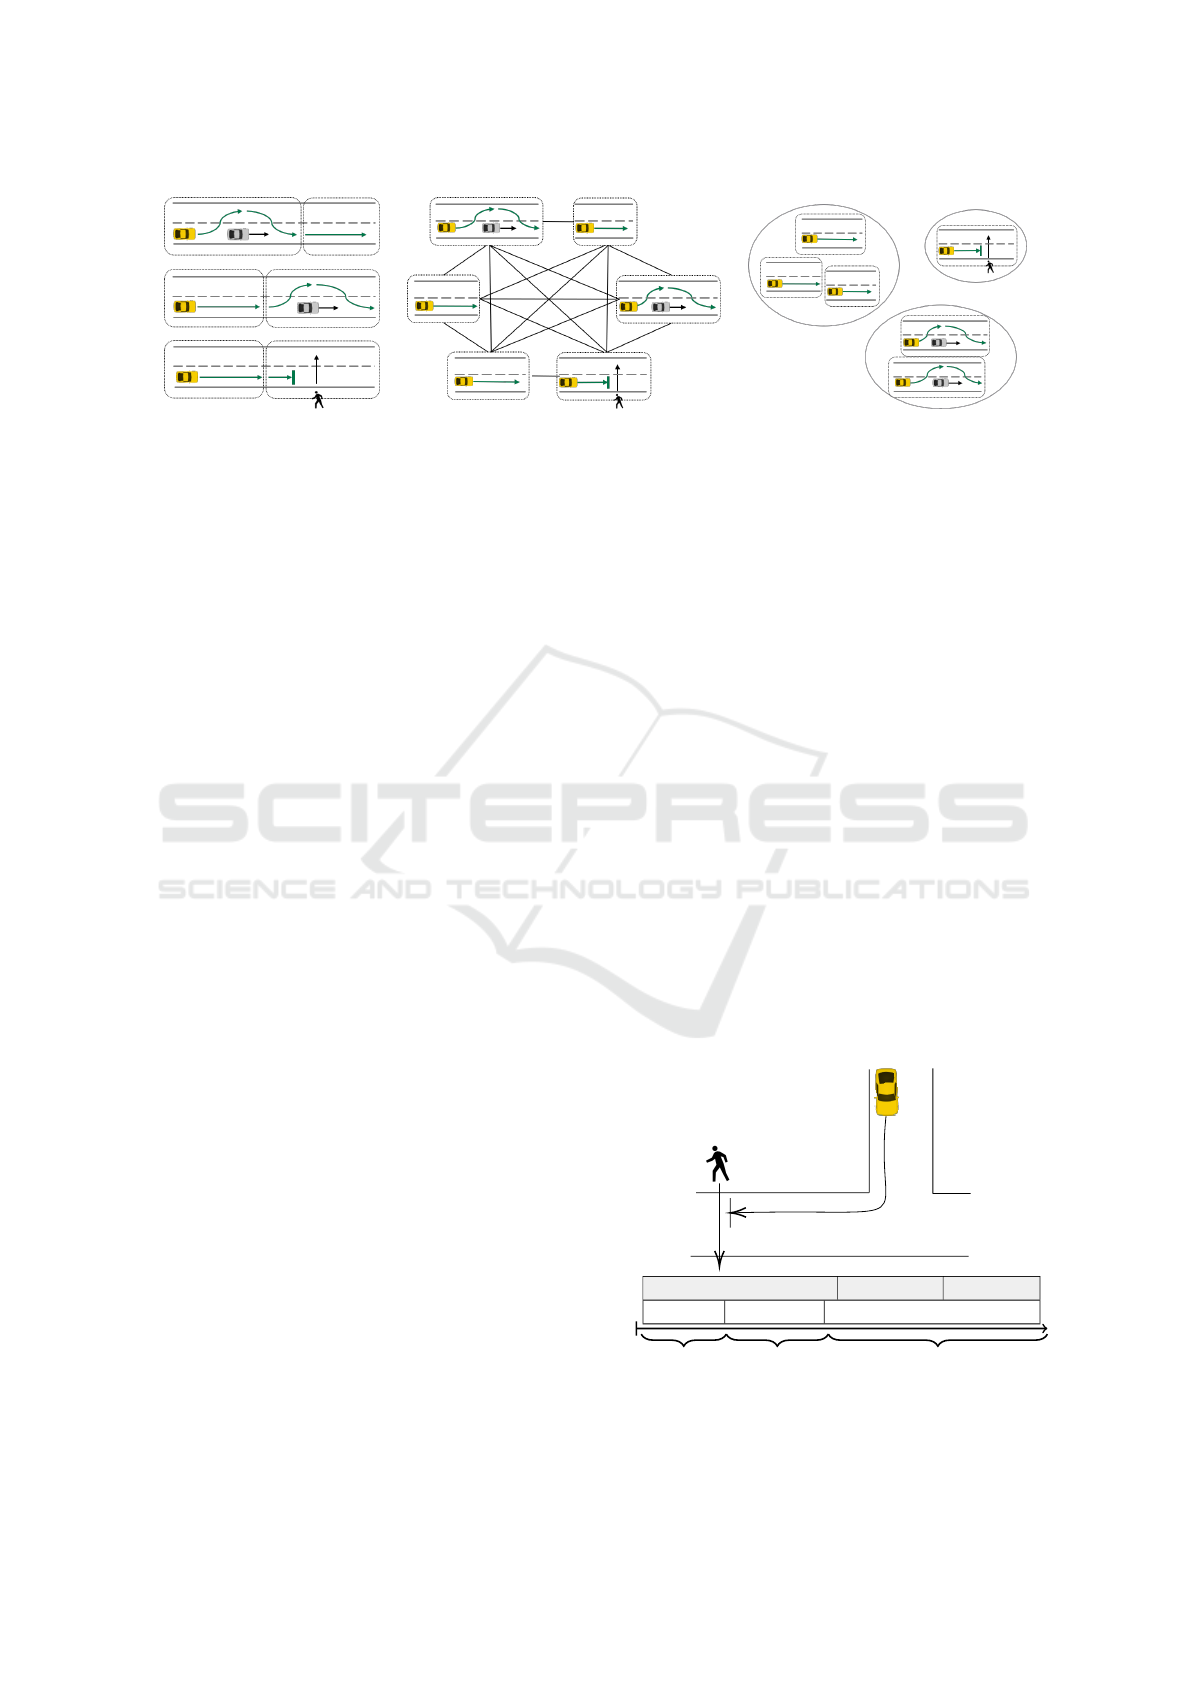
(a) Recorded trajectories and
segmenation to scenarios.
(b) Segmented scenarios as a graph with
similarities as edges.
(c) Scenario graph visualization (simi-
lar scenarios are close to each other).
Figure 1: Concept for extraction of scenarios, building a graph and a visualization based on similarities.
term for methods whose goal is to visualize the sim-
ilarity relations of objects by the suitable arrange-
ment of points in low-dimensional space (Cox and
Cox, 2008). While multidimensional scaling is often
used as a method for dimension reduction, (Gansner
et al., 2004) and (Klimenta, 2012) consider the appli-
cation of this method as a layout for (fully connected)
graphs.
3 CONCEPT FOR SCENARIO
SPACE VISUALIZATION
The concept contains the following steps (Fig. 1):
Abstraction of the trajectories to maneuvers se-
quences, segmentation and extraction of scenarios,
calculation of similarities between the scenarios and
graph visualization based on the similarities.
3.1 Abstraction through Representation
as Maneuver Matrix
A modified version of the maneuver list of (Hartjen
et al., 2019a) is used to describe the behavior of the
traffic participants. Each participant gets assigned
a maneuver state for each maneuver type for each
timestep. For demonstration purposes, this paper will
mainly focus on the maneuver type “vehicle state”,
which describes the longitudinal motion, and the ma-
neuver type “turn”, which describes the behavior on
intersections. Nevertheless, the concept is applicable
to any other maneuver types. The state of maneuver
type “vehicle state” can be “cruise”, “decelerate”, or
“standstill”. The state of maneuver type “turn” can be
“turn left” or “turn right” for the direction when cross-
ing an intersection or “no turn”, if the participant does
not perform a turn maneuver. A maneuver matrix M,
containing the timesteps as columns and the extracted
maneuvers of each type as rows as shown in Fig. 2,
serves as a formalized abstract representation for fur-
ther processing.
Building on the trajectories and map data, the ma-
neuvers are identified with a rule-based algorithm also
used in previous work (King et al., 2021). Decelera-
tion, standstill and cruise maneuvers are calculated by
analyzing the vehicle speed, turn maneuvers by com-
paring the map with the position and yaw-angle of the
traffic participant.
3.2 Scenario Segmentation and
-Extraction
Since the recorded driving data can contain many
hours of driving and includes multiple scenarios, the
data is segmented to extract the scenarios. Depending
on the focus of the analysis, meaningful definitions
of start and end points can vary. We use a flexible
maneuver-based segmentation algorithm: The start
and end of the scenario is is determined by the change
of the state of a single maneuver type, as exemplarily
shown in Fig. 2. To get the maneuver matrix of the
scenario, the corresponding columns are cut out.
cruise decelerate standstill
no turn turn right no turn
S
A
S
B
S
C
t
Figure 2: Example abstraction of trajectories to “vehicle
state” and “turn” maneuvers. Segmentation of the scenarios
S
A
, S
B
and S
C
using “turn” maneuvers.
DATA 2022 - 11th International Conference on Data Science, Technology and Applications
238

vs
m
A
1
vs
m
A
2
vs
m
A
3
turn
m
A
1
turn
m
A
2
turn
m
A
3
vs
m
B
1
turn
m
B
1
turn
m
B
2
turn
m
B
3
M
A
vs
M
A
turn
M
B
vs
M
B
turn
σ
vs
σ
turn
S
A
S
B
σ(S
A
, S
B
) = σ
vs
+ σ
turn
Figure 3: Relationships between the maneuvers of the maneuver types “vehicle state” (vs) and “turn” (turn), their maneuver
sequences M, maneuver-similarities σ
t
and scenario-similarity σ for two scenarios.
3.3 Maneuver-based Scenario
Similarity
A generally valid definition of scenario similarities is
not possible, since different elements of the scenario
are in focus depending on the context. Therefore, the
methods to calculate such a similarity also vary. This
paper introduces a definition based on the maneuver
matrices of the scenarios. To determine the similar-
ity of the matrices, the maneuver types are compared
independently in a first step. The scenario similar-
ity is then a weighted sum of individual simmiliarities
w.r.t. to the different maneuver types used for repre-
sentation of the scenarios (Equ. 1, Fig. 3). Using the
definitions
• S
A
: Scenario with id A
• σ(S
A
, S
B
): similarity between the scenarios S
A
,
and S
B
,
• t: maneuver type (e.g. turn or vehicle state),
•
t
m
A
i
: maneuver at index i of scenario A
• M
A
t
= {
t
m
A
1
,
t
m
A
2
, . . . ,
t
m
A
n
}: maneuver sequence of
maneuver type t of scenario S
A
,
• σ
t
(M
A
t
, M
B
t
): similarity for the maneuver type t
between scenarios S
A
and S
B
,
• c
t
: weighting factor for different maneuver types,
the scenario similarity is calculated by:
σ(S
A
, S
B
) =
t
∑
c
t
· σ
t
(M
A
t
, M
B
t
) (1)
We use the pattern matching technique of se-
quence alignment on the maneuver sequences. For the
calculation of the sequence aligment the Needleman-
Wunsch algorithm (Needleman and Wunsch, 1970a)
is used. Sequence alignment was originally developed
for amino acid comparison (Needleman and Wunsch,
1970b), but is also used in other domains (Abbott and
Forrest, 1986) (
ˇ
Cavojsk
`
y and Drozda, 2019). The
similarity of the two sequences is determined by the
number of matches, mismatches and gaps between
two sequences of categorical data, like the maneuver
sequences (Fig. 4). The scores for matches, mis-
matches and gaps can be parameterized for various
analyses.
Figure 4: Match, Mismatch and Gap for sequence align-
ment of two categorical sequences.
A normalization step is performed for the results
of the sequence alignment, to keep the maximum sim-
ilarity independent of the length of the maneuver se-
quences:
σ
norm
=
σ
0, 5 · (n
A
+ n
B
)
, (2)
where n
S
is the number of maneuvers in scenario
S.
3.4 Graph-representation and
Visualization
The similarities between the scenarios form the ba-
sis for a graph-representation of the extracted scenar-
ios. Each node in the graph represents an extracted
scenario, each edge the calculated similarity between
these two scenarios. For visualization of the sce-
narios, state-of-the-art layout algorithms are used as
described in section 2.3. In our experience, multi-
dimensional scaling (Cox and Cox, 2008) gives the
best results for the scenario graphs. Nevertheless,
other layout methods, such as Fruchterman-Reingold
(Fruchterman and Reingold, 1991) and Kamada-
Kawai (Kamada et al., 1989), can be used.
4 EVALUATION
4.1 Dataset
For an exemplary evaluation, an intersection of the
INTERACTION dataset (Zhan et al., 2019) is used. It
contains recordings of urban traffic with various inter-
actions and was created using a drone. In addition to
the recorded trajectories, map data of the intersection
is included and used for the maneuver identification.
Maneuver-based Visualization of Similarities between Recorded Traffic Scenarios
239
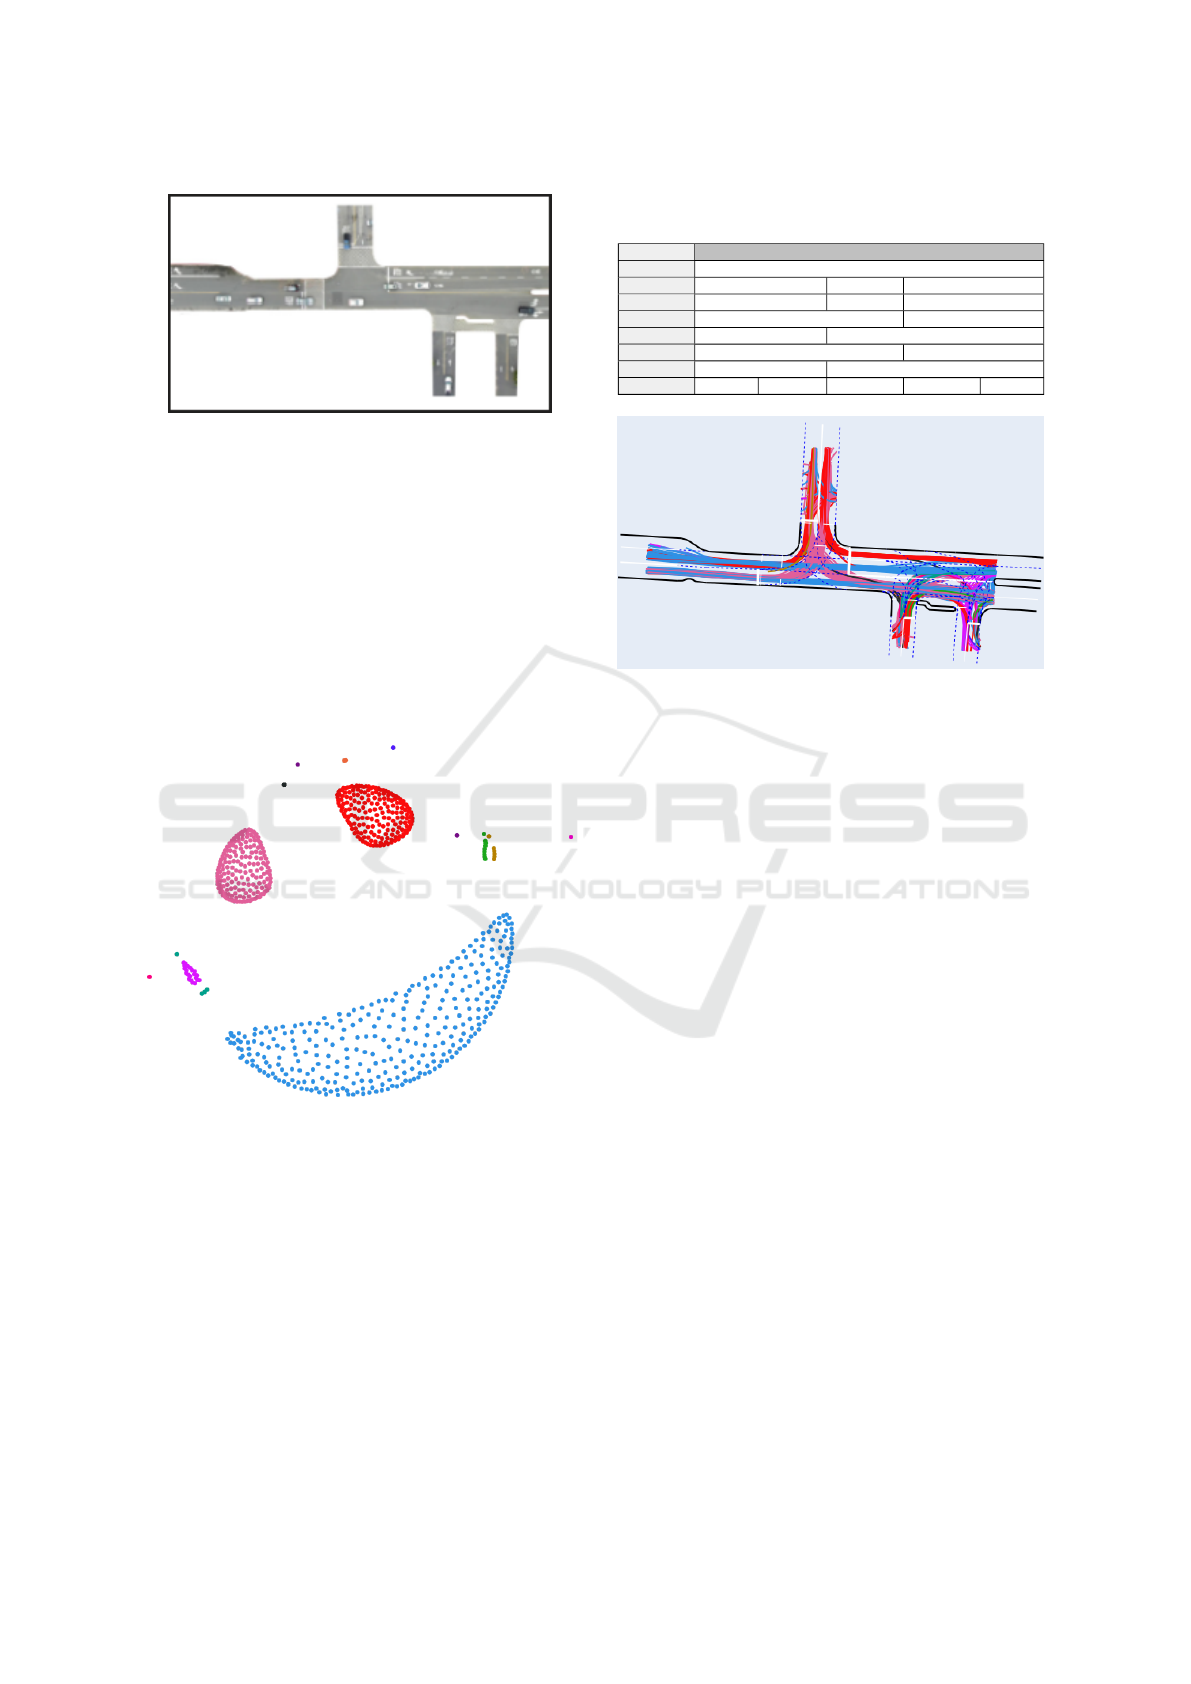
Figure 5: Considered intersection of the INTERACTION
dataset (Zhan et al., 2019).
Fig. 5 shows a snapshot of the intersection from the
drones perspective. The recording area of the selected
intersection includes four intersecting road segments
and thus a comparatively large variety of possible traf-
fic scenarios. The intersection records include a total
of 732 individual road users over approximately 45
minutes. All graphs are visualized using multidimen-
sional scaling as layout.
4.2 Grouping by Turn Maneuvers
Figure 6: Scenario graph visualization for turn maneuver
sequences for all scenarios while crossing the intersection.
In the visualization in Fig. 6 each point represents a
scenario. A scenario here contains the trajectories of
a participant over the whole intersection, so no seg-
mentation based on maneuvers is performed. For the
similarity, only the turn maneuvers are considered, so
in terms of the terminology introduced in section 3.3
this corresponds to c
vs
= 0 and c
turn
= 1. For valida-
tion purpose of the layout algorithm, the color repre-
sent the turn maneuver sequence of the corresponding
scenario. Table 1 shows the turn maneuver sequence
of selected groups, Fig. 7 the recorded trajectories
with the same color coding.
Table 1: Turn maneuver sequences of scenario groups in
Fig. 6.
group turn maneuver sequence
blue no turn
red no turn turn right no turn
pink no turn turn left no turn
brown no turn turn right
green turn right no turn
turquoise no turn turn left
purple turn left no turn
black no turn turn left no turn turn right no turn
Figure 7: Trajectories of scenarios in Fig. 6 on the intersec-
tion.
To validate the layout algorithm, the positions of
scenarios with equal turn maneuver sequences, repre-
sented by the color, are examined. As expected, sim-
ilar scenarios have smaller distance to each other and
form separated groups.
Additionally, similarities between the different
groups can be analyzed by looking at the relative po-
sitions of the groups: Scenarios of the purple and
turquoise groups, which have maneuver sequences
mixed of the blue and pink groups, are positioned in
between of these two groups. Also, the scenario in
the black group, that contains “turn left” and “turn
right” maneuvers intersparsed by “no turn” maneu-
vers, is positioned in the middle of the red and blue
groups, that contain either a “turn left” or a “turn
right” maneuver separated by “no turn” maneuvers.
Furthermore, a symmetry of right and left turn sce-
narios can be observed: The red and pink group, the
purple and the turquoise group and the brown and the
green group, which all contain equivalent maneuver
sequences regarding the turn direction, are mirrored
on an axis. The scenario of group f, containing a “turn
left” and a “turn right” maneuver, and the middle of
the blue group, containing no turn maneuvers, is part
of this axis.
The visualization also gives a fast impression of
the frequency of the scenarios: there are almost equal
numbers of left and right turn scenarios, but most of
the participants do not perform a turn maneuver.
DATA 2022 - 11th International Conference on Data Science, Technology and Applications
240

4.3 Grouping by Turn and Vehicles
State Maneuvers
Figure 8: Scenario graph visualization for a combination
“turn” and “vehicle state” maneuver sequences during turn
scenarios.
Table 2: “Vehicle state” maneuver sequences scenario
groups in Fig. 8.
group vehicle state maneuver sequence
blue cruise
red standstill decelerate
green decelerate cruise
purple cruise decelerate
black decelerate standstill cruise
pink cruise decelerate cruise
brown cruise decelerate standstill cruise
others various longer combinations of vehicle state maneuvers
The scenarios in Fig. 8 are segmented by turn ma-
neuver type and filtered for “turn left” or “turn right”
maneuver during the scenario. Hence, only trajecto-
ries during a left or right turn are considered. The
turn maneuver with a weight of c
turn
= 0.1 and the
vehicle state with a weight of c
vs
= 0.9 form the cal-
culation of the similarities. The color represents the
vehicle state maneuver series, the shape the turn di-
rection (turn right: diamond, turn left: circle).
Similar to the previous graph, scenarios with the
same maneuver sequence are mapped close to each
other and form groups. The combination of both, ve-
hicle state and turn maneuvers, lead to symmetrical
positions of the scenarios. “Turn right” maneuvers
(diamond) are mapped on the right, “turn left” maneu-
vers (circle) on the left, groups with the same vehicle
state maneuver sequences (same color) are opposite
each other. Most of the scenarios have maneuver se-
quences with a maximum of two maneuvers (blue, red
and green groups). The length of the maneuver se-
quence grows from bottom to top of the graph. The
size of the groups decreases with the length of the ma-
neuver sequence. The share of scenarios without de-
celeration or standstill maneuvers (blue groups) in the
total number of scenarios is lower for left turn scenar-
ios, which is plausible considering the traffic rules for
the intersection.
Figure 9: Scenario graph visualization for a combination
“turn” and “vehicle state” maneuver sequences for all sce-
narios.
Fig. 9 shows an extension of the previous Fig. 8,
where additional to the “turn right” an “turn left” sce-
narios also all scenarios with the “no turn” maneuver
are included. So the entire recorded data is visual-
ized in the graph. The calculations for the similarity
remains the same as in the previous graph, the color
represents the combination of turn and vehicle state
maneuver series.
Some large, well-separated groups of similar scenar-
ios can be identified, formed by scenarios with short
maneuver sequences. Like in the previous graphs,
groups with similar maneuver sequences are arranged
close to each other.
In regions with scenarios of larger maneuver se-
quences, fewer groups are formed. In addition, there
are a number of outliers that cannot be assigned to any
group.
4.4 Benefits for Scenario-based Testing
This visible redundancy and outlier detection brings
several benefits for the use of the scenarios in the
scenario-based testing workflow: Instead of working
on the complete set of scenarios, each group can be
represented by one member. Rare, and therefore pos-
sibly unknown scenarios, can be easily identified in
Maneuver-based Visualization of Similarities between Recorded Traffic Scenarios
241

a visual manner or following automated processing.
E.g. the participant in Fig. 6 which drives a trajectory
that is not allowed by the traffic rules of the consid-
ered intersection, is shown isolated in the graph. Fur-
ther, correlations between the maneuvers in the sce-
narios can be identified. E.g. “turn left” maneuvers
occur more often in a combination with standstill than
“turn right” maneuvers (Fig. 8). The frequency of
the detected scenarios can be a basis for prioritization
of test scenarios. Analysis and visualization of the
scenario space make the frequency of scenarios intu-
itively visible and is thus a support for specification
and test engineers.
5 CONCLUSION AND FUTURE
WORK
Scenario-based testing is supposed to play a sig-
nificant role in the testing of highly automated
vehicles, but the building of a scenario catalog and
the selection of the relevant scenarios for efficient
testing is up to now an unanswered question. In this
paper, we support to master these challenges with
the use of recorded traffic data. For this purpose,
the data is represented in a scenario-graph structure.
The extraction of maneuvers builds the basis for
a semantic interpretation of the data. To describe
similarities between the scenarios, a metric based
on the maneuvers is introduced. Interpreting the
similarities as the weights of a graph, state-of-the-art
methods for graph visualizations create an intuitive
representation for the scenario catalog. The concept
was exemplary applied to a dataset of urban traffic
on an intersection. The created graphs show how
this representation can present a rich variety of
information in a compact way, including information
on which scenarios have occurred, how the scenarios
can be grouped, with what frequency these groups
occur and whether there are any outliers that need
special attention or represent previously unknown
scenarios. This analysis supports the building of
a scenario catalog from data and increases the test
coverage for highly automated vehicles efficiently
by selecting suitable test scenarios. In addition, the
method can be used flexibly, since different maneu-
vers and weights can be selected for composing a
suitable similarity measure depending on the use case.
Future work will focus on various maneuvers and
datasets, also including data from simulation tools.
Additional similarity metrics, using maneuver or tra-
jectories without abstraction, will be evaluated. Based
on the positions of the scenarios in the visualization
of a graph, a clustering algorithm could automatically
find clusters of the scenarios and outliers.
ACKNOWLEDGEMENTS
The research leading to these results is funded by the
German Federal Ministry for Economic Affairs and
Climate Action” within the project “Verifikations-
und Validierungsmethoden automatisierter Fahrzeuge
im urbanen Umfeld”. The authors would like to thank
the consortium for the successful cooperation.”
REFERENCES
Abbott, A. and Forrest, J. (1986). Optimal matching meth-
ods for historical sequences. The Journal of Interdis-
ciplinary History, 16(3):471–494.
ASAM (2020). OpenSCENARIO. https://www.asam.net/
standards/detail/openscenario/. Accessed 2022-03-01.
Bach, J. (2018). Methoden und Ans
¨
atze f
¨
ur die Entwick-
lung und den Test pr
¨
adiktiver Fahrzeugregelungsfunk-
tionen. PhD thesis, KIT.
Bagschik, G., Menzel, T., and Maurer, M. (2018). Ontol-
ogy based scene creation for the development of au-
tomated vehicles. In 2018 IEEE Intelligent Vehicles
Symposium (IV), pages 1813–1820. IEEE.
Bagschik, G., Menzel, T., Reschka, A., and Maurer, M.
(2017). Szenarien f
¨
ur Entwicklung, Absicherung und
Test von automatisierten Fahrzeugen. In 11. Workshop
Fahrerassistenzsysteme. Uni-DAS e. V, pages 125–
135.
Balasubramanian, L., Wurst, J., Botsch, M., and Deng, K.
(2021). Traffic scenario clustering by iterative opti-
misation of self-supervised networks using a random
forest activation pattern similarity.
Bastian, M., Heymann, S., and Jacomy, M. (2009). Gephi:
an open source software for exploring and manipu-
lating networks. In Proceedings of the International
AAAI Conference on Web and Social Media.
Batagelj, V. and Mrvar, A. (1998). Pajek-program for large
network analysis. Connections, 21(2):47–57.
Borgatti, S. P., Everett, M. G., and Freeman, L. C. (2002).
Ucinet for windows: Software for social network anal-
ysis. Harvard, MA: analytic technologies, 6.
Braun, T., Ries, L., K
¨
ortke, F., Turner, L. R., Otten, S., and
Sax, E. (2021). Collection of requirements and model-
based approach for scenario description. In VEHITS,
pages 634–645.
ˇ
Cavojsk
`
y, M. and Drozda, M. (2019). Comparison of user
trajectories with the needleman-wunsch algorithm. In
International Conference on Mobile Computing, Ap-
plications, and Services, pages 141–154. Springer.
Cox, M. A. and Cox, T. F. (2008). Multidimensional scal-
ing. In Handbook of data visualization, pages 315–
347. Springer.
DATA 2022 - 11th International Conference on Data Science, Technology and Applications
242

Fruchterman, T. M. and Reingold, E. M. (1991). Graph
drawing by force-directed placement. Software: Prac-
tice and experience, 21(11):1129–1164.
Gansner, E. R., Koren, Y., and North, S. (2004). Graph
drawing by stress majorization. In International Sym-
posium on Graph Drawing, pages 239–250. Springer.
Hartjen, L., Philipp, R., Schuldt, D. F., Friedrich, P. D. B.,
and Howar, P. D. F. (2019a). Classification of driving
maneuvers in urban traffic for parametrization of test
scenarios. In 9. Tagung Automatisiertes Fahren.
Hartjen, L., Philipp, R., Schuldt, F., and Friedrich, B.
(2020). Saturation effects in recorded maneuver data
for the test of automated driving. Highway Res. Rec.
Hartjen, L., Schuldt, F., and Friedrich, B. (2019b). Seman-
tic classification of pedestrian traffic scenarios for the
validation of automated driving. In 2019 IEEE In-
telligent Transportation Systems Conference (ITSC),
pages 3696–3701. IEEE.
ISO21448 (2019). ISO/PAS 21448: 2019 Road Vehicles
Safety of the Intended Functionality. Norm, Interna-
tional Organization for Standardization.
Kalra, N. and Paddock, S. M. (2016). Driving to safety:
How many miles of driving would it take to demon-
strate autonomous vehicle reliability? Transportation
Research Part A: Policy and Practice, 94:182–193.
Kamada, T., Kawai, S., et al. (1989). An algorithm for draw-
ing general undirected graphs. Information processing
letters, 31(1):7–15.
King, C., Braun, T., Braess, C., Langner, J., and Sax, E.
(2021). Capturing the variety of urban logical sce-
narios from bird-view trajectories. In VEHITS, pages
471–480.
Klimenta, M. (2012). Extending the usability of multidi-
mensional scaling for graph drawing. PhD thesis,
Citeseer.
Kobourov, S. G. (2012). Spring embedders and force di-
rected graph drawing algorithms.
Koopman, P. and Wagner, M. (2018). Toward a framework
for highly automated vehicle safety validation. SAE
International Journal of Engines, 11(2018-01-1071).
Langner, J., Grolig, H., Otten, S., Holz
¨
apfel, M., and Sax,
E. (2019). Logical scenario derivation by clustering
dynamic-length-segments extracted from real-world-
driving-data. In VEHITS, pages 458–467.
Lizenberg, V., Alkurdi, M. R., Eberle, U., and K
¨
oster, F.
(2021). Intelligent co-simulation framework for co-
operative driving functions. In 2021 IEEE 17th In-
ternational Conference on Intelligent Computer Com-
munication and Processing (ICCP), pages 109–115.
IEEE.
Needleman, S. B. and Wunsch, C. D. (1970a). A gen-
eral method applicable to the search for similarities
in the amino acid sequence of two proteins. Journal
of Molecular Biology, 48(3):443–453.
Needleman, S. B. and Wunsch, C. D. (1970b). A gen-
eral method applicable to the search for similarities
in the amino acid sequence of two proteins. Journal
of molecular biology, 48(3):443–453.
Neurohr, C., Westhofen, L., Butz, M., Bollmann, M. H.,
Eberle, U., and Galbas, R. (2021). Criticality Anal-
ysis for the Verification and Validation of Automated
Vehicles. IEEE Access, 9:18016–18041.
Neurohr, C., Westhofen, L., Henning, T., de Graaff, T.,
M
¨
ohlmann, E., and B
¨
ode, E. (2020). Fundamental
considerations around scenario-based testing for au-
tomated driving. In 2020 IEEE Intelligent Vehicles
Symposium (IV), pages 121–127. IEEE.
Pavlopoulos, G. A., Paez-Espino, D., Kyrpides, N. C., and
Iliopoulos, I. (2017). Empirical comparison of visu-
alization tools for larger-scale network analysis. Ad-
vances in bioinformatics, 2017.
PEGASUS (2019). Pegasus method - an overview.
https://www.pegasusprojekt.de/files/tmpl/Pegasus-
Abschlussveranstaltung/PEGASUS-Gesamtmethode.
pdf. Accessed: 2022-03-01.
PEGASUS (2020). PEGASUS - Schlussbericht.
https://www.pegasusprojekt.de/de/pegasus-
abschlussveranstaltung. Accessed: 2022-03-01.
Perianes-Rodriguez, A., Waltman, L., and Van Eck, N. J.
(2016). Constructing bibliometric networks: A com-
parison between full and fractional counting. Journal
of Informetrics, 10(4):1178–1195.
Pfeffer, R. (2020). Szenariobasierte simulationsgest
¨
utzte
funktionale Absicherung hochautomatisierter
Fahrfunktionen durch Nutzung von Realdaten.
PhD thesis, Karlsruher Institut f
¨
ur Technologie (KIT).
Ponn, T., Gnandt, C., and Diermeyer, F. (2019). An
optimization-based method to identify relevant sce-
narios for type approval of automated vehicles. In Pro-
ceedings of the ESV—International Technical Confer-
ence on the Enhanced Safety of Vehicles, Eindhoven,
The Netherlands, pages 10–13.
Ries, L., Rigoll, P., Braun, T., Schulik, T., Daube, J., and
Sax, E. (2021). Trajectory-based clustering of real-
world urban driving sequences with multiple traffic
objects. In 2021 IEEE International Intelligent Trans-
portation Systems Conference (ITSC), pages 1251–
1258. IEEE.
Ries, L., Stumpf, M., Bach, J., and Sax, E. (2020). Se-
mantic comparison of driving sequences by adapta-
tion of word embeddings. In 2020 IEEE 23rd Interna-
tional Conference on Intelligent Transportation Sys-
tems (ITSC), pages 1–7.
Scholtes, M., Westhofen, L., Turner, L. R., Lotto, K.,
Schuldes, M., Weber, H., Wagener, N., Neurohr, C.,
Bollmann, M. H., K
¨
ortke, F., et al. (2021). 6-layer
model for a structured description and categoriza-
tion of urban traffic and environment. IEEE Access,
9:59131–59147.
Shannon, P., Markiel, A., Ozier, O., Baliga, N. S., Wang,
J. T., Ramage, D., Amin, N., Schwikowski, B., and
Ideker, T. (2003). Cytoscape: a software environment
for integrated models of biomolecular interaction net-
works. Genome research, 13(11):2498–2504.
Theocharidis, A., Van Dongen, S., Enright, A. J., and Free-
man, T. C. (2009). Network visualization and analysis
of gene expression data using biolayout express 3d.
Nature protocols, 4(10):1535–1550.
Thimm, O., Bl
¨
asing, O., Gibon, Y., Nagel, A., Meyer, S.,
Kr
¨
uger, P., Selbig, J., M
¨
uller, L. A., Rhee, S. Y., and
Maneuver-based Visualization of Similarities between Recorded Traffic Scenarios
243

Stitt, M. (2004). Mapman: a user-driven tool to dis-
play genomics data sets onto diagrams of metabolic
pathways and other biological processes. The Plant
Journal, 37(6):914–939.
VVM (2020). V&V Methoden. https://www.vvm-projekt.
de/konzept. Accessed: 2022-03-01.
Wachenfeld, W. and Winner, H. (2015). Die Freigabe des
autonomen Fahrens. In Autonomes Fahren, pages
439–464. Springer Vieweg, Berlin, Heidelberg.
Weber, N., Thiem, C., and Konigorski, U. (2021). A needle
in a haystack–how to derive relevant scenarios for test-
ing automated driving systems in urban areas. arXiv
preprint arXiv:2109.03648.
Zhan, W., Sun, L., Wang, D., Shi, H., Clausse, A., Nau-
mann, M., K
¨
ummerle, J., K
¨
onigshof, H., Stiller, C.,
de La Fortelle, A., and Tomizuka, M. INTERACTION
Dataset: An INTERnational, Adversarial and Cooper-
ative moTION Dataset in Interactive Driving Scenar-
ios with Semantic Maps. arXiv:1910.03088 [cs, eess].
DATA 2022 - 11th International Conference on Data Science, Technology and Applications
244
