
Design Guidelines for a Team Formation and Analytics Software
Bowen Hui, Opey Adeyemi, Mathew de Vin, Callum Takasaka and Brianna Marshinew
Computer Science, University of British Columbia, Kelowna, Canada
Keywords:
Team Formation, Team Analytics, Learning Analytics, Design Guidelines.
Abstract:
Many researchers over the past several decades studied the success factors of a team. Despite much research
efforts, there is still no consensus on how a team should ideally be formed. Consequently, how one decides
to form teams in a class depends on the domain, classroom context, and pedagogical objectives. Therefore,
software used to support an instructor in forming teams must be flexible enough to accommodate a variety
of use case scenarios. In this work, we review the general team formation process and summarize our devel-
opment efforts in building a team formation and analytics software over the past four years. We found two
advantages of using learning analytics in our software: (i) to gain the user’s trust in the system and (ii) to
help the user assess whether the suggested teams are balanced and which modifications should be made if any.
Based on our experience, we present design recommendations for developing team formation software that
reveals challenges and opportunities, especially in combination with learning analytics.
1 INTRODUCTION
Many classes involve team-based activities to foster
collaborative learning. The common steps in gener-
ating teams are illustrated in Figure 1. As illustrated
in Steps 1-4 of Figure 1, in most cases, the instruc-
tor forms teams once at the beginning of the class and
have the teams work together on a project or multi-
ple activities together throughout the course. In an-
other setting, the instructor may wish to form differ-
ent teams that change based on the milestone. These
additional steps are indicated as Steps 5-6 in Figure 1.
A common example is university science labs that
typically run weekly. In these labs, students often
work in pairs or groups of three’s to complete the lab
assignment. To mix up domain and teamwork skill
levels, the instructor may change these teams each
week. These changes may also consider peer eval-
uation feedback. Thus, educational technology that
offers the ability to form teams needs to support these
common use case scenarios.
Over the past several decades, many researchers
have studied what makes a team successful (Nav-
imipour and Charband, 2016; McEwan et al., 2017;
National Research Council, 2015; Spoelstra et al.,
2014). From the perspective of how teams should
initially be formed, researchers have studied differ-
ent compositions of team members’ characteristics in
different domain contexts. The variety of character-
Figure 1: The team generation process. Steps 1-4 illustrate
the most common use case and Steps 5-6 include peer eval-
uation feedback in a secondary use case.
istics that have been considered includes at least the
team member’s personality traits, attitudes and goals,
skills, social preferences, and time availability (Al-
fonseca et al., 2006; M. et al., 2018; Hastings et al.,
2018; Alberola et al., 2016). Where projects exist,
team member skills are matched against project re-
quirements to guarantee some level of success. While
these are common team composition parameters dis-
cussed in the literature, there is no consensus as to
how a team should ideally be formed due to the
conflicting empirical results that have been reported
(Takai and Esterman, 2017). Consequently, how one
decides to form teams in a class will depend on the
domain, classroom context, as well as pedagogical
504
Hui, B., Adeyemi, O., de Vin, M., Takasaka, C. and Marshinew, B.
Design Guidelines for a Team Formation and Analytics Software.
DOI: 10.5220/0011138000003182
In Proceedings of the 14th International Conference on Computer Supported Education (CSEDU 2022) - Volume 1, pages 504-513
ISBN: 978-989-758-562-3; ISSN: 2184-5026
Copyright
c
2022 by SCITEPRESS – Science and Technology Publications, Lda. All rights reserved

objectives. For this reason, team formation software
must be designed in a general enough way to accom-
modate the range of the instructor’s needs which are
a function of their pedagogical objectives.
Current approaches to assigning teams in class-
rooms often have limitations that do not generalize
well. In some cases, teams are randomly assigned
based on a class list. However, this only works if we
do not need to consider student preferences and skills
or other pedagogical criteria. Alternatively, we can
ask students to self-select their teams. Unfortunately,
this often results in unbalanced teams (Layton et al.,
2010; Post et al., 2020; Fischer et al., 2020) or situa-
tions where students are singled out because they do
not know others in the class or do not get along with
them. Ideally, we would like to form teams based
on specific pedagogical objectives that the instruc-
tor identifies and elicit additional information needed
from the students, whether it be their traits, attitudes,
skills, or preferences. If the course has projects, the
instructor may wish to optimize team assignments to
increase the chance of project success. It is easy to
see that the general team formation problem involves
many constraints and individual preferences that po-
tentially conflict with each other. With small class
sizes, it is possible to manually form teams follow-
ing this process. However, this strategy does not scale
to large class sizes and we must turn to software de-
signed for solving this complex problem.
In previous work, we built a team formation and
analytics software and evaluated it in various settings
including benchmarking simulations and preliminary
classroom feasibility studies (Hui et al., 2022; Bulmer
et al., 2020; Bulmer, 2021). The purpose of this work
is to summarize the findings from our classroom stud-
ies, demonstrate the new Visual Analytics component
that has been added to the system, and provide initial
feedback from our ongoing classroom studies. Our
experience over the past four years has shown that
there is still much room for contributions, particularly
in the design and use of team analytics. Based on our
experience, we provide a set of design guidelines for
designing team formation and analytics software as
our main contribution. These guidelines reveal chal-
lenges and serve as a resource to practitioners work-
ing on advancing the state-of-the-art in this area.
2 LITERATURE REVIEW
In this section, we review general-purpose team for-
mation software that builds teams based on inputted
student information and pedagogical criteria. We fo-
cus on educational technologies that enable instruc-
tors to form teams in their classes. Given this scope,
we are only aware of three such systems: GRumbler,
Team-Match, and CATME.
GRumbler (Group Rumbler) (Sparrow, 2011) is
designed for an experienced user of Excel and users
are recommended to dedicate an hour to the tutorial
before using it for their classes. Since GRumbler is
a spreadsheet, the interface is less user-friendly than
the web applications in comparison. The user needs to
input all the student data into the spreadsheet and all
the teams are generated within the spreadsheet. The
spreadsheet allows a large number of student char-
acteristics to be specified so that the algorithm can
take the information as constraints when forming the
teams. The algorithm is designed to diversify students
with the same values of the characteristics across
teams, although gender is handled as an exception and
can be diversified or clustered together. GRumbler al-
lows for an enemies exclusion list, but not a friends
inclusion list. The user can specify a weight for each
constraint in the spreadsheet to assign different prior-
ities to those constraints. Lastly, GRumbler can gen-
erate sequences of team assignments using the same
diversification approach by having students assigned
to teams with different members. Thus, it does not
consider peer evaluation feedback in the process.
Team-Match is a web application that emphasizes
personality and cognitive styles in the team forma-
tion process (Team-Match, 2012). The application is
hosted by an American company. A key difference
with this system is that part of the elicitation setup re-
quires the students to complete a psychometric test so
that they would get a personalized personality report
that helps them understand their interpersonal skills
and teamwork styles. It is unclear if other types of
questions can be created by the instructor and used
in the elicitation step, but the product advertises the
importance to diversify the types of students (e.g., de-
mographics), their skill sets, and their skill levels to
create balanced teams. The product has been used in
various American universities and has received posi-
tive feedback, including a high level of student satis-
faction, improvement in work quality, and an increase
in fairness and student integration. It appears that the
product does not have a peer evaluation component.
The application also generates team reports that en-
able teams to view how they are doing so they can
monitor their performance. Unfortunately, details of
these reports were not available.
CATME (Comprehensive Assessment of Team
Member Effectiveness) is a web application built in
2002 that enables instructors to specify criteria to
form teams (Layton et al., 2010; Ohland et al., 2012).
CATME was originally free to use but eventually
Design Guidelines for a Team Formation and Analytics Software
505
moved to a software-as-a-service for institutions. The
main features of this application are the automation
of the team formation process by gathering survey re-
sponses from students as part of this application and
the peer evaluation assessments provided in the ap-
plication. The application offers several default ques-
tions for instructors to use as part of the survey in the
initial elicitation step, but the instructor can also cre-
ate new questions. After the students complete the
survey, the instructor specifies team formation crite-
ria through the web interface to generate teams. Once
teams are generated, the instructor cannot change
them. If the instructor wishes to explore another way
of generating the teams, a new set of criteria must be
specified to generate a new set of teams. Graphs are
used to show the detailed distributions of individual
characteristics for each team and an overall compli-
ance score for each team is presented for compari-
son purposes. The peer evaluation component allows
students to complete evaluations about themselves or
their team members. In contrast to the general pro-
cess illustrated in Figure 1, this feedback is not used
to generate new teams, if the instructor wishes to form
teams multiple times in the course. An underlying
goal of CATME is to guide instructors to forming ef-
fective teams and to assist students in becoming bet-
ter team players. Thus, at times, the interface can
be more cluttered than necessary and the surveys can
have too much information.
To our knowledge, all three systems exist as inde-
pendent applications and are not integrated with any
learning management systems (LMS). This means
there is more initial class list setup and data coordi-
nation for getting the team list and peer evaluation re-
sults into the LMS. Furthermore, these systems focus
on creating teams based on student characteristics and
diversifying students across teams. It does not appear
that any of these systems support the team formation
needs in project courses by considering student skill
sets, project requirements, and students’ project pref-
erences. Aside from GRumbler, teams suggested by
Team-Match and CATME cannot be modified manu-
ally; modifications must be made by specifying new
criteria to regenerate the entire set of teams. Lastly,
team analytics has not been a focus in these systems.
While some forms of analytics exist in Team-Match
and CATME, the details are not clear.
3 TEAMABLE ANALYTICS
Teamable Analytics is implemented as a Django ap-
plication with a PostgreSQL database on Amazon
web services and runs on multi-container Elastic
Beanstalk using Nginx, app, and worker (Hui et al.,
2022). The tool will be released as open-source in
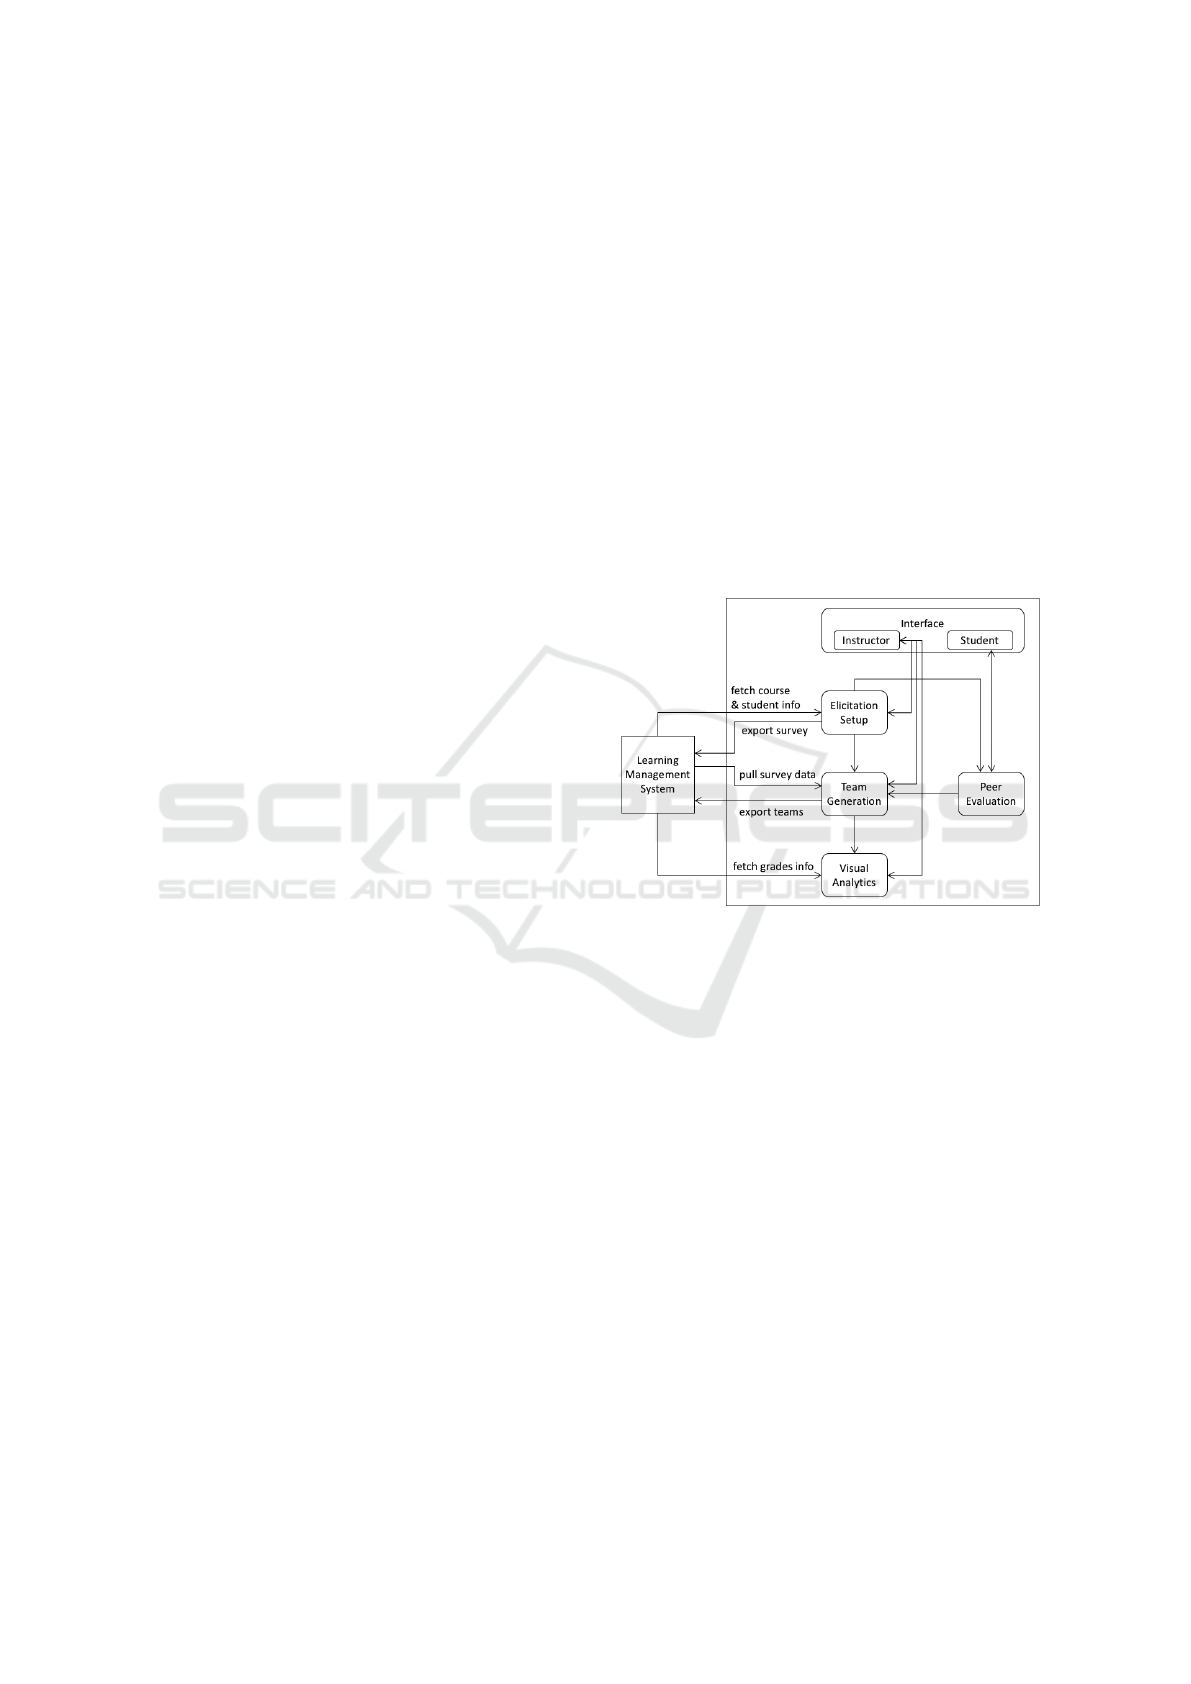
August 2022. Its general architecture is shown in Fig-
ure 2. The system is designed to support all the use
case scenarios outlined in the general team generation
process. It has the following instructor components:
Elicitation Setup, Team Generation, and Visual An-
alytics. Since our system gathers information from
the LMS, students do not need to interact with the
software if there are no peer evaluations in the course.
For students who are constantly asked to learn and use
new technologies these days, not having to learn an-
other software for administrative purposes can allevi-
ate unnecessary stress. If peer evaluations are present,
Teamable Analytics has the following student compo-
nents: Student Interface, and Peer Evaluations. Each
component is described below.
Figure 2: System architecture for Teamable Analytics.
3.1 Instructor Components
The main user of the system is the instructor of a
course. The tool is designed to support the instruc-
tor from getting course information (e.g., sections and
students) to eliciting student preferences to specifying
pedagogical criteria to generating teams.
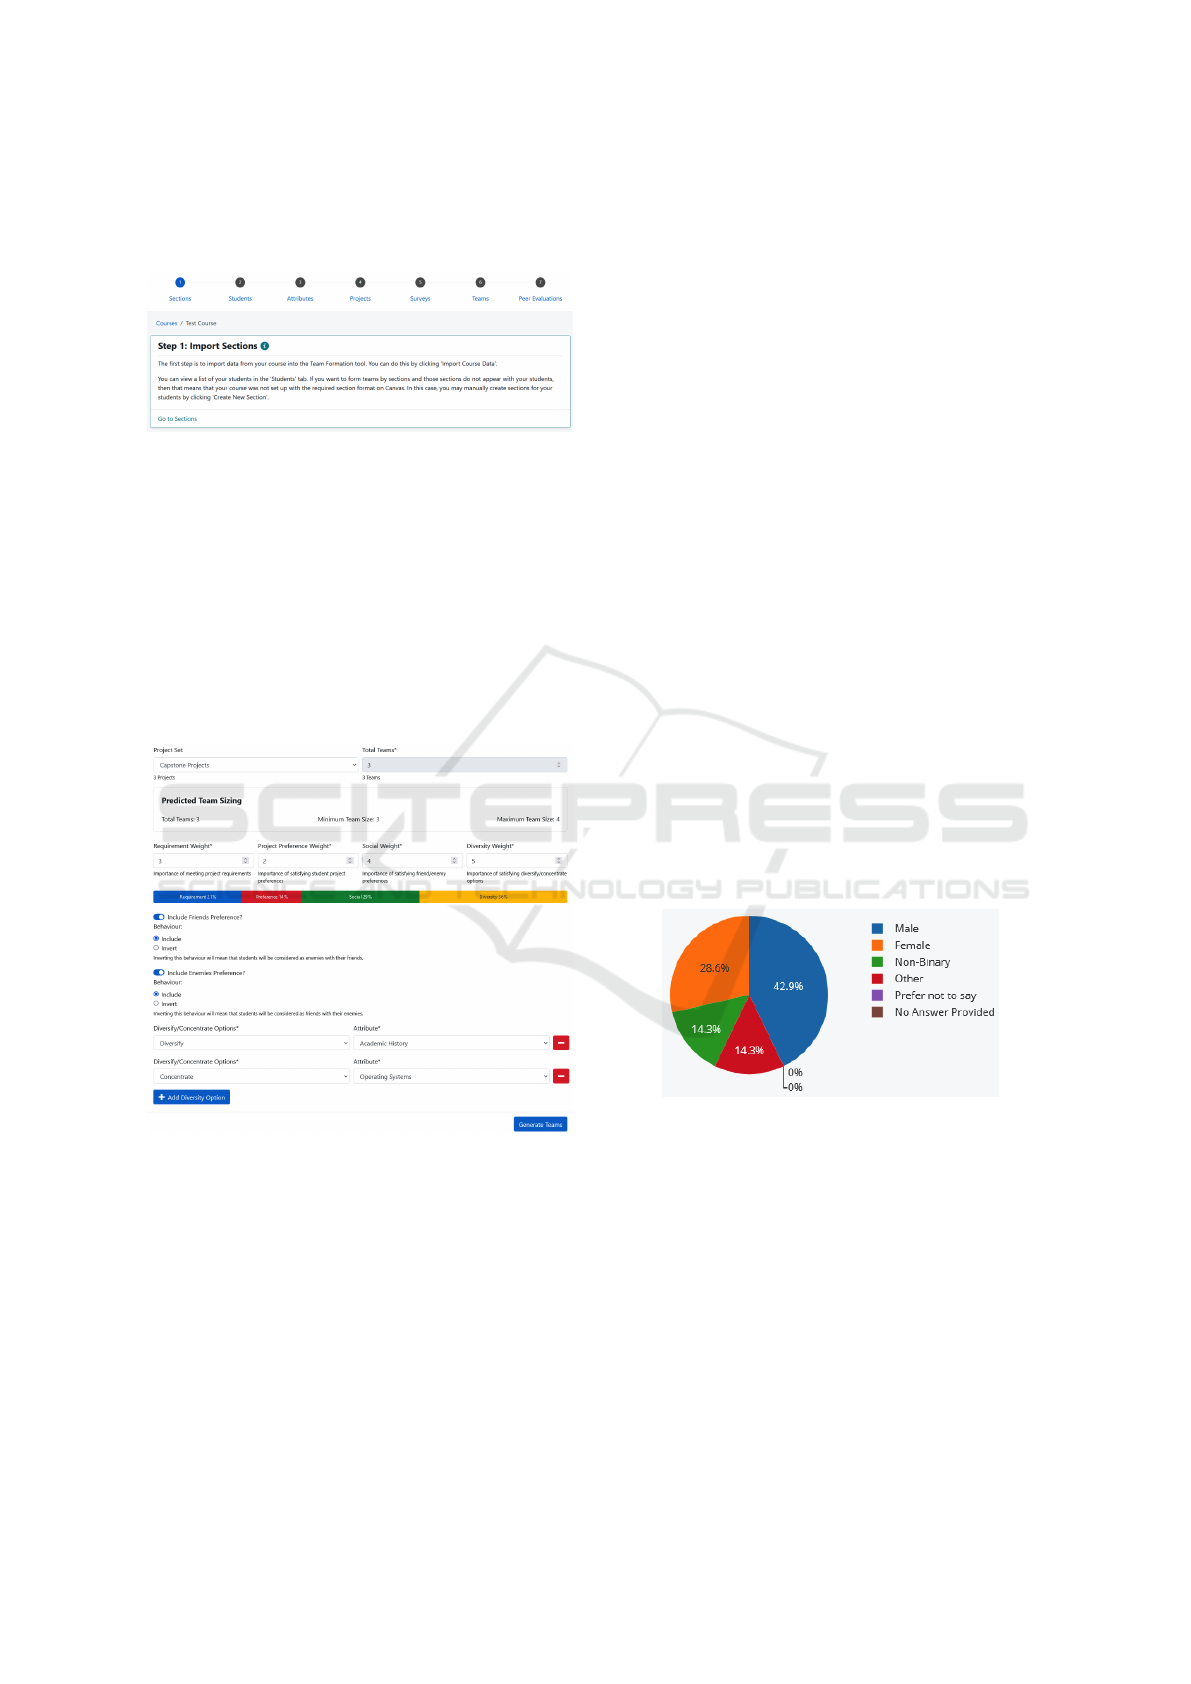
3.1.1 Elicitation Setup
This component provides a process stepper shown in
Figure 3 that guides the user through each step of
the setup. The stepper appears at the top of every
page and the details are automatically hidden if the
user has visited the page before. Instructions are pro-
vided for each step of the process, including: import-
ing course information (sections and students), defin-
ing attributes that represent student traits, skills, and
preferences, defining attributes that represent project
requirements (if projects are involved), creating a sur-
vey with questions based on attributes to elicit the data
A2E 2022 - Special Session on Analytics in Educational Environments
506
from the students, and gathering the responses from
the completed survey. Once the instructor has all the
information, the next step is to generate teams.
Figure 3: A process stepper to guide the instructor.
3.1.2 Team Generation
Currently, the system supports a random algorithm
and a weight algorithm. The key advantages of the
weight algorithm are its ability to handle many types
of competing constraints, form teams quickly, and
offer competitive benchmarking results against other
exact algorithms (Bulmer et al., 2020). As shown in
Figure 4, a customizable dashboard for the weight al-
gorithm is presented to the instructor to choose the
parameters for generating teams.
Figure 4: Instructor dashboard for setting team composition
parameters.
On this dashboard, the instructor can set the im-
portance of four types of constraints by defining their
relative weightings. These types are social prefer-
ences (i.e., students’ preferences on being in the same
team as their friends or on being in a different team
from their enemies), project preferences (i.e., stu-
dents’ preferences on project options), project re-
quirements (i.e., student skill sets and levels needed
for each project so to guarantee project success), and
diversity preferences (i.e., student traits and character-
istics that should be diversified across teams or clus-
tered on the same teams). The user can specify more
than one attribute to diversify or cluster together, de-
pending on the needs of the scenario.
3.1.3 Visual Analytics
The findings of our initial pilot studies (see Sec-
tion 4.1) identified specific areas of concern that led
to the creation of this new analytics component. The
purpose of this component is to help the instructor
quickly and effectively assess whether the suggested
teams match the desired pedagogical objectives.
The goal is to use visual analytics as a tool to rea-
son about the suggested teams and change specific
team memberships if needed. Our analytics provide a
snapshot of the relevant student characteristics so the
instructor can inspect a team to determine if it is prob-
lematic or not. For example, if the instructor wanted
to diversify female students across all the teams in
a male-dominated class but sees that one team has
several females in it, the visual analytics should of-
fer a representation that reflects this pattern. Once
the instructor scans the analytics and finds problem-
atic patterns, the user can manually move individuals
to different teams and update the visualizations again.
Alternatively, the instructor can regenerate the set of
teams entirely using different criteria. This editing
process can be repeated as much as needed. Once the
instructor is satisfied with the teams, the suggested
teams can be exported to the course LMS.
Figure 5: Pie chart for gender distribution in a team.
First, the instructor identifies the attributes they
wish to visualize. Depending on the data types
of these attributes, compatible visualizations will be
available for selection. The system’s visual analytics
currently support a pie chart, tally summary, compar-
ison bar graph, radar graph, checklist, and heat map.
Examples of each type of visualization are shown
in Figures 5 to 10. In all of these cases, the sys-
tem has both team-level and individual-level visual-
izations so the instructor can easily see problematic
patterns across teams or delve deeper into the individ-
ual responses within a team to diagnose the problem.
In Figure 5, a pie chart is used to illustrate the gender
Design Guidelines for a Team Formation and Analytics Software
507
distribution in a team along with the legend of possi-
ble student responses. Alternatively, this data can be
shown in a list of tallies like Figure 6 or as a bar graph
like in Figure 7. These visualization options differ in
their ease of interpretability. The system provides rec-
ommendations for visualizing each type of data, but
the choice is ultimately left in the user’s control.
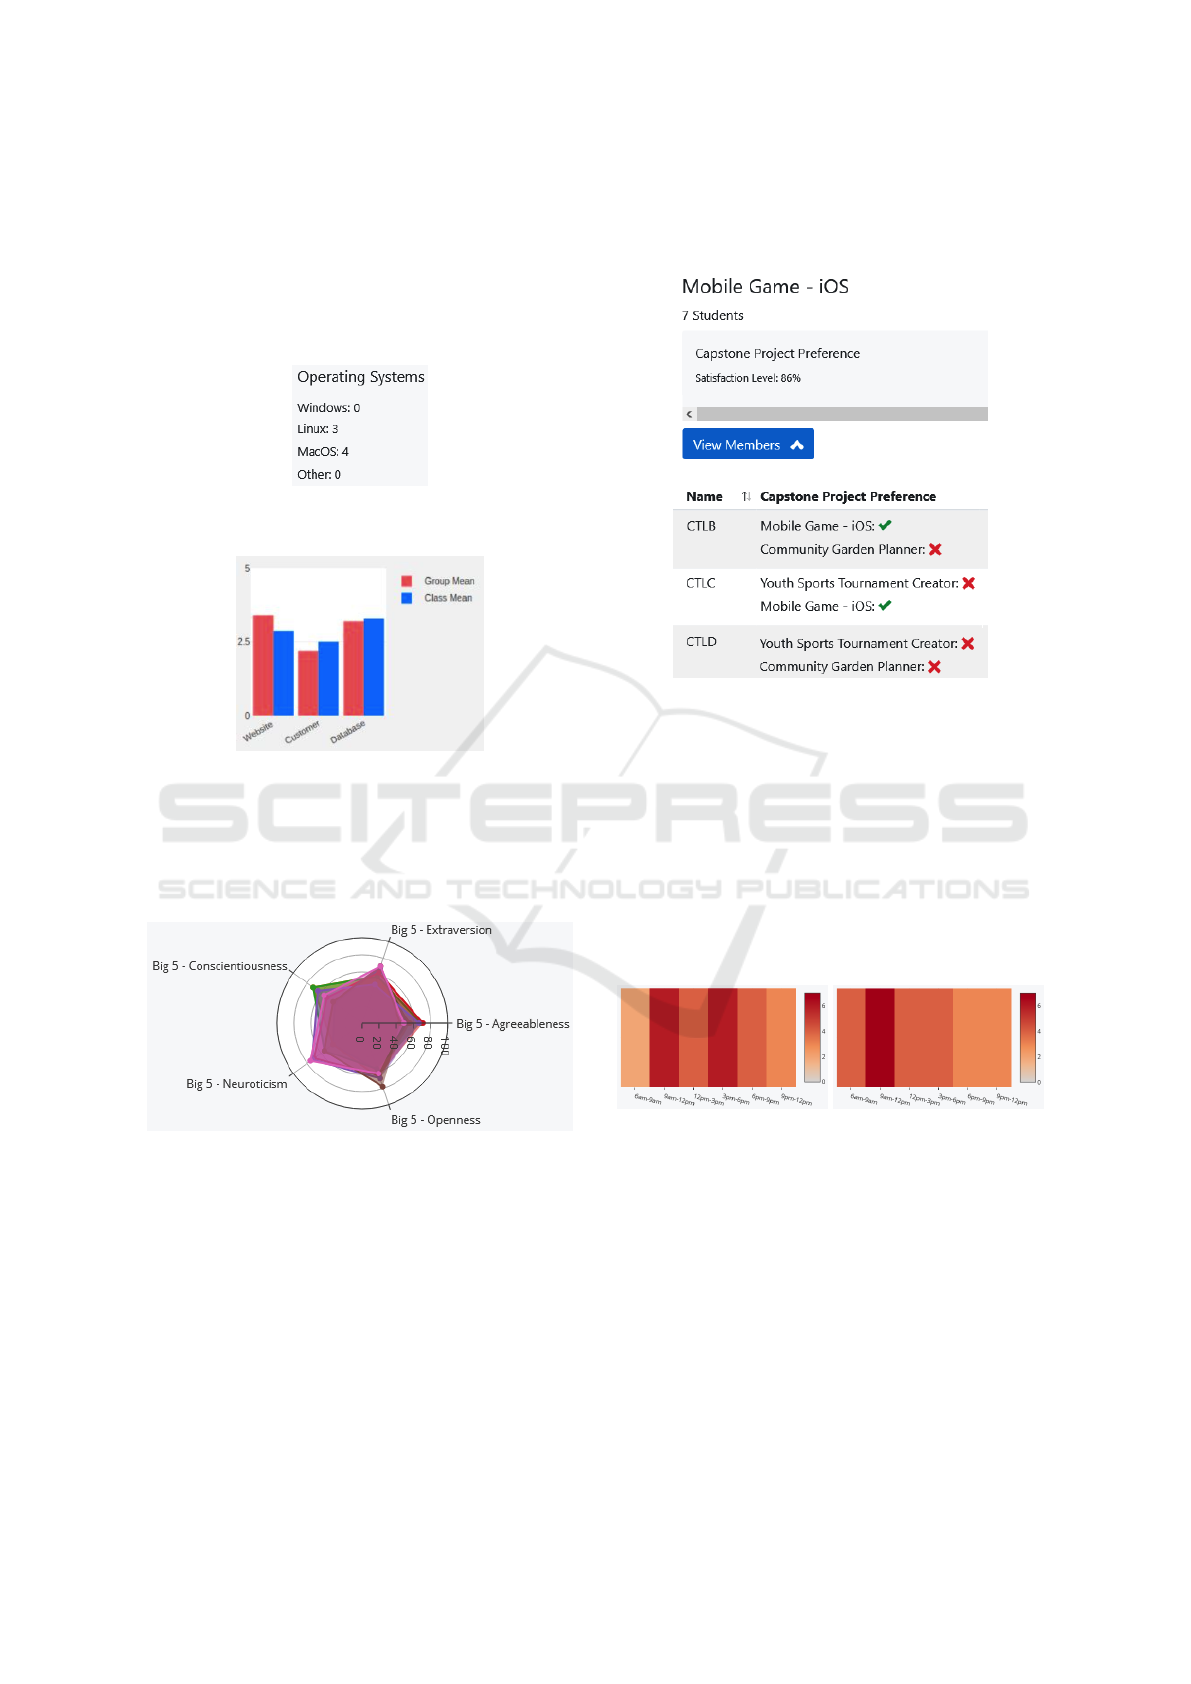
Figure 6: A tally view for the distribution of operating sys-
tems owned in a team.
Figure 7: Comparison bar graph for viewing multiple skills
averaged across team members.
The bar graph supports the ability to compare mul-
tiple skills together. Alternatively, the user can visual-
ize these attributes using a radar graph, as in Figure 8,
with lines connecting the neighboring points.
Figure 8: Radar graph with 5 personality traits.
Certain attributes require specialized visualiza-
tions. The first type is used to illustrate preferences.
Students may have preferences over the set of project
options, which friends to include in their team, and
which enemies to exclude from their team. Although
a tally view can be used, the visualization is not easy
to digest. Instead, we defined a satisfaction metric
to summarize the percentage of preferences satisfied
for that team. Figure 9 shows the team working on
“Mobile Game - iOS” has 7 students, with 86% of
the project preferences satisfied. When the details of
the team members are expanded, we see that a green
checkmark indicates when a preference is satisfied a
red cross indicates when a preference is not met.
Figure 9: Project preferences shown for 3 of the 7 students.
To view a team’s schedule availability, we im-
plemented a heatmap visualization as shown in Fig-
ure 10. Given specific blocks of times in a day,
the gradient of the color represents whether more or
fewer students are available to meet in that block
of time. Here, lighter shades represent fewer stu-
dents are available and dark red represents everyone
is available. Figure 10 shows two heat maps. It is easy
to see that the team on the left has more opportunities
to work together than the team on the right because
there are more dark red blocks.
Figure 10: Time availability for two teams.
Once teams are formed and students start working
on their course work, the Visual Analytics component
also has a monitoring page that allows the instructor
to select grades from the course LMS and compare
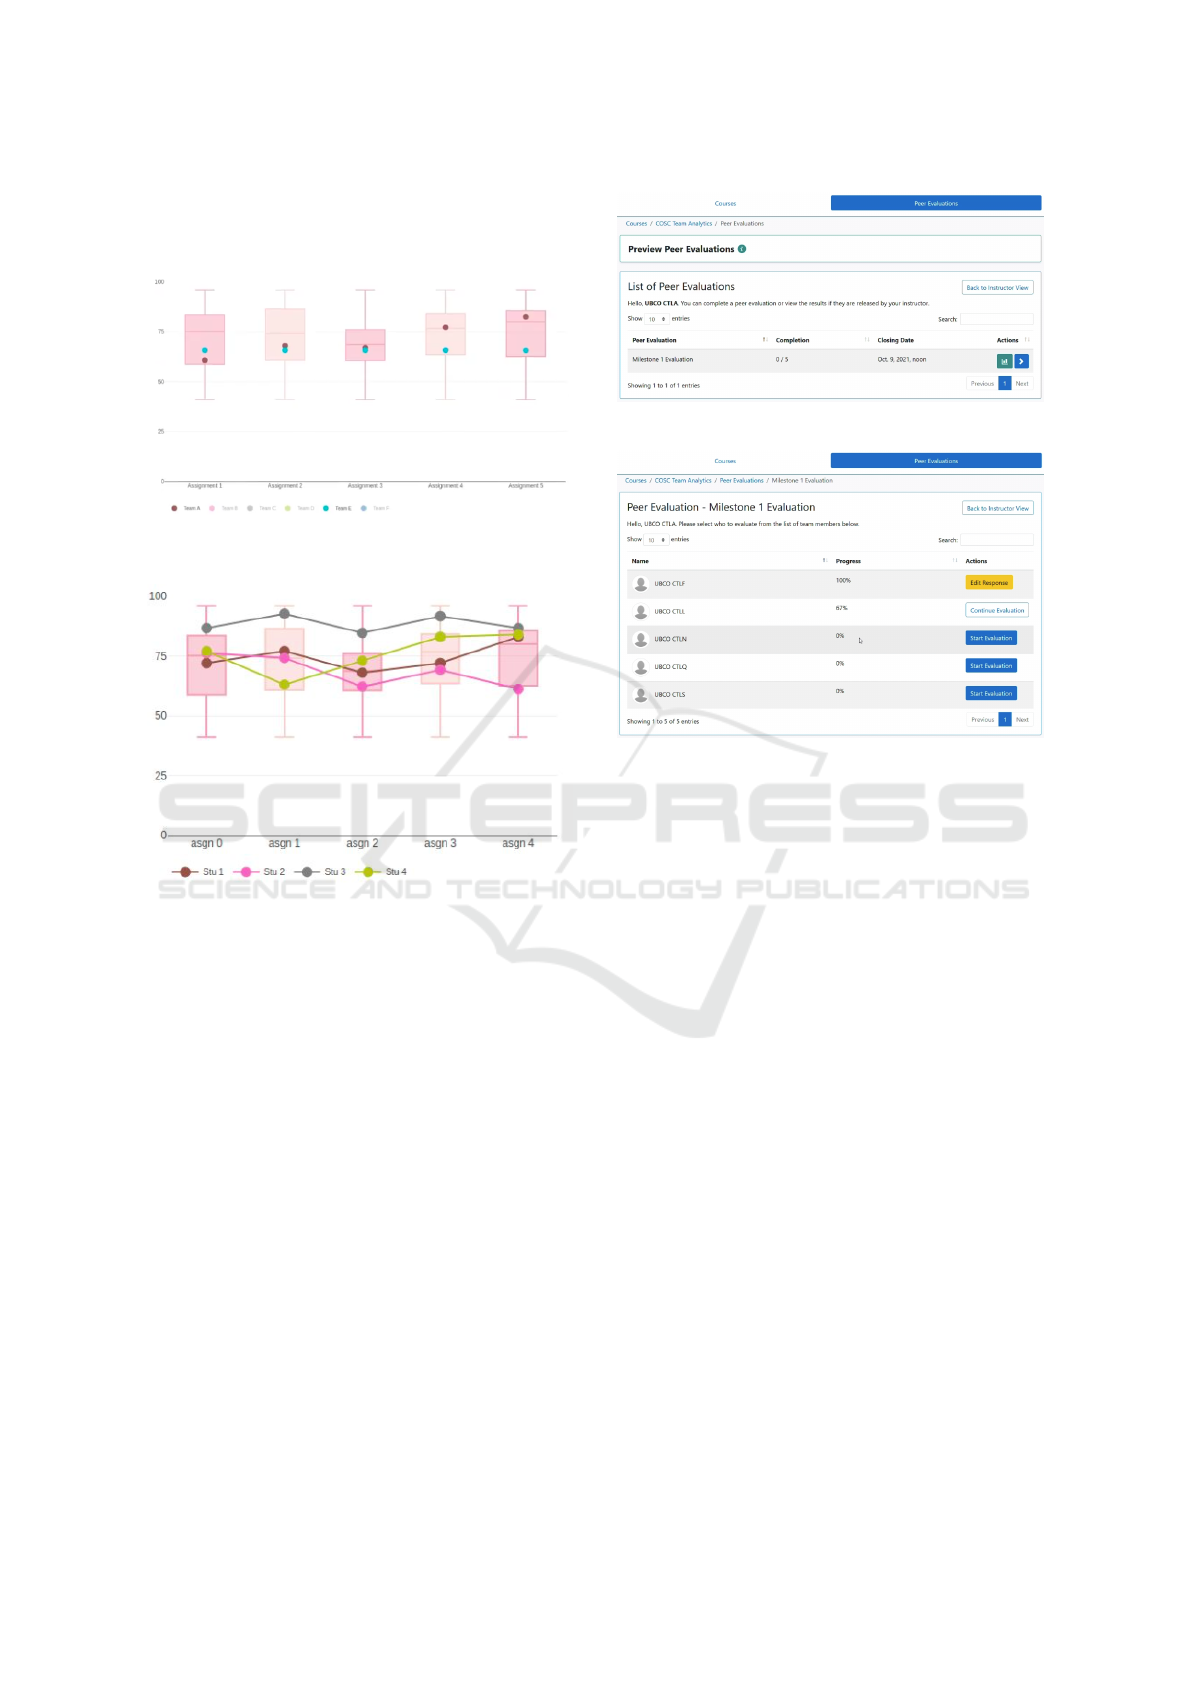
them visually. Figure 11 shows a box plot graph for
comparing performance across teams. The instructor
can also employ the same visualization to view per-
formance within a team. Here, the user can turn on
the line option so that trends in performance for the
same team or the same individual are easier to trace.
This is shown in Figure 12. Currently, these visual-
izations present a simple view of team performance.
A2E 2022 - Special Session on Analytics in Educational Environments
508
In future work, we are exploring ways to incorporate
richer data that can help teams reflect and improve on
their performance (Fernandez-Nieto et al., 2021).
Figure 11: Box plot graph to compare milestone perfor-
mance across teams.
Figure 12: Box plot graph to monitor individual members
performance within a team, with the line option turned on.
3.2 Student Component
The student user plays a minor role in this system and
only uses the system if there are peer evaluations in
the course. This component is essential to the use case
where peer evaluation feedback is used to augment
and generate new team sets.
3.2.1 Peer Evaluations
Figure 13 shows the student view of the system in the
peer evaluation tab. Once an evaluation is selected,
the student can see a list of peer evaluations for that
milestone and their completion status as shown in Fig-
ure 14. Each evaluation consists of questions created
by the instructor. Peer evaluations are generated so
that a student must complete an evaluation for each
member of the team. Another feature is that students
can evaluate other teams in the class (e.g., give feed-
back on another team’s presentation).
Once the peer evaluations are completed, the in-
Figure 13: The student view when first log in.
Figure 14: The student’s list of peer evaluations.
structor can export the data for further calculations if
desired. If the instructor wishes to generate new teams
based on these responses, the instructor can return to
the Team Generation component to do so.
4 PILOT CLASSROOM STUDIES
Teamable Analytics was integrated with the Canvas
LMS and piloted in several classes over the past four
years. Section 4.1 reports initial studies on piloting
the algorithm without the user interface or piloting
the core instructor components supported heavily by
a researcher (Bulmer, 2021). Section 4.2 summarizes
the newer studies on piloting the whole system, which
includes the Visual Analytics and the student-facing
Peer Evaluation components.
4.1 Initial Studies
The system generated teams for four upper-level
Computer Science undergraduate courses between
September 2019 and April 2021. These courses had
between 41 and 161 students, varied in team forma-
tion criteria, and assessed different parts of the sys-
tem. When student satisfaction was measured, the re-
ported values were on average between 0.78 and 0.86,
with 0 being not satisfied at all and 1 being very sat-
Design Guidelines for a Team Formation and Analytics Software
509

isfied. A metric called activity cover was used to in-
dicate the proportion of project requirements that are
met by the skills in the student team, with 0% be-
ing none of the requirements are met and 100% being
all of the requirements are met. The studies reported
an average of 65.8% activity cover value across the
project teams. Overall, the studies provided encour-
aging results and suggested that the tool made the
team formation task easier for instructors. Much of
the feedback was focused on user interface improve-
ment because the rest of the tool was largely under de-
velopment. The interested reader is referred to (Bul-
mer, 2021) for further details.
4.2 Full System Evaluations
In 2021, we completed 4 new classroom evaluations
using the full system in Kinesiology, Art Studies, and
Physics. The class sizes range from 15 to 170 stu-
dents. A variety of criteria was used to form teams,
such as diversifying student skills to form balanced
teams, or diversifying student degree majors to form
heterogeneous teams, or matching students’ prefer-
ences and goals so similar minds can work together.
Among these, only one class used peer evaluations to
provide feedback to team members, but that feedback
was not be used to regenerate new teams.
All the studies successfully built teams for their
classes with a few minor production problems. Gen-
erally, we received positive feedback from the in-
structors indicating that the interface was easy to use
and the system saved them a lot of time from hav-
ing to generate teams manually or semi-automatically.
Among those who used the peer evaluation compo-
nent, 93% of the students reported a neutral or posi-
tive experience with the tool.
We are running the study in five more courses
across Medical Studies, Computer Science, and Bi-
ology. The class sizes range from 59 to 539 stu-
dents. One class is matching student skills to avail-
able projects, one class is forming discussion groups
that change after a few months based on peer evalua-
tion feedback, and the other classes are forming teams
to work on creative assignments.
Informal feedback from these studies so far is that
the tool generally works well for their needs, but the
Visual Analytics component is difficult to use due to
the large number of graphs displayed for large classes.
In one case, an instructor used a team formation strat-
egy that resembles a self-selection strategy, with addi-
tional criteria to balance teams and to prevent student
isolation. However, we discovered that our algorithm
does not support this use case very well when stu-
dents’ social preferences serve as the primary factor.
Thus, we are exploring options to tackle these two
problems in our future work.
Based on our study findings, the next section
presents recommendations for designing and devel-
oping team formation and analytics software.
5 DESIGN GUIDELINES
Software designed for educational use needs to take
privacy and data security into serious consideration.
For team analytics software that handles student data,
it is crucial that the data does not access more stu-
dent information than necessary and that any poten-
tially sensitive data is encrypted and stored securely in
the database. Many higher education institutions have
privacy impact assessments to evaluate new software
as part of the enterprise adoption process.
Accessibility is also a concern due to the wide
range of users who may use this application. There
are two user groups in a team formation software: in-
structors and students. The software needs to accom-
modate individuals who may have diverse needs due
to their impairments. Furthermore, many institutions
have compliance standards so that a web application
must meet web content accessibility guidelines (e.g.,
WCAG 2.1, although new versions are underway).
The rest of this section describes the design needs
that are unique to team formation and analytic soft-
ware. We explain our recommendations in the context
of our experience presented in earlier sections.
Customizability. Teams can be formed in many
different ways as a function of the instructor’s ped-
agogical objectives. Thus, the software should al-
low the instructor to pick and choose the parame-
ters for how s/he want to form teams. Such param-
eters may include team size, how much weight to
place on one’s academic performance, whether stu-
dents’ friends should be placed in the same teams, or
how important project success is as an outcome. This
approach promotes the idea in line with other work
on customizable dashboards (Roberts et al., 2017;
Quispe et al., 2021; V
´
azquez-Ingelmo et al., 2019).
While leaving the control of these parameter settings
in the user’s hand is crucial, we have also been asked
many times whether the software can suggest how
teams should be formed. Unfortunately, without a
deeper understanding of the course context, the stu-
dent population, and the pedagogical objectives, it is
not possible to automate such suggestions. As an ini-
tial step, the software can provide default questions
commonly used in the literature for the user to con-
sider as potential team formation criteria.
A2E 2022 - Special Session on Analytics in Educational Environments
510

Composability. The need for computer assistance
in forming teams is most apparent with large classes.
In our experience, forming teams manually with class
sizes up to 40 students is manageable, although the
process is time-consuming, tedious, and error-prone.
However, many university classes have more than 40
students. Therefore, the algorithm used in the team
formation software must be able to handle multiple,
competing constraints from a large number of vari-
ables so that the constraints can be considered, or
composed, together to form meaningful teams. Since
different instructors have different criteria in mind,
the software should not limit the number of criteria
used for forming teams.
Scalability. Our studies included a class with over
500 students. As mentioned earlier, instructors turn to
automated solutions when they have large class sizes.
The average class size in all of our full system stud-
ies is 157 students. Thus, the ability to form teams
with large class sizes is crucial to the utility and the
adoption of the software.
Efficiency. Our feedback indicates users do not
want to wait a long time for the system to gener-
ate teams. However, this is infeasible at scale if the
system’s algorithm is designed to find an exact, opti-
mal solution. Thus, a tradeoff must be made between
the practicality of use and the theoretical accuracy of
the results. We argue that user satisfaction must be
prioritized and that approximation algorithms should
be explored in this field as they can generate teams
quickly and provide near-optimal solutions (Bulmer
et al., 2020).
Interoperability. New educational technology that
supports class activities should seamlessly integrate
with the institution’s LMS (e.g., using the LTI proto-
col). Thus, course data can be pulled into the appli-
cation without additional overhead, student informa-
tion can reside in the LMS to minimize security risks,
and the software can export the teams directly to the
course and view ongoing team analytics by pulling
course grades from the LMS.
Transparency. One of the first pieces of user feed-
back we got is that the instructor needs to have the
ability to inspect and verify that the suggested teams
were formed based on the inputted criteria. We ob-
served this feedback before the Visual Analytics com-
ponent was built. This was an interesting finding be-
cause it showed that the instructor did not trust the
system’s algorithm. As a solution, we used carefully
presented analytics can enable the instructor to verify
if their teams are formed as desired without having to
analyze detailed student preferences. In general, data
must be presented in an understandable and explain-
able way so that the user can trust the system (Verbert
et al., 2020). Moreover, the solution should enable
the user to diagnose the problem through a quick in-
spection of the teams so that the user knows which
changes need to be made.
Social Relevance. The software should have the
ability to accommodate social preferences in creat-
ing teams. In hopes of improving the quality of col-
laboration, many instructors elicit student preferences
about their friends and enemies when forming teams.
However, these relationships cannot be the sole fac-
tor in deciding team membership because there are
cases when one student is singled out or when a stu-
dent does not know anyone else in the class. Fur-
thermore, some instructors may prefer to have more
diverse teams by distributing the females in a male-
dominant class or by distributing visible minority
students across the teams. A concept that is well-
documented in the psychology literature called to-
kenism suggests that teams with a token minority stu-
dent often result in poor team dynamics and decrease
the minority student’s sense of belonging (Cohen and
Swim, 1995). Thus, some instructors may wish to
diversify on a student characteristic only if a mini-
mum of two or more similar students are present in the
team. For example, in a male-dominated class, a team
with all male students and a team with two female
students is better than having two teams each with a
token female student. However, we must consider the
possibility that many minority students who have sur-
vived through their degree to their senior years have
formed friendships with non-minority students. In
such cases, it would be more prudent to respect their
social preferences rather than their gender or ethnic
identities. Other factors to ensure teams are formed in
an inclusive way should also be considered (Muheidat
and Tawalbeh, 2018).
Flexibility. One particular use case that poses an
interesting problem to standard team formation al-
gorithms in the literature is the ability to incremen-
tally adjust teams based on new information. One
scenario is when new students register late into the
class and teams have already been formed. This prob-
lem is very common, especially in elective courses
where students opt into a course at the last minute or
even past the registration deadline. Here, the software
needs to facilitate a way to handle adding late reg-
istrants to existing teams. Another scenario is when
Design Guidelines for a Team Formation and Analytics Software
511

the instructor wants to form new teams for the class
based on peer evaluation data on the existing teams.
Many Science classes have labs where students work
in pairs to solve tasks weekly. Each week, the instruc-
tor may tweak the teams using peer evaluation data.
For one lab, the work involved in building the teams
is not that intensive. However, for a large class with
many lab sections, the amount of work involved can
be extremely overwhelming. The system should have
the functionality to accommodate this use case. Ad-
ditionally, rather than regenerating all the teams, the
instructor may wish to lock some teams in place and
only regenerate the others.
Usability. Although usability is a key criterion for
any software, we note that having a simple, intu-
itive interface is especially important in team forma-
tion and analytics software due to the wide range of
users in the target user group. First of all, we can-
not expect instructors to have specialized computer
skills because instructors come from a wide range of
disciplines. Other unacceptable expectations include
requiring the user to export data and analyze it in
another format, placing features in hard-to-discover
parts of the interface, or showing numeric details that
require mathematical expertise. This also means that
visual team analytics need to be presented in a user-
friendly manner so that users with different levels of
data literacy do not feel intimidated by the visualiza-
tions and can make use of the analytics effectively.
Extensibility. Software should be designed in a
way that supports the most common use cases illus-
trated in Figure 1. Early in the software development
lifecycle, designers can discover use cases through fo-
cus groups, interviews, and reported case studies. As
the system gains popularity, new use cases are likely
to arise. We may also discover new use cases through
pedagogical changes. Thus, the software should be
designed and built in a way that can be easily ex-
tended to handle new scenarios.
6 CONCLUSIONS
In this work, we illustrated the general team forma-
tion process based on common use case scenarios.
While several team formation systems exist, they all
focus on diversifying similar students across teams.
In contrast, we have built Teamable Analytics as a
general-purpose team formation and analytics system
that encompasses more use cases, such as matching
students to projects and regenerating the next set of
teams based on peer evaluation feedback. Our Visual
Analytics was designed to increase trust and diagnose
unbalanced teams. Lastly, Teamable Analytics is built
using the LTI protocol and can be easily integrated
with any LMS that uses the protocol.
Our immediate next steps are to extend the algo-
rithm to prevent tokenism in teams and incorporate a
self-evaluation option. Ultimately, we wish to explore
research opportunities available in team analytics and
advance the Visual Analytics component. Not only
are team analytics helpful in the team formation step,
but they are also crucial in the team monitoring stages
for increasing team success. Visual analytics can in-
form us about team compositions. This can help stu-
dents to better understand themselves and their team
members. It also helps instructors take preventative
actions to support teams that may have conflicts or
lack certain skills. Team analytics can include infor-
mation beyond grades to provide a richer story about
the teams. The analytics can also be coupled with at-
risk alert features that prompt the instructor about po-
tential team or individual issues. Lastly, experimental
interventions can also be carried out where team ana-
lytics provide empirical insights on changes resulting
from those interventions.
REFERENCES
Alberola, J., del Val, E., Sanchez-Anguix, V., Palomares,
A., and Teruel, M. (2016). An artificial intelligence
tool for heterogeneous team formation in the class-
room. Knowledge-Based Systems, 101:1–14.
Alfonseca, E., Carro, R., and Mart
´
ın, E. (2006). The impact
of learning styles on student grouping for collabora-
tive learning: a case study. User Model User-Adaptive
Interaction, 16:377–401.
Bulmer, J. (2021). Team formation using fair allocation.
Master’s thesis, Department of Computer Science,
Mathematics, Physics, and Statistics, The University
of British Columbia, Canada.
Bulmer, J., Fritter, M., Gao, Y., and Hui, B. (2020). Fastt:
Team formation using fair division. In The 33rd
Canadian Conference on Artificial Intelligence (CAI),
pages 92–104. Lecture Notes in Computer Science,
12109, Advances in Artificial Intelligence, Springer.
Cohen, L. and Swim, J. (1995). The differential impact
of gender ratios on women and men: Tokenism, self-
confidence, and expectations. 21.
Fernandez-Nieto, G., Echeverria, V., Shum, S., Man-
garoska, K., Kitto, K., Palominos, E., Axisa, C., and
Martinez-Maldonado, R. (2021). Storytelling with
learner data: Guiding student reflection on multi-
modal team data. 14(5):695–708.
Fischer, M., Rilke, R., and Yurtoglu, B. (2020). Two field
experiments on self-selection, collaboration intensity,
and team performance. Institute for the Study of Labor
(IZA) Discussion Paper, (13201).
A2E 2022 - Special Session on Analytics in Educational Environments
512

Hastings, E., Jahanbakhsh, F., Karahalios, K., Marinov, D.,
and Bailey, B. (2018). Structure or nurture?: The ef-
fects of team-building activities and team composition
on team outcomes. In Proceedings of the ACM on
Human-Computer Interaction, volume 2, page 1–21.
Hui, B., Adeyemi, O., de Vin, M., Marshinew, B., Khademi,
K., Bulmer, J., and Takasaka, C. (2022). Teamable
analytics: A team formation and analytics tool. In The
12th International Learning Analytics and Knowledge
Conference (LAK).
Layton, R., Loughry, M., Ohland, M., and Ricco, G.
(2010). Design and validation of a web-based sys-
tem for assigning members to teams using instructor-
specified criteria. Advances in Engineering Educa-
tion, 2(1):1–28.
M., V., Salimath, S., Shettar, A., and Bhadri, G. (2018).
A study of team formation strategies and their impact
on individual student learning using educational data
mining. In IEEE Tenth International Conference on
Technology for Education (T4E), pages 182–185.
McEwan, D., Ruissen, G., Eys, M., Zumbo, B., and
Beauchamp, M. (2017). The effectiveness of team-
work training on teamwork behaviors and team per-
formance: A systematic review and meta-analysis of
controlled interventions. PLoS ONE, 12(1):e0169604.
Muheidat, F. and Tawalbeh, L. (2018). Team based learn-
ing: the role of equity, diversity, and inclusion in team
formation. In Research on Equity and Sustained Par-
ticipation in Engineering, Computing, and Technol-
ogy (RESPECT), pages 1–2.
National Research Council (2015). Enhancing the effective-
ness of team science. Board on Behavioral, Cognitive,
and Sensory Sciences, Division of Behavorial and So-
cial Sciences and Education. National Academy of
Sciences.
Navimipour, N. and Charband, Y. (2016). Knowledge
sharing mechanisms and techniques in project teams:
Literature review, classification, and current trends.
Computers in Human Behavior, 62:730–742.
Ohland, M., Loughry, M., Woehr, D., Finelli, C., Bullard,
L., Felder, R., Layton, R., Pomeranz, H., and
Schmucker, D. (2012). The comprehensive assess-
ment of team member effectiveness: Development of
a behaviorally anchored rating scale for self and peer
evaluation. Academy of Management Learning & Ed-
ucation, 11(4):609–630.
Post, M., Barrett, A., Williams, M., and Scharff, L. (2020).
Impact of team formation method on student perfor-
mance, attitudes, and behaviors. Journal of the Schol-
arship of Teaching and Learning, 20(1):1–21.
Quispe, B., Apfata, J., Figueroa, R., and Solis, M. (2021).
Design proposal of a personalized dashboard to op-
timize teaching-learning in virtual learning environ-
ments. In Proceedings of the 13th International
Conference on Education Technology and Computers
(ICETC), page 77–84.
Roberts, L., Howell, J., and Seaman, K. (2017). Give me
a customizable dashboard: Personalized learning an-
alytics dashboards in higher education. Tech Know
Learn, 22:317–333.
Sparrow, M. (2011). The GRumbler: Introduction to
The Group Rumbler. https://scholar.harvard.edu/
msparrow/grumbler. Accessed: 2022-02-25.
Spoelstra, H., Van Rosmalen, P., and Sloep, P. (2014). To-
ward project-based learning and team formation in
open learning environments. Journal of Universal
Computer Science, 20(1):57–76.
Takai, S. and Esterman, M. (2017). Towards a better de-
sign team formation: A review of team effectiveness
models and possible measurements of design-team in-
puts, processes, and outputs. In ASME International
Design Engineering Technical Conferences and Com-
puters and Information in Engineering Conference.
Team-Match (2012). Better teamwork in education. https:
//www.team-match.com/. Accessed: 2022-02-25.
Verbert, K., Ochoa, X., Croon, R. D., Dourado, R., and
Laet, T. D. (2020). Learning analytics dashboards: the
past, the present and the future. In Proceedings of the
Tenth International Conference on Learning Analytics
and Knowledge (LAK), page 35–40.
V
´
azquez-Ingelmo, A., Garc
´
ıa-Pe
˜
nalvo, F., Ther
´
on, R., and
Conde, M. . (2019). Extending a dashboard meta-
model to account for users’ characteristics and goals
for enhancing personalization. Number 2415, pages
35–42. CEUR Workshop Proceedings Series.
Design Guidelines for a Team Formation and Analytics Software
513
