
Towards an Automated Business Process Model Risk Assessment:
A Process Mining Approach
Panagiotis Dedousis
1a
, Melina Raptaki
1
, George Stergiopoulos
2b
and Dimitris Gritzalis
1c
1
Dept. of Informatics, Athens University of Economics & Business, Athens, Greece
2
Dept. of Information & Communication Systems Engineering, University of the Aegean, Samos, Greece
Keywords: Cybersecurity, Risk Assessment, Process Mining, Business Process Management, Dependency Risk Graphs.
Abstract: Cybersecurity Risk Assessment reports (RAs) on an organization’s information systems are fundamental to
supporting its entire information security management. Proper assessments do not restrict their analysis only
to tangible assets of an information system (e.g., servers, personal computers, databases) but also delve into
the company’s day-to-day business flows that utilize its information system. Business processes, whether
internal (i.e., payments) or external (i.e., paid services to customers or products), must also be analyzed in
terms of impact and threat exposure, an approach often coined “process-based risk assessment.” Most modern
ISO27000 methods and relevant tools include business flow models in their analysis, either as assets or as
processes themselves. Process mining defines methods and techniques able to construct graphs that demon-
strate the various business flows that are taking place in an information system. However, while process min-
ing methods are of significant interest in general risk analysis, supply chain, and business restructuring, they
seem to be neglected in cybersecurity risk assessments. In this paper, we propose an automated method for
leveraging process mining to conduct faster and more thorough cybersecurity risk assessments. Our enhanced
process mining creates graphs that incorporate weights from typical risk assessment methodologies and pro-
vide helpful information on risk and potential attack vectors on business-driven events by correlating and
analyzing the steps of the business processes depicted in the graph to the assets used to complete each step.
We evaluate our approach and proof-of-concept tool by modeling a real-world company’s business flows and
incorporating them into a risk assessment model to detect and analyze potential attack sources and their re-
spective impact on everyday business work.
1 INTRODUCTION
Risk assessments (e.g., methods and associated tech-
niques) provide an analytical and structured walk-
through for setting up and maintaining an organiza-
tion’s security posture. By doing that, it outlines risk
scenarios and identifies their consequences, the fre-
quency or likelihood of them occurring, and the possi-
ble treatment options, along with the associated costs
(BS ISO/IEC 27001, 2013). These information pieces
are crucial and allow managers to balance the security
budget and better distribute security spending.
Current standards and methodologies consider as-
sets that are part of the information system (e.g., serv-
a
https://orcid.org/0000-0002-3081-4019
b
https://orcid.org/0000-0002-5336-6765
c
https://orcid.org/0000-0002-7793-6128
ers, computers, databases). All of them mention busi-
ness processes, and most relate to them being used in
RAs, albeit indirectly through subjective analysis and
loose correlation to assets (BS ISO/IEC 27001, 2013;
NIST SP 800-30, 2012). As a result, the analyst is
burdened with accounting for particular business
flows, often manually, through hearsay or interviews,
which leave much information outside the scope. For
example, it is crucial to identify the actual business
process that utilizes a database, how often the process
is performed, from which users (power or simple us-
ers), and with which tools.
Information about business flows and assets usage
is associated with the knowledge of the business pro-
cesses in the organization and can be extracted from
Dedousis, P., Raptaki, M., Stergiopoulos, G. and Gritzalis, D.
Towards an Automated Business Process Model Risk Assessment: A Process Mining Approach.
DOI: 10.5220/0011135600003283
In Proceedings of the 19th International Conference on Security and Cryptography (SECRYPT 2022), pages 35-46
ISBN: 978-989-758-590-6; ISSN: 2184-7711
Copyright
c
2022 by SCITEPRESS – Science and Technology Publications, Lda. All rights reserved
35

the information system event logs using a variety of
process mining methods. Even though there is a
growing body of research concerning risk-aware bu-
siness process management, which recognizes the be-
nefits of analyzing and examining business processes
during risk assessment, still, to our knowledge, no
prior work focuses on how to extract meaningful data
from event logs using process mining to assess the
risk of an information system (Cardoso et al., 2021;
Caron et al., 2013; Lamine et al., 2020; W. van der
Aalst et al., 2012; W. van der Aalst & de Medeiros,
2005). Utilizing process mining on event logs to ac-
quire knowledge of the underline business process
provides several benefits, such as reducing the cost
and time required for modeling and, more important-
ly, allowing for fast remodeling in case of business
process changes.
The addition of business context to risk assess-
ment provides valuable insights for the information
systems under examination, drives the creation of bet-
ter policies and measures, and, in general, leads to a
more holistic approach where the systems are exami-
ned as a whole and not as the individual assets that
comprise them.
We propose a new method for automatically ex-
tracting complex business flow interdependencies in
organizations and incorporating them to risk assess-
ment analysis. The presented approach utilizes tech-
niques used in the field of process mining to (i) ana-
lyze information systems event logs and (ii) construct
graphs that demonstrate the various business proces-
ses that are taking place in an information system, ba-
sed on the steps that are a part of each process.
Then the approach leverages methodologies and
tools from cybersecurity risk assessments to (iii) cal-
culate the likelihood value for each graph node and
edge, considering their respective frequency of use,
exposure to cyber threats, and amount of influence of
each node to an organization’s business needs.
To achieve the migration of business mining
graphs to risk assessment analyses, we utilize risk de-
pendency analysis to (i) evaluate the cascade impacts
of process disruptions and the overall risk affecting
the organization and (ii) identify and prioritize high-
risk processes and business flows (paths). Our ap-
proach can identify possible points of potential fail-
ures in the business process workflows. In addition,
the analysis of process dependency graphs offers the
advantage of discovering unknown attack surfaces
and vectors by locating improper sequences of acti-
ons/activities. By identifying such hotspots and attack
vectors, countermeasures can be integrated directly
into the existing workflow, improving system relia-
bility and resiliency.
To evaluate our approach, we utilize a dataset
(collection of event logs) supplied by an anonymised
company in the paints industry based in Southern Eu-
rope. The data have been collected from an ERP-like
system on which internal and external users/vendors
operate. The dataset contains data concerning the pro-
curement process (i.e., purchase and order handling)
and consists of over 50.000 events for purchase orders
entered in the company’s systems in 2021.
In summary, our paper contributes the following:
1) A process mining approach for incorporating
complex business flow interdependencies into
dependency graphs to map process activities and
their interdependencies based on the business
process model.
2) A likelihood assessment technique to estimate
the probability of a future risk event occurring for
each business process activity based on their re-
spective frequency of use.
3) Critical process activity identification and prior-
itization utilizing risk analysis.
4) High-risk chain (path) identification and prioriti-
zation utilizing dependency risk analysis.
The rest of the paper is organized as follows: Section 2
discusses related work and compares risk assessment
and process mining methods. Section 3 describes the
proposed risk analysis method for mined business pro-
cesses. Section 4 describes the fundamental building
blocks of our analysis approach. Section 5 discusses
the methodology implementation and the evaluation in
a real-world example and presents our findings to val-
idate the methodology. Finally, the conclusion dis-
cusses paper results and potential future research in
Section 6.
2 RELATED WORK
Several risk assessment tools and methods assess the
factors that influence risk levels in organizations and
their business workflows. The main intention of such
high-level methodologies is to analyze the multi-di-
mensional impacts of disruptive incidents in organiza-
tions and critical infrastructures in multiple sectors
(Ani et al., 2019; Aven, 2016).
Traditional risk assessment methodologies usually
focus on individual vulnerabilities on already opera-
tional systems (BS ISO/IEC 27001, 2013; NIST SP
800-30, 2012). The most common ones are asset-based
and require a knowledgeable team (e.g., analysts, sys-
tem administrators, users) with comprehensive skills
and experience. In addition, most methodologies, like
MAGERIT, CORAS, and MEHARI, involve their us-
ers in the assessment process (Gritzalis et al. 2018;
SECRYPT 2022 - 19th International Conference on Security and Cryptography
36

Amutio et al., 2014; CLUSIF, 2010; CORAS, 2010;).
However, traditional risk assessments focus on manag-
ing uncertainties around physical and financial assets
neglecting business processes and their correlation to
company assets. Furthermore, they are performed on
already established and functioning systems resulting
in added layers of cybersecurity on top of existing sys-
tems. Finally, the increasing interconnection of sys-
tems indicates a need for novel approaches utilizing
multiple data sources to address different types of
threats and manage attack surfaces (Rubio et al., 2017;
Lopez et al., 2013).
Several authors stressed the importance of model-
ing organizations as interconnected systems to assess
the cascade effects due to their strong interdependen-
cies. (Azzini et al., 2018; Kotzanikolaou et al., 2013a;
Min et al., 2007). Most approaches utilize graph visu-
alization or cascade diagrams to model the interde-
pendencies among system components (e.g., CI, net-
work components, business processes) and assess the
cascading risk. For example, in (Stergiopoulos et al.,
2016), the authors proposed to use graphs for time-
based critical infrastructure dependency analysis for
large-scale and cross-sectoral failures in CIs. In (Ster-
giopoulos et al., 2017, 2020), authors, focus on indi-
vidual organizations, mainly industry IT and ICT net-
works, by evaluating the cascading failures, in terms of
risk, between assets involved in and among different
business processes. Although the modeling and assess-
ment of interdependencies can effectively identify and
minimize the cascading risk, it still requires an exten-
sive amount of data from a previous risk assessment to
acquire impact and likelihood values.
A significant challenge for asset-based and pro-
cess-based approaches that estimate risk is collecting
required input information, as it is a rather time-con-
suming and costly process. However, in the case of
process-based approaches, the business process work-
flow of an organization can be efficiently extracted uti-
lizing process mining techniques (W. van der Aalst &
Dustdar, 2012). Process mining aims at extracting in-
formation from event logs to capture the business pro-
cess as it is being executed (W. van der Aalst et al.,
2012). For example, in (Caron et al., 2013), the authors
explore and investigate the applicability of process
mining for enterprise risk management utilizing an
analysis of infrequent behavior and extreme situations.
Furthermore, in (W. van der Aalst & de Medeiros,
2005), authors utilize process mining to analyze audit
trails for security violations from low-level intrusion
detection to high-level fraud prevention. Still, these
process mining approaches do not address the cascade
risk between business processes or analyze subliminal
attack paths. To the best of our knowledge, there have
been no attempts until now to utilize business process
chains mined from a system to conduct a risk assess-
ment or study the risk interdependencies and cascading
effects.
Our proposed process-based risk analysis approach
and tool use utilize multiple methods to mine, analyze
and assess business processes. We utilize (i) the pro-
cess mining techniques and concepts from (W. van der
Aalst et al., 2012; W. van der Aalst & Dustdar, 2012),
(ii) the quantitative input from RA reports since we opt
to automate a cost-benefit analysis on asset dependen-
cies in business processes (BS ISO/IEC 27001, 2013;
NIST SP 800-30, 2012) (iii) the risk dependency anal-
ysis for attack paths from (Stergiopoulos et al., 2017,
2020). Our solution considers and examines the busi-
ness workflow integrating potential risks in all business
processes. The integration of process mining expands
the accuracy of the business process model under ex-
amination and improves the cost and time efficiency by
automating the process. In addition, our implementa-
tion can automatically analyze process dependency
graphs providing solutions for risk mitigation and pri-
oritization, detect the highest risk attack paths, and of-
fer metric analysis of existing vulnerability effects on
the overall system to help managers, experts, and secu-
rity officers make justifiable decisions on security di-
lemmas (Gritzalis et al, 2018; Dewri, 2007; Kotzani-
kolaou at al., 2013b).
3 ANALYSIS OF PROCESS
MINED BUSINESS
WORKFLOWS
This section explains how we leverage process mining
to conduct faster and more comprehensive cybersecu-
rity risk evaluations. We first explain the fundamental
steps of the proposed methodology to analyze and as-
sess process mined business workflows. Then, we
briefly describe the required input and expected output
of our model.
3.1 Methodology
The presented approach utilizes numerous steps to
achieve its goals. Each step of the presented methodol-
ogy utilizes a collection of mapping procedures and al-
gorithms. Each one provides insight into the organiza-
tion’s business process model analysis and outputs in-
formation to be used as input by the following step.
This process uses three fundamental steps:
Towards an Automated Business Process Model Risk Assessment: A Process Mining Approach
37

Step 1: Business Process Mining: Extracts busi-
ness processes from event logs readily available in the
organization's information systems and identifies pro-
cess activities. Output results are modeled as transition
diagrams.
Step 2: Process Dependency Modeling: Maps
previously produced process transition diagrams into a
risk process dependency graph. Also, this step calcu-
lates the likelihood of disruption and assigns impact
values, thus estimating the risk for each activity based
on the mapped process dependency graph.
Step 3: Dependency Risk Analysis: The algo-
rithm pre-computes all n-order dependencies using the
process dependency graph. Then, for each process de-
pendency chain, outputs the cumulative dependency
risk of each disruption path. Finally, we identify and
prioritize high-risk activities and dependencies (activ-
ity chains) for risk mitigation.
3.2 Model Inputs and Outputs
The required input for our algorithmic approach is a
collection of event logs from ERP-like and/or CRM
systems on which an organization’s internal and exter-
nal users/vendors operate. The overall output of our
methodology comprises from:
• metrics that assess the performance of the
flow network (i.e., the flow network graph
overall dependency risk, the top and average
cumulative dependency risk, the number of
attack paths),
• an identification of the most critical (in terms
of risk) dependencies (flows) and paths be-
tween business process activities, and
• an identification of the most critical business
process activities based on their risk and their
appearance in critical dependencies and paths
In the following section, we discuss in detail the build-
ing blocks that are utilized and essentially compose our
methodology.
4 BUILDING BLOCKS
This process mining risk analysis methodology uses
four building blocks:
1) A process mining method for extracting business
process models and subprocesses from infor-
mation system event logs.
2) A modeling method that maps and converts the
business process models into dependency graphs
based on the discovered business process model.
3) A risk calculation methodology to estimate the
likelihood of a threat disrupting internal and/or
external business processes.
4) A multi-risk dependency analysis methodology
for assessing risk of graph’s dependency paths.
4.1 Process Mining
To discover and analyze the business process model of
an organization, we utilize process mining. Process
mining provides valuable fact-based insights and sup-
ports process improvements (W. van der Aalst, 2016).
The concept is fast gaining popularity and attracting in-
terest since the release of the Process Mining Mani-
festo with various open-source tools such as ProM,
ProM Lite, and RapidProM available (W. van der Aalst
et al., 2012). This discipline aims to discover, monitor,
and improve business processes by extracting
knowledge from event logs readily available in an or-
ganization’s information system (van der Aalst, 2014).
Some of the process mining techniques include auto-
mated process discovery, conformance checking, so-
cial network mining, trace clustering, construction of
simulation models, and history-based recommenda-
tions (Caron et al., 2013).
The starting point of the process mining analysis is
the event log which is the data resulting from the use
of information systems (van der Aalst, 2014). Process
mining assumes the existence of an event log where
each event refers to a case, an activity, and a point in
time; for example, on 20/1/2021 at 13:45:14, user X
placed an order with ID 124. To that end, an event log
is a collection of cases, and each case is a sequence of
events. Event data may come from a wide variety of
sources such as a database system (e.g., patient data in
a hospital), a transaction log (e.g., a trading system), an
ERP system (van der Aalst, 2016; van der Aalst &
Dustdar, 2012). In addition, depending on the infor-
mation systems used to support the business processes,
data might be in different formats (e.g., XES, OCEL,
CSV).
Process mining is not applied to the entirety of the
event logs extracted from a system as this would re-
quire significant computational power, and the result-
ing chains would not make sense. Based on this re-
striction, most mining processes are applied to parts of
the event logs related to a specific process (Marin-Cas-
tro & Tello-Leal, 2021).
In our approach, to study and analyze the business
flows of an organization, we focus on specific business
processes (e.g., a procurement process). To do that, we
SECRYPT 2022 - 19th International Conference on Security and Cryptography
38
utilize process mining discovery techniques to extract
process knowledge from event logs and identify the
business process model. In addition, we utilize trace
clustering techniques to analyze the business process
activities in terms of risk. Finally, we should note that
our implementation can analyze one business process
at a time. However, in the case of multiple business
processes (e.g., order to cash, procure to pay), we ex-
tract process transition diagrams and analyze them se-
quentially. Hereafter, we briefly describe the process
discovery and trace clustering techniques used in this
paper.
4.1.1 Process Discovery
Process discovery aims at discovering a model from an
event log. Literature suggests many process mining al-
gorithms to discover a model (van der Aalst, 2014).
Process mining algorithms require a simple event log
file as input. In our approach, we utilize the α-algo-
rithm for process discovery. The algorithm inputs a
collection of event logs. Then, the algorithm starts by
scanning the event log collection for activity patterns.
If an activity is followed by , but is never fol-
lowed by , then it assumes a causal dependency be-
tween and . Successively, the algorithm includes a
node connecting to to the corresponding output
graph (i.e., transition diagram) to reflect this depend-
ency.
The process mining results are presented with pro-
cess modeling notations. The most basic process mod-
eling notation is a transition diagram (e.g., Petri Net).
A transition diagram consists of places and transitions
(i.e., arcs). The diagram’s transitions correlate to busi-
ness process activities, and diagram places reflect their
dependencies. Each transition connects two places and
is labeled the activity’s name; each place has its label
that serves as a unique identifier. Multiple arcs, on the
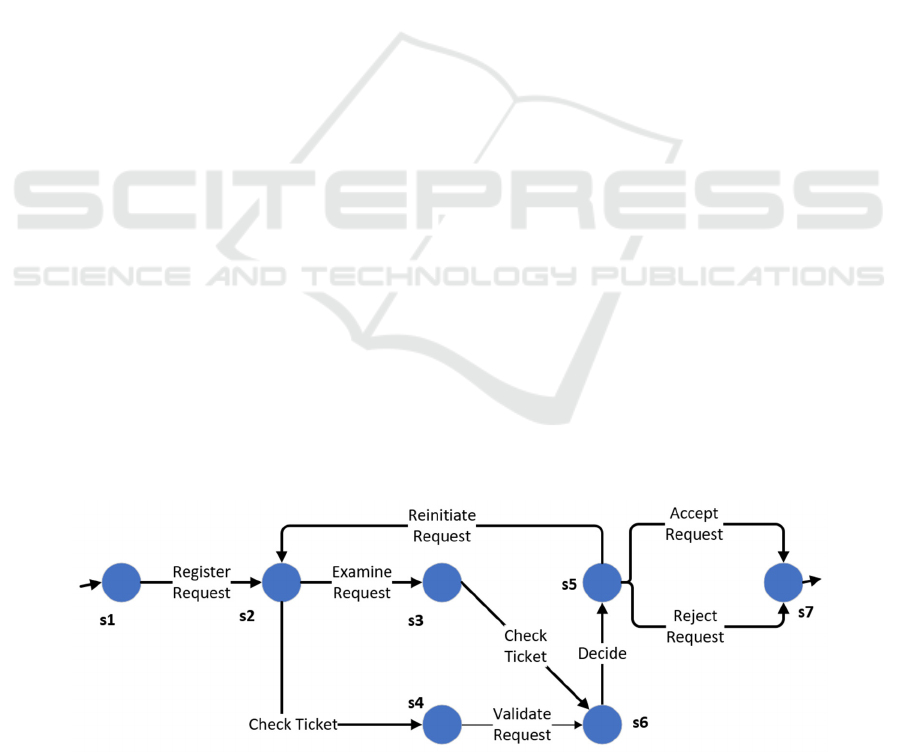
other hand, can share the same label. For example, Fig-
ure 1 illustrates an indicative output of the process dis-
covery algorithm (i.e., a transition diagram) consisting
of seven positions. The transition diagram models and
illustrates the handling of a request in the context of an
information system.
4.1.2 Process Trace Clustering
Process trace clustering provides crucial insights into
the actual process activities in domains requiring flex-
ibility where there is much diversity leading to com-
plex models that are difficult to interpret (Song et al.,
2009). In our approach, we are interested in the fre-
quency of occurrence and participation of a business
process activity in different subprocesses.
To calculate the frequency of occurrence for each
business process activity, we must first decompose the
business process under study into subprocesses. To
achieve that, we utilize trace clustering techniques
from the process mining field (Carmona, 2018). Trace
clustering techniques partition the event log () first,
creating a set of clusters (sub logs)
,
,…,
in-
stead of extracting the process model. Strictly, trace
clustering techniques partition the activities (traces) in
the event log into multiple clusters (sets of traces), such
that each activity (trace) in the original log can be
found in one or more clusters (sub logs). Each cluster
generated by trace clustering is a set of “similar” activ-
ities, and it corresponds to a variant of the process
(Hompes et al., 2015). Intuitively, each produced clus-
ter corresponds to a subprocess, or more generally, a
“fragment” of the actual process.
The process trace clustering outputs a set of clusters
of similar activities and a collection of clusters for each
activity representing the clusters in which that activity
is located. Based on these, we can calculate the fre-
quency of occurrence of each business process activity
in different sub-processes to estimate the likelihood of
a threat to disrupt their operation (see Section 4.3.2 for
more on that).
Figure 1: An indicative business process transition diagram having one initial state and one final state.
Towards an Automated Business Process Model Risk Assessment: A Process Mining Approach
39
4.2 Modelling Dependency Graph
To analyze and assess the process activities risk and
evaluate the company’s overall risk, we need to map
the mined process transition diagram into a risk de-
pendency graph. We should note that the process min-
ing results (e.g., process transition diagrams) can be
easily converted into another notation such as BPMN,
BPEL, or UML activity diagram (List & Korherr,
2006; Peixoto et al., 2008). These diagrams are usually
enhanced with various performance trackers and met-
rics to provide insights and assess the performance of
business workflows, especially in business scenarios
(Kalenkova et al., 2017).
During the second step of the presented work, we
convert the process transition diagram arcs (e.g., Petri
net transitions) to activity nodes and the process transi-
tion diagram nodes (e.g., Petri net places) into depend-
encies between them, thus producing a (process) activ-
ity dependency graph.
The algorithm maps and converts transition dia-
gram nodes into input and output dependencies from
one possible failure node to another. Note that if an arc
appears more than once in a transition diagram, it is
modeled only once as a unique dependency node (ac-
tivity) based on its label identifier.
In this pre-processing stage, dependencies are mod-
eled in directed, weighted graphs =(,), where
the nodes represent the possible failure activity
nodes of the process transition diagram, and edges
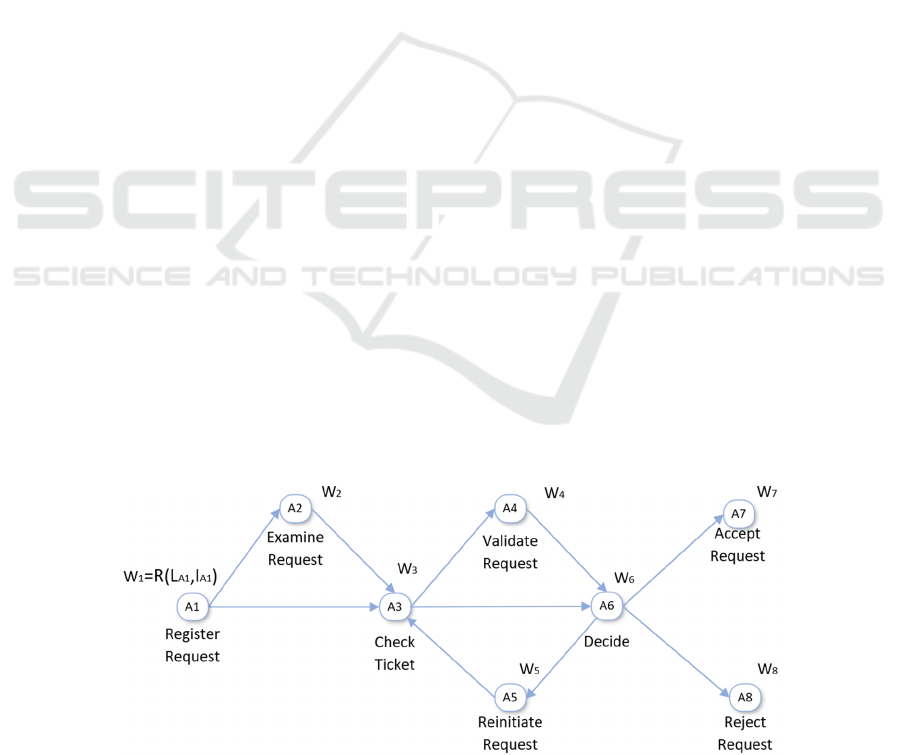
represent the dependencies between them. Figure 2 il-
lustrates a business process dependency graph gener-
ated using the process model transition diagram of Fig-
ure 1. The weight of each activity node quantifies the
estimated dependency risk of activity node B on re-
sources provided by activity node A. This weight de-
rives from the dependency between activity nodes, and
we utilize it to assess the performance, in terms of risk,
of business workflows.
4.3 Risk Calculation
In this section, we examine how to measure risk in the
context of the presented methodology, which is as-
signed to the graph as the weight of the activity nodes.
4.3.1 Risk Factors
Risk is the degree of possible failure that may occur in
an established business process, and risk assessment is
one of the critical activities in the risk management
process. The standard reference of risk as a cybersecu-
rity assessment metric is the following Risk =
Likelihood∗Impact. Assessing risk means identify-
ing the threats and determining the likelihood and im-
pact (BS ISO/IEC 27001, 2013; NIST SP 800-30,
2012). To calculate the risk, we must first estimate and
set the likelihood and impact values for each possible
failure node in the modeled dependency graph.
Impact as a metric depicts the magnitude of harm
due to the loss of availability or integrity of a network
node (i.e., activity). For example, the loss of a business
process activity due to a threat realized affects all de-
pendent activities in the business workflow. Also, in
many cases, a compromised process could result in
high economic costs, material harm, and public service
disruption.
In our approach, we utilize traditional risk analysis
methods, such as ISO/IEC 27001, to estimate the im-
pact of cyber threats for each process activity node in
the system. To do that, we correlate the activities of the
business process model to the company assets used to
complete each activity. This way, each process activity
node on the dependency graph is assigned with an im-
pact value on a scale of 1-5 based on the severity of the
consequences to resources, work performance, prop-
erty, and/or reputation.
Figure 2: Graphical representation of a business process dependency graph generated using the transition diagram of Fig. 1.
The weight () of each activity node quantifies the risk () that derives from the dependency between activity nodes. To
evaluate risk, we calculate the likelihood () and assign the impact () values for each activity node.
SECRYPT 2022 - 19th International Conference on Security and Cryptography
40

On the other hand, we utilize the system event logs
to estimate the likelihood for each process activity
node. The likelihood calculation is thoroughly dis-
cussed in the following section.
4.3.2 Likelihood Calculation
The likelihood for each activity (i.e., node in the graph)
is calculated based on the results of the trace clustering
(see Section 4.1.2) and depicts how likely it is for an
activity to be carried out in different scenarios or chains
of activities that are part of the graph. If an activity is
part of many clusters implies that it participates in
many subprocesses, thus should be assigned with a
higher likelihood. The high frequency of occurrence
and participation of an activity in different subpro-
cesses indicates a high probability of dysfunction and
disturbance in case of a threat realized.
Based on the above, the likelihood for each activity
can be calculated as follows. Let A
i
be an activity (or
node of the graph). Let N be the total number of clus-
ters found in the event log , and
be a cluster of
activities Eq. 1:
…
=
,
,…,
(1)
Then the set S
i
for each activity A
i
, that represents the
clusters an activity is found in, is defined using Eq. 2:
=
…
|
∈
(2)
Based on the above, the likelihood L
i
for each activity
is the number of clusters
(
)
it is found in, di-
vided by the total number of clusters , and it is com-
puted using Eq. 3:
=
(
)
(3)
4.4 Dependency Risk Analysis
Potential disruption to a business process activity is
transferred from the previous connection to the next.
For example, the disruption of the completion/fulfil-
ment of an activity, regardless of the cause, may prop-
agate to all dependent activities in the business process
workflow.
To calculate and assess the n
th
-order cascading
risks propagated in a series of process activities, we use
the following method that utilizes a recursive algo-
rithm based on (Kotzanikolaou et al., 2013; Ster-
giopoulos et al., 2017, 2020). Given
→
→⋯→
is an n
th
-order dependency between connected
components, with weights
,
=
,
,
corres-
ponding to each first-order dependency of the path,
then the cascading risk exhibited by
for this process
activity dependency path is computed using Eq. 4:
,…,
=(
,
)
,
(4)
The cumulative dependency risk is the overall risk ex-
hibited by all the activities in the sub-chains of the nth-
order dependency. If
→
→⋯→
is a chain
of process activity dependencies of length n then the
cumulative dependency risk, denoted as
,…,
, is de-
fined as the cumulative risk produced by an n
th
-order
dependency Eq. 5.
,…,
=(
,
)
,
(5)
Eq. 5 assess the cumulative dependency risk as the sum
of the dependency risks of the affected nodes in the
chain due to a disruption realized in the source node of
the dependency chain. The main output of this analysis
is a collection of activity dependency chains along with
their cumulative dependency risk.
5 EVALUATION
To validate this approach, we developed a proof-of-
concept tool and modeled the business flows of a real-
world company. We analyze and assess the process
network to provide helpful information on risk and po-
tential attack vectors on business-driven events. Our
aim here is not to evaluate all the business workflows
of the company but to evaluate whether and to what
degree our approach can provide valuable information
based on specific metrics (e.g., cumulative dependency
risk).
5.1 Tool Implementation
For our implementation, we opt to use the ProM fra-
mework as it is a world-leading tool in process mining
with various research-related functionalities (Aalst et
al., 2009; Viner et al., 2021).
ProM (2022) is an open-source framework devel-
oped by scientists in the Department of Technology
Management of the Eindhoven University of Technol-
ogy in 2005 that can be utilized for reading, storing,
and analyzing event log files in various formats, as well
as presenting the results of process mining (van
Dongen et al., 2005). To achieve that, ProM has been
structured as a “pluggable” environment, where all
functionality is delivered in plugins. We should note
that more than 200 plugins offer various options for
analysis (e.g., control-flow mining techniques) and vis-
ualization, importing, filtering, and exporting data (W.
Aalst et al., 2009). This plugin architecture allows for
Towards an Automated Business Process Model Risk Assessment: A Process Mining Approach
41

a “mixed and matched” approach to achieve the desired
functionality and outcome. As such, in our implemen-
tation, we utilized a collection of ProM plugins for (i)
importing the event logs (Import plugin), (ii) extracting
the business process model (Discover Graph plugin),
and (iii) trace clustering for risk analysis (Discover
Clusters plugin) to achieve the functionality described
in our methodology (see Sections 4.1.1 and 4.1.2).
For risk dependency analysis, we utilize the Neo4j
graph database (2000). Neo4J is a highly flexible, scal-
able, and efficient database and framework (Jouili &
vansteenberghe, 2013; Shao et al., 2012) for these
types of tools since it builds on the property graph
model. We used Neo4J to model activity dependencies
in business process workflows. Nodes labeling allows
us to input various information (from likelihood and
impact metrics to descriptive activities). Nodes are
connected via directed relationships and can hold arbi-
trary properties (key-value pairs). By utilizing the
Neo4J technology, our proof-of-concept tool can rep-
resent complex graphs of even thousands of dependent
activities through a weighted, directed graph.
The implemented tool was developed as a distrib-
uted application, including a desktop and a web appli-
cation. The desktop application builds on and expands
the ProM framework, and it was developed in Java.
The desktop application handles the process mining
functionalities and the preliminary risk analysis. The
web application is developed in Java Spring using the
Neo4j graph database and handles the risk dependency
analysis.
The desktop application responsible for the process
mining by utilizing the ProM Import plugin can accept
and parse event log files in any XES compliant format.
In addition, the ProM Import plugin provides addi-
tional capabilities that could be utilized, like importing
zipped files, to process immense size event logs. The
desktop application mines and processes the parsed
collections of events logs into a weighted risk depend-
ency graph and outputs the results by converting them
in JSON format. Due to this, the weighted risk depend-
ency graph can be uploaded to the web application for
the risk dependency analysis.
5.2 Case Study Dataset
The company under study is based in Southern Europe
and operates in the paints industry. The company pro-
vided us with a small dataset containing around 50,000
records/events from the company’s ERP information
system. The dataset contains events for purchase orders
entered in the company’s systems in 2021. The pro-
vided event log file was IEEE-XES compliant and is
structured in the usual format of such data in ERP sys-
tems. The company name, as well as any related infor-
mation, was anonymized and sanitized for security
considerations.
5.2.1 Step 1: Business Process Mining
The provided dataset includes the typical flows of pro-
curement (e.g., invoicing, goods receipts, consign-
ment). To that end, each purchase order (or purchase
document) contains line items representing the sequ-
ence of activities (series of events) performed. Also,
because the dataset contains events mainly from the
procurement process and its relatively small size, we
apply process mining on the entirety of the event logs
extracted from the system.
Utilizing process mining techniques (see Section
4.1) on the provided dataset, we identified 40 activities
performed by 50 users (43 human users and seven
batch users indicating automated processing of the rel-
evant activities) (see Table 1). In addition, our tool out-
puts a transition diagram where each activity corre-
sponds to a transition (arc). The generated transition di-
agram consists of 42 places and 51 arcs (activities that
occur sequentially).
Following that, we validated the produced chains
of activities described in the transition diagram, given
how the purchase process is often carried out. For ex-
ample, an invoice can be created only once a purchase
order has been established and accepted in the system.
Finally, it is worth noting that the process model tran-
sition diagram includes (performs) the 40 unique activ-
ities we identified multiple times. Table 1 displays the
extracted business process activities. Process activities
depicted use generic terms and IDs in the lists below.
Table 1: Business process model activities as identified by
the process mining step.
Activity ID
Block Purchase Order A1
Cancel Goods Receipt A2
Cancel Invoice Receipt A3
Cancel Subsequent Invoice A4
Change Purchase Order Approval A5
Change Currency A6
Change Delivery Indicator A7
Change Final Invoice Indicator A8
Change Price A9
Change Quantity A10
Change Rejection Indicator A11
Change Storage Location A12
Change Payment Term A13
Clear Invoice A14
Create Purchase Order A15
Create Purchase Requisition Item A16
SECRYPT 2022 - 19th International Conference on Security and Cryptography
42

Table 1: Business process model activities as identified by
the process mining step (cont.).
Activity ID
Delete Purchase Order A17
Reactivate Purchase Order A18
Receive Order Confirmation A19
Record Goods Receipt A20
Record Invoice Receipt A21
Record Service Entry Sheet A22
Record Subsequent Invoice A23
Release Purchase Order A24
Release Purchase Requisition A25
Remove Payment Block A26
Approve Awaiting Vendor Order A27
Transmit Vendor Order Change A28
Complete Vendor Order A29
Create Vendor Order A30
Delete Vendor Order A31
Complete Vendor Order Document A32
Execute Vendor Order Transfer A33
Submit Vendor Order A34
Complete Vendor Order Transfer A35
Set Vendor Order Transfer To Failed A36
Block Payment A37
Update Order Confirmation A38
Create Vendor Debit Note A39
Create Vendor Invoice A40
5.2.2 Step 2: Dependency Modelling
The tool automatically maps the output transition di-
agram into a dependency graph based on the method
described in Section 4.2. To evaluate the risk of the
business process workflow, we must set the likeli-
hood and impact values for each possible failure node
(activity) in the modeled dependency graph.
First, we calculate the likelihood of disruption of
each node in the dependency graph (see Table 2) based
on the method proposed in Section 4.3.2. The highest
likelihood for an activity is 0.79, and the lowest likeli-
hood recorded for an activity is 0.07.
Based on these results, we observe that high likeli-
hood activity nodes exist in several different chains of
activities (workflows) and, more importantly, none of
them is a start or an end node. That means that any is-
sues that delay or affect their successful processing or
completion would impact several other activities.
For example, the Create Purchase Order (A15) ac-
tivity with a likelihood value of 0.62 always proceeds
the Release Purchase Order (A24) with a likelihood
value of 0.33. On the other hand, the low likelihood
activity nodes indicate issues encountered when infor-
mation is transferred to external systems (e.g., Execute
Vendor Order Transfer) or points where the business
process (i.e., the processing) is over, such as the
Change Rejection Indicator (A11) activity.
Also, we assigned the impact values of each node
(see Table 2) based on a risk assessment and infor-
mation concerning the specific process and the assets
involved in each process activity provided by the com-
pany. Based on the assigned impact values indicated in
table 2, we observe that the Execute Vendor Order
Transfer (A33) activity presents the highest impact
while activities such as the Remove Payment Block
(A26) and Update Order Confirmation (A38) present
the lowest.
Table 2: Dependency nodes (business process activities)
with impact-likelihood values.
Dependency
Node ID
Likelihood Impact
A1 0.36 2
A2 0.60 1
A3 0.41 2
A4 0.33 1
A5 0.45 1
A6 0.21 3
A7 0.60 1
A8 0.24 1
A9 0.76 2
A10 0.55 2
A11 0.07 2
A12 0.43 1
A13 0.14 2
A14 0.71 3
A15 0.62 2
A16 0.10 3
A17 0.60 1
A18 0.41 3
A19 0.41 4
A20 0.74 2
A21 0.76 2
A22 0.43 3
A23 0.26 2
A24 0.33 2
A25 0.07 1
A26 0.55 1
A27 0.12 2
A28 0.29 3
A29 0.36 2
A30 0.41 2
A31 0.36 1
A32 0.26 2
A33 0.52 5
A34 0.31 3
A35 0.14 2
A36 0.07 2
A37 0.21 1
A38 0.29 1
A39 0.60 3
A40 0.79 5
Towards an Automated Business Process Model Risk Assessment: A Process Mining Approach
43

The Execute Vendor Order Transfer (A33) activity
handles and transmits sensitive data to third-party ven-
dors. Therefore, various attacks can exploit it to expose
private data and, more importantly, gain access to the
ERP system. However, activities such as Remove Pay-
ment Block (A26) and Update Order Confirmation
(A38) deal with minor actions (i.e., the change of an
indicator in a document) in terms of potential conse-
quences and so, if they were compromised, it would be
possible to enact workarounds.
Based on the calculated likelihood and the assigned
impact values, the tool calculates the risk value of each
node in the dependency graph based on the methods
proposed in Section 4.3. For example, the Create Ven-
dor Invoice (A40) activity introduces the highest risk,
with a risk value of 3.93, followed by the Execute Ven-
dor Order Transfer (A33) activity with a risk value of
2.62. On the other hand, the Release Purchase Requi-
sition (I12) activity introduces the minimum risk with
a value of 0.07. In table 3, we list the top 5 highest risk
dependencies nodes (activities) based on the output of
our tool.
By examining the two worst activities in terms of
risk, we observe some common characteristics and pat-
terns of execution/operation. In particular, an invoice
is created either by automatic transfer from another
system to a company’s IT systems, a third-party sup-
plier, or an employee who manually enters the data.
Similarly, the Execute Vendor Order Transfer (A33)
activity requires external communication to handle and
transmit data to third-party vendors. As such, activities
that require third-party access for their execution are
associated with significant information system vulner-
abilities (e.g., authorization violation, bypassing con-
trols, eavesdropping, information leakage) and, de-
pending on their importance on the business process,
introduce high risk.
Table 3: Top 5 dependency nodes output from the risk anal-
ysis step (ascending).
Dependency Node ID Risk
A40 3.93
A33 2.62
A14 2.14
A39 1.78
A19 1.62
5.2.3 Dependency Risk Analysis
Finally, the tool computed the complete set of risk
paths on the risk dependency graph based on the met-
hod described in Section 4.4. Paths have an order not
greater than 5. Depicted paths correspond to activity
flows from the business process under study.
Forty network flow nodes produced more than 532
dependency chains with orders ranging from two to
five and potential risk values between 0.07 and 10.13.
Table 4 lists the top 2 highest risk dependency paths
according to each one’s total cumulative risk. Security
experts can use this step’s output to identify business
process activities and related company assets with po-
tential risk values above a threshold value. The thresh-
old is subjective; a decision-maker can define it based
on specific characteristics or requirements of the com-
pany-under-assessment.
Table 4: Top 2 activity dependency paths output from the
risk dependency analysis step (ascending).
Activity Dependency Paths
Cumulative
Path Risk
A15 A22 A34 A40 10.13
A23 A14 A33 A26 A38 6.66
In our case, path A15 A22 A34 A40 is the worst
dependency with a risk value of 10.13. This depend-
ency path contains four activities and represents a busi-
ness flow that begins with a payment term adjustment
and ends with the vendor invoice creation. The second
worst dependency path has a risk value of 6.66 and in-
dicates a business flow of five activities that begins
with recording a subsequent invoice and finishes with
an order confirmation update. We should highlight that
the Execute Vendor Order Transfer (A33) and Clear
Invoice (A14) activities are included in the second-
worst path, indicating their importance.
Hence, based on our analysis, nodes A40, A33, and
A19 are the most critical. In particular, node A40 is the
highest risk node included in the worst dependency
path, and nodes A33 and A19 are in the top 5 highest
risk nodes included in the second-worst dependency.
Therefore, Supplier Invoice Generation (A40) is
deemed the most critical activity, followed by the Exe-
cute Vendor Order Transfer (A33) and Clear Invoice
(A14). That is to be expected, as the Supplier Invoice
Generation (A40) activity is essential to the procure-
ment process; its execution is required before and after
many other activities, thus creating multiple dependen-
cies that increase the risk of interruption due to an at-
tack.
6 CONCLUSIONS
In this work, we propose a method to automatically
model individual business process activities in an or-
SECRYPT 2022 - 19th International Conference on Security and Cryptography
44

ganization and analyze the risk of cybersecurity disrup-
tions on business process model workflows. We
achieved this by utilizing process mining to extract
graphs depicting business processes and the relevant
importance of their underlying activities to the infor-
mation system and embed them into the standardized
risk assessment process.
The proposed methodology incorporates weights
into the extracted graphs from typical risk assessment
methodologies to provide helpful information on risk
and potential attack vectors on business-driven events
by correlating and analyzing the steps of the business
processes depicted in the graph to the assets used to
complete each step.
Our methodology and developed tool map the ex-
tracted (mined) business process activity graphs to as-
sess the risk of disruptions due to accidental or inten-
tional events and produce weighted risk dependency
graphs presenting how a disruption in one activity may
affect other dependent activities. This automated pro-
cess-based risk dependency analysis allows managers
and security experts to identify security risks and ad-
dress them accordingly, considering the company’s
specific characteristics and requirements.
The implemented tool and evaluation results of a
real-world company showcase that the presented ap-
proach is effective and trustworthy. Results also indi-
cate that process mining can be helpful in risk assess-
ment, as it provides automation and valuable insights
in business process model workflows with minimum
resources compared to manually discovering individ-
ual process activities and their interactions.
Therefore, our approach supports the proactive stu-
dy and analysis, in terms of risk, of business processes
with many process activities and interdependencies,
promoting the concept of process-based risk assess-
ment in business process management.
6.1 Restrictions and Future Work
The presented approach has certain limitations. Like
other empirical risk approaches that analyze dependen-
cies, it relies on previous risk assessments and expert
knowledge to correlate assets to process activities to
evaluate impact. Also, while this approach can identify
paths and activities as high-risk items, it is challenging
to decide the proper mitigation measures to reduce
those risks. Furthermore, process mining is optimized
for individual business processes, which is a restriction
that applies to the proposed methodology. Finally, we
utilized a small dataset of event logs to evaluate our
method. However, adequate for our proof-of-concept
analysis, a larger, well-documented dataset is required
for further examination.
Future work should concentrate on overcoming the
limitations mentioned above. In particular, the consol-
idation of the results for multiple processes should be
addressed so that the methodology can be applied to an
organization. Additionally, the scalability of this ap-
proach should be further examined; the implementa-
tion of this method, and thus the underlying algorithms,
would have to be able to handle large datasets.
ACKNOWLEDGEMENTS
This work has been partially supported by a research
grant offered by the Hellenic Ministry of Digital Gov-
ernance to Athens University of Economics & Busi-
ness (MoDG/AUEB Cybersecurity R&D (2021-22)).
REFERENCES
Aalst, W. van der. (2016). Process mining: Data Science in
action (2
nd
ed.). Springer.
Aalst, W., Dongen, B., Günther, C., Rozinat, A., Verbeek,
E., & Weijters, A. (2009, January). ProM: The Process
Mining Toolkit. Allergy.
Amutio, M., Candau, J., & Mañas, J. (2014). MAGERIT,
Methodology for Information Systems Risk Analysis &
Management. Min. de Administraciones Publicas.
Ani, U., McK Watson, J., Nurse, J., Cook, A., & Maples, C.
(2019). A review of critical infrastructure protection ap-
proaches: Improving security through responsiveness to
the dynamic modelling landscape. Living in the Internet
of Things, 6 (15 pp.)-6 (15 pp.).
Aven, T. (2016). Risk assessment and risk management:
Review of recent advances on their foundation. Euro-
pean Journal of Operational Research, 253(1), 1–13.
Azzini, I., Dido, M., Giannopoulos, G., & Galbusera, L.
(2018). GRRASP: User Manual. Publications Office.
BS ISO/IEC 27001. (2013). Information Technology–Secu-
rity Techniques–Information Security Management Sy-
stems–Requirements. BSI.
Cardoso, P., Respício, A., & Domingos, D. (2021). Riska-
BPMN - a BPMN extension for risk assessment. Pro-
cedia Computer Science, 181, 1247–1254.
Carmona, J. (2018). Decomposed Process Discovery and
Conformance Checking. In S. Sakr & A. Zomaya
(Eds.), Encyclopedia of Big Data Technologies (pp. 1–
7). Springer.
Caron, F., Vanthienen, J., & Baesens, B. (2013). A compre-
hensive investigation of the applicability of process mi-
ning techniques for enterprise risk management. Com-
puters in Industry, 64(4), 464–475.
CLUSIF. (2010). Mehari: Information risk analysis and
management methodology. Club de la Sécurité de
l’Information Français.
http://www.clusif.asso.fr/en/production/mehari/index.a
sp
Towards an Automated Business Process Model Risk Assessment: A Process Mining Approach
45

CORAS. (2010). A Guided Tour of the CORAS Method.
http://www.springer.com/cda/content/docu-
ment/cda_downloaddocument/ 9783642123221-c3.pdf
Gritzalis, D., Iseppi, G., Mylonas, A., & Stavrou, V. (2018).
Exiting the risk assessment maze: A meta-survey. ACM
Computing Surveys, 51, 1, 1-30.
Hompes, B., Verbeek, H., & van der Aalst, W. (2015). Find-
ing Suitable Activity Clusters for Decomposed Process
Discovery. In P. Ceravolo, et al. (Eds.), Data-Driven
Process Discovery and Analysis (Vol. 237, pp. 32–57).
Springer International Publishing.
Jouili, S., & Vansteenberghe, V. (2013). An Empirical
Comparison of Graph Databases. 2013 International
Conference on Social Computing, 708–715.
Kalenkova, A., van der Aalst, W., Lomazova, I., & Rubin,
V. (2017). Process mining using BPMN: Relating event
logs and process models. Software & Systems Model-
ing, 16(4), 1019–1048.
Kotzanikolaou, P., Theoharidou, M., & Gritzalis, D.
(2013a). Assessing n-order dependencies between crit-
ical infrastructures. International Journal of Critical In-
frastructures, 9(1/2), 93.
Kotzanikolaou, P., Theoharidou, M., Gritzalis, D. (2013b).
Cascading effects of common-cause failures on Critical
Infrastructures. Proc. of the 7
th
IFIP International Con-
ference on Critical Infrastructure Protection, 171-182,
Springer (AICT 417).
Lamine, E., Thabet, R., Sienou, A., Bork, D., Fontanili, F.,
& Pingaud, H. (2020). BPRIM: An integrated frame-
work for business process management and risk man-
agement. Computers in Industry, 117, 103199.
List, B., & Korherr, B. (2006). An evaluation of conceptual
business process modelling languages. Proc. of the
ACM Symposium on Applied Computing, 1532.
Lopez, J., Alcaraz, C., & Roman, R. (2013). Smart control
of operational threats in control substations. Computers
& Security, 38, 14–27.
Marin-Castro, H. M., & Tello-Leal, E. (2021). Event Log
Preprocessing for Process Mining: A Review. Applied
Sciences, 11(22), 10556.
Min, H.-S., Beyeler, W., Brown, T., Son, Y., & Jones, A.
(2007). Toward modeling and simulation of critical na-
tional infrastructure interdependencies. IIE Transac-
tions, 39(1), 57–71.
Neo4j Graph Database. (2000). Neo4j Graph Database
Platform. https://neo4j.com/product/neo4j-graph-data-
base/
NIST SP 800-30. (2012). Guide for conducting risk assess-
ments (NIST SP 800-30r1). National Institute of Stand-
ards and Technology.
Peixoto, D., A. Batista, V., Atayde, A., Borges, E., Resen-
de, R., Isaías, C., & Pádua, P. (2008). A Comparison of
BPMN and UML 2.0 Activity Diagrams.
ProM. (2022). https://www.promtools.org/doku.php
Rubio, J., Alcaraz, C., Roman, R., & Lopez, J. (2017). A-
nalysis of Intrusion Detection Systems in Industrial E-
cosystems. Proc. of the 14
th
International Joint Confe-
rence on E-Business and Telecoms, 116–128.
Shao, B., Wang, H., & Xiao, Y. (2012). Managing and min-
ing large graphs: Systems and implementations. Pro-
ceedings of the 2012 International Conference on Man-
agement of Data - SIGMOD ’12, 589.
Song, M., Günther, C., & van der Aalst, W. (2009). Trace
Clustering in Process Mining. In D. Ardagna, et al.
(Eds.), Business Process Management Workshops (pp.
109–120). Springer Berlin Heidelberg.
Stergiopoulos, G., Dedousis, P., & Gritzalis, D. (2020).
Atomatic network restructuring and risk mitigation
through business process asset dependency analysis.
Computers & Security, 96, 101869.
Stergiopoulos, G., Kotzanikolaou, P., Theocharidou, M.,
Lykou, G., & Gritzalis, D. (2016). Time-based critical
infrastructure dependency analysis for large-scale and
cross-sectoral failures. International Journal of Critical
Infrastructure Protection, 12, 46–60.
Stergiopoulos, G., Kouktzoglou, V., Theocharidou, M., &
Gritzalis, D. (2017). A process-based dependency risk
analysis methodology for critical infrastructures. Inter-
national Journal of Critical Infrastructures, 13(2/3),
184.
van der Aalst, W., Adriansyah, A., de Medeiros, A., & Ar-
cieri, F. (2012). Process Mining Manifesto. In Business
Process Management Workshops Vol. 99, pp. 169–194.
Springer Berlin Heidelberg.
van der Aalst, W. (2014). Process Mining Discovery, Con-
formance and Enhancement of Business Processes. Sp-
ringer.
van der Aalst, W., & de Medeiros, A. (2005). Process Min-
ing and Security: Detecting Anomalous Process Execu-
tions and Checking Process Conformance. Electronic
Notes in Theoretical Computer Science, 121, 3–21.
van der Aalst, W., & Dustdar, S. (2012). Process Mining
Put into Context. IEEE Internet Computing, 16(1), 82–
86.
van Dongen, B., de Medeiros, A., Verbeek, H., Weijters,
A., & van der Aalst, W. (2005). The ProM Framework:
A New Era in Process Mining Tool Support, Applicati-
ons and Theory of Petri Nets 2005 (pp. 444–454). Sp-
ringer.
Viner, D., Stierle, M., & Matzner, M. (2021). A Process
Mining Software Comparison. ArXiv:2007.14038 [Cs].
http://arxiv.org/abs/2007.14038
SECRYPT 2022 - 19th International Conference on Security and Cryptography
46
