
Shedding Light on Early Central Nervous System Changes for
Alzheimer’s Disease through the Retina: An Animal Study
Rui Bernardes
1,2 a
, Hugo Ferreira
1 b
, Pedro Guimar
˜
aes
1 c
and Pedro Serranho
1,3 d
1
Coimbra Institute for Biomedical Image and Translational Research, Faculty of Medicine, University of Coimbra,
Edif
´
ıcio do ICNAS, Polo 3 Azinhaga de Santa Comba 3000-548 Coimbra, Portugal
2
University of Coimbra, CACC - Clinical Academic Center of Coimbra, Faculty of Medicine (FMUC), Coimbra, Portugal
3
Department of Science and Technology, Universidade Aberta, Rua da Escola Polit
´
ecnica, 147, 1269-001 Lisbon, Portugal
Keywords:
Optical Coherence Tomography, Retina, Biomarkers, Texture, Convolutional Neural Network, Alzheimer’s
Disease, Mouse Model, Diagnosis.
Abstract:
The World Health Organization (WHO) 2015 projections estimated 75.6 million people living with dementia
in 2030, an update from the 66 million estimated in 2013. These figures account for all types of dementia, but
Alzheimer’s disease stands out as the most common estimated type, representing 60% to 80% of the cases.
An increasing number of research groups adopted the approach of using the retina as a window to the brain.
Besides being the visible part of the central nervous system, the retina is readily available through non-invasive
imaging techniques such as optical coherence tomography (OCT). Moreover, cumulative evidence indicates
that neurodegenerative diseases can also affect the retina. In the work reported herein, we imaged the retina of
wild-type and the triple-transgenic mouse model of Alzheimer’s disease, at the ages of one-, two-, three-, four-,
eight-, twelve- and sixteen-months-old, by OCT and segmented gathered data using a developed convolutional
neural network into distinct layers. Group differences through texture analysis of computed fundus images for
five layers of the retina, normative retinal thickness data throughout the observation period of the ageing
mice, and findings related to the estimation of the ageing effect of the human genes present in the transgenic
group, as well as the classification of individual fundus images through convolutional neural networks, will be
presented and thoroughly discussed in the Special Session on ”New Developments in Imaging for Ocular and
Neurodegenerative Disorders”.
1 INTRODUCTION
A biomarker of dementia from a non-invasive, widely
available and inexpensive imaging technique is of ut-
most importance. Biomarkers can provide insights
into the underlying pathophysiology and may be used
as inclusion criteria and outcome measures for clin-
ical trials (Ahmed et al., 2014). Also, the technique
should not be based on the loss of tissue (since it oc-
curs in the late stages of the disease) and have the
property of not being specific for the type of demen-
tia. Such a technique is of paramount importance to
shed light on the changes unfolding in the retina.
Even though the number of people with dementia
is increasing rapidly (Alzheimer’s & Dementia, 2020)
a
https://orcid.org/0000-0002-6677-2754
b
https://orcid.org/0000-0003-1199-8489
c
https://orcid.org/0000-0002-9465-4413
d
https://orcid.org/0000-0003-2176-3923
and several research groups focused on this significant
problem using the eye as a window to the brain, two
major issues persist with the non-invasive followed
approaches to date. First, research groups focused
their attention on the measurement of the thickness
of the retinal nerve fibre layer (RNFL) of the imaged
retina and reported the thinning of the RNFL, even
though with inconsistent results. Moreover, this thin-
ning occurs in the late stages of the disease, mak-
ing it useless as a screening technique. Second, the
most common form of dementia –Alzheimer’s dis-
ease (AD)– can remain undiagnosed for years (Habib
et al., 2017; Krantic and Torriglia, 2014) and can
only be definitely diagnosed post-mortem (Krantic
and Torriglia, 2014), despite that ”...the degree of at-
rophy on MRI correlates well with Braak staging at
autopsy.” (Jack et al., 2010) (MRI – magnetic reso-
nance imaging).
Both these problems have the same drawback:
Bernardes, R., Ferreira, H., Guimarães, P. and Serranho, P.
Shedding Light on Early Central Nervous System Changes for Alzheimer’s Disease through the Retina: An Animal Study.
DOI: 10.5220/0011125600003209
In Proceedings of the 2nd International Conference on Image Processing and Vision Engineering (IMPROVE 2022), pages 247-258
ISBN: 978-989-758-563-0; ISSN: 2795-4943
Copyright
c
2022 by SCITEPRESS – Science and Technology Publications, Lda. All rights reserved
247

used biomarkers are valid only in the late stages of
the disease. Thus, none can determine its onset when
therapeutic intervention may have effective results on
its progression (Hart et al., 2016). These drawbacks
call for a distinct approach from the current and fore-
seen ones (Ahmed et al., 2014).
We took the initial steps towards a potential so-
lution by conducting exploratory tests using a novel
approach to tackle the above problems. Using a su-
pervised machine learning algorithm – support vector
machine (SVM) – we explored the hypothesis that the
human retina’s optical coherence tomography (OCT)
data embeds information on neurodegeneration not
perceivable by direct observation. The underlying ra-
tionale is the sensitive nature of OCT to subtle refrac-
tive index changes and the amount of data gathered
from the ocular fundus. Even though minor differ-
ences cannot be individually detected, they may still
influence the statistics of the global data. Prelimi-
nary studies showed the possibility of discriminating
healthy controls by age group and discriminating be-
tween healthy controls and patients diagnosed with
Alzheimer’s, Multiple Sclerosis and Parkinson’s dis-
ease (Nunes et al., 2019), thus confirming our work-
ing hypothesis and rationale.
Keeping in mind the second problem, that AD
can only be confirmed post-mortem, the alterna-
tive comes from the triple-transgenic mouse model
of Alzheimer’s disease (3×Tg-AD) (Oddo et al.,
2003). It develops age-dependent amyloid-beta and
tau pathologies, activated microglia, loss of synapses
and neurodegeneration (Kitazawa et al., 2012).
Therefore, in the work herein reported, we rely
on the 3×Tg-AD to identify the very early signs
of disease and monitor the evolution of these signs.
This approach allows us to determine which struc-
tures (layers) of the retina will be affected, their rela-
tive levels of change to the healthy condition and the
sequence of events, that is, which structures show dif-
ferences to the healthy state and in which chronolog-
ical order.
Our preliminary data using healthy controls (WT
– wild-type) and 3×Tg-AD mouse model imaged
by an OCT allowed concluding that the results are
consistent despite the human/mouse biological differ-
ences and the differences in instrumentation. It is pos-
sible to discriminate between healthy and unhealthy
subjects in both cases. These findings pave the way to
study further the changes over time from the animal
model of disease and look for similar changes in avail-
able data from the human retina, considering different
pathologies and healthy controls. Interestingly, even
though studies on the central nervous system (CNS)
in animals do not commonly readily translate to hu-
mans, our data suggest a parallelism between OCT
data from animals and humans.
The works of La Morgia et al. (Morgia et al.,
2016) and Sch
¨
on et al. (Sch
¨
on et al., 2012) show, re-
spectively, the accumulation of amyloid-beta deposits
in and around melanopsin retinal ganglion cells and
the presence of hyperphosphorylated tau in the inner-
most layers of the retina from AD patients. These
findings support the hypothesis that the analysis of
fundus projection images computed from OCT data
(see (Guimar
˜
aes et al., 2014)) may embed useful in-
formation on the content of the retina concerning
CNS changes.
The texture analysis of the computed fundus im-
ages for distinct layers of the mouse retina revealed
differences in texture between the WT and the 3×Tg-
AD groups and the nature of these differences over
time, suggesting a cumulative effect of the ageing and
that of the disease’s associated genes for the trans-
genic mice group.
Despite this exploratory approach, achieved re-
sults strongly suggest the presence of useful infor-
mation on the status of the CNS within the com-
puted fundus references, in agreement with (Morgia
et al., 2016; Sch
¨
on et al., 2012). The importance of
such a finding is fivefold. First, texture-based met-
rics may provide additional information to strengthen
the biomarker of CNS neurodegeneration. Second, it
may lead to discrimination between different forms
of neurodegeneration. Third, it may lead to a very
early biomarker of dementia and, in consequence,
shed light on the pathogenesis of the disease. Fourth,
it may identify the window for treatment before a late-
stage where treatment of CNS degeneration is ineffec-
tive and, fifth, for the efficient monitoring of therapy
efficacy.
Despite the hurdles, we could confirm, over time
and using different populations of controls and pa-
tients, that gathered data from the ocular fundus em-
beds valuable information on the human CNS. Fur-
thermore, using WT and the triple-transgenic mouse
model of AD and different instrumentation, we could
replicate findings in humans and mice solely based on
OCT data of the retina, bridging the gap between hu-
man and animal findings on the CNS status, based on
the fact that the exploratory results are consistent in
humans and mice. This bridge is of high interest by
opening the possibility of developing biomarkers of
AD using non-invasive and widely available instru-
mentation.
The independent analysis of the distinct retinal
layers calls for the segmentation of OCT data, where
the images are divided into regions corresponding to
retinal layers or layer-complexes and the background
Imaging4OND 2022 - Special Session on New Developments in Imaging for Ocular and Neurodegenerative Disorders
248

(vitreous and choroid). Over time, several approaches
have been proposed to address this challenging prob-
lem since the introduction of the OCT in clinical prac-
tice, starting with time-domain systems, when the res-
olution was only a fraction of the current one.
Current methods can be divided into mathematical
methods and machine learning approaches. Mathe-
matical methods encode all retinal information known
a priori into mathematical models towards the seg-
mentation. These models are, however, difficult to
obtain, and even more so to capture variations from
different mice strains and various pathologies, primar-
ily where significant differences in the structure ap-
pearance of the retina (Berger et al., 2014; Soukup
et al., 2019) and significant differences in image con-
trast are found within the same B-scan, across differ-
ent B-scans, and eyes.
The mathematical approaches aiming to detect
retinal interfaces bounding the respective retinal lay-
ers include Markov modelling (Koozekanani et al.,
2021), active contour modelling (Yazdanpanah et al.,
2011), variational methods (Rathke et al., 2014), and
graph-based methods (Chiu et al., 2010; Dufour et al.,
2013; Srinivasan et al., 2014; Fang et al., 2017).
In particular, graph-based approaches have shown
promising results for the segmentation of several reti-
nal interfaces. However, graph-based techniques typ-
ically use constraints to achieve better segmentation
performances (Dufour et al., 2013). Unfortunately,
while these constraints help produce good results for
the datasets over which the methods were developed,
these methods are tuned for a particular dataset. Fur-
thermore, these methods typically make use of pre-
processing (e.g. denoising (Srinivasan et al., 2014))
and post-processing steps, as well as heuristics, to
achieve reported results (Chiu et al., 2010). More
recently, a combination of graph-based methods and
machine learning has been explored, where the ma-
chine learning output is used as the basis for the
graph-search method (Fang et al., 2017).
Machine learning approaches address the problem
distinctly. These typically employ pixel classification
techniques, either by classifying each pixel as belong-
ing to a layer (semantic segmentation) or a bound-
ary (interface detection). Deep learning methods have
gained momentum in general computer vision appli-
cations and eye research (Sarhan et al., 2020), espe-
cially convolutional neural networks (CNN). Over the
last few years, deep learning approaches have been
proposed to solve the retinal segmentation problem
(Roy et al., 2017; Antony et al., 2017; Ngo et al.,
2020; Venhuizen et al., 2017). However, despite
achieved results, most published works in this field
address the human retina, therefore not suitable for
mice due to the vast differences in the retinal struc-
ture between human and rodent retinas.
While there is a growing body of work on deep
learning applied to rodents’ OCT data, these mod-
els are generally trained on a narrow age range and
use a single mice strain/pathology (Roy et al., 2017;
Morales et al., 2021). Consequently, age-related
changes, both in healthy ageing and potentially more
so in neurodegenerative diseases, like Alzheimer’s
disease (Chiu et al., 2012; London et al., 2013), are
not considered, again restricting the applicability of
these methods to a limited strain, age range, and con-
dition.
In this work, we make use of a deep learning
process to address the identification of 10 image re-
gions (7 retinal layers, 1 layer-complex, vitreous,
and choroid) while imposing the following constraints
into the process: a neural network as small as pos-
sible aiming the minimum number of parameters,
no significant pre-processing (e.g. no denoising re-
quired), take the known organisation into account and
cope with a wide range of ages, mice strains, healthy
and pathological cases (diabetes and neurodegenera-
tive cases). We leave out anatomical abnormalities
like cystoids, retinal detachments, holes, and similar
changes in the retina, as these are not within the scope
of our research.
2 MATERIALS AND METHODS
2.1 Data
2.1.1 Ethics Statement
This study was approved by the Animal Welfare
Committee of the Coimbra Institute for Clinical and
Biomedical Research (iCBR), Faculty of Medicine,
University of Coimbra, and by Direc¸
˜
ao-Geral de
Alimentac¸
˜
ao e Veterin
´
aria (DGAV). All procedures
involving mice were conducted as per the Associa-
tion for Research in Vision and Ophthalmology state-
ment for animal use, and in agreement with the Eu-
ropean Community Directive Guidelines for the care
and use of nonhuman animals for scientific purposes
(2010/63/EU), transposed into the Portuguese law in
2013 (DL113/2013).
2.1.2 Mouse Characterisation
In this study, 57 mice from each strain, C57BL6/129S
and 3×Tg-AD, were used, at the ages of one to four
months old and at eight, twelve and sixteen months
old, and considering both left and right eyes. All
Shedding Light on Early Central Nervous System Changes for Alzheimer’s Disease through the Retina: An Animal Study
249
mice were housed and maintained at the vivarium of
iCBR, Faculty of Medicine, University of Coimbra,
and were on a 12-h light/dark cycle with free access
to both food and water.
2.1.3 Experimental Setup
Concerning OCT imaging preparation, mice were
anaesthetised using a mixture of 80 mg/kg of ke-
tamine and 5 mg/kg of xylazine. The pupils were di-
lated using a solution of 0.5% tropicamide and 2.5%
phenylephrine. Additionally, oxibuprocaine, a local
anaesthetic, was used. Eyes were regularly lubricated
using eye drops (1% carmellose).
All retinas were imaged by a Micron IV OCT
System (Phoenix Technology Group, Pleasanton, CA,
USA). It creates a volume per acquisition composed
of 512 B-scans, each with 512 A-scans of 1024 val-
ues in length; B-scans are saved as a non-compressed
TIFF file image.
The system presents an imaging depth of 1.4 mm
and an axial resolution of 3 µm, as determined by the
superluminescent diode’ bandwidth and central wave-
length, 160 and 830 nm, respectively. All scans were
taken by the same operator in the same retinal region
using the optic disc as a landmark, centred horizon-
tally with the optic disc and vertically above it.
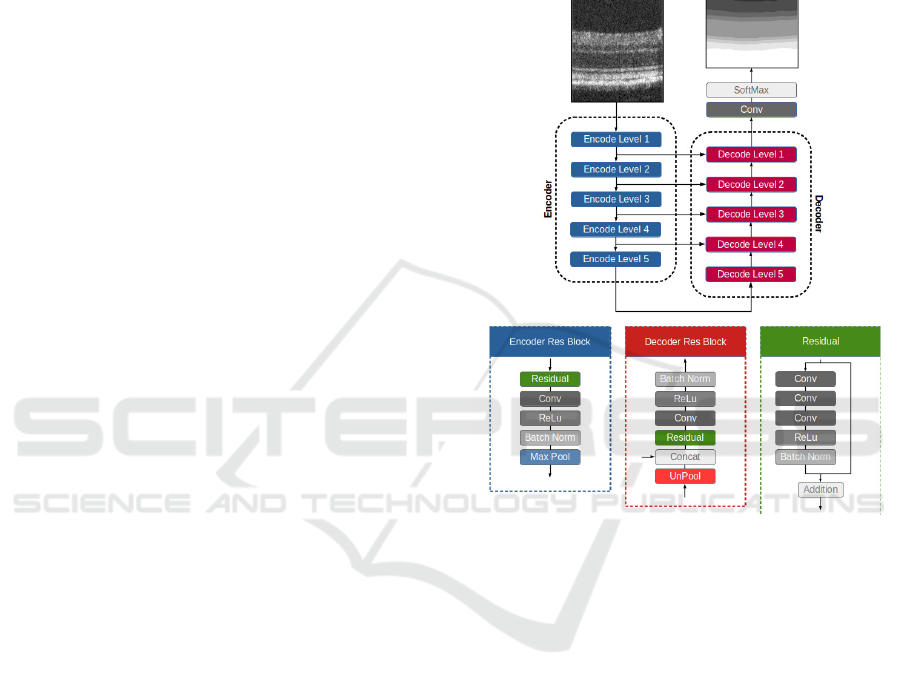
2.2 Segmentation Neural Network
The neural network for the retina segmentation builds
upon the U-Net (Ronneberger et al., 2015). This
fully convolutional neural network combines local
and global information to create a more accurate im-
age segmentation process. This architecture consists
of two symmetric paths, an encoder path, where the
size of the feature maps is reduced to capture the
global information, and a decoder path, where feature
maps produced by the encoder are upscaled to match
the input image size. In addition, skip-connections
were also used to transfer features maps from the en-
coding path to the respective level of the decoding
path (Figure 1), which allows achieving better data lo-
calisation. Finally, the classification block allows for
semantic segmentation from the feature maps, where
classes represent retinal layers/layer-complex, vitre-
ous, and choroid, towards identifying classes’ bound-
aries (interfaces).
Furthermore, the proposed architecture uses resid-
ual learning (He et al., 2016; Zhang et al., 2018;
Jha et al., 2019; Diakogiannis et al., 2020). Resid-
ual learning has improved neural network learning by
helping with derivative propagation during the train-
ing process (He et al., 2016).
All convolutions made use of stride 1 and kernel
3×3 in size. Also, zero-padding was used to preserve
the dimensions of feature maps in each convolutional
layer. Batch Normalisation (BN) and ReLu (Rectified
Linear Unit) were used to prevent over-fitting of the
neural network (Ioffe and Szegedy, 2015) and intro-
duce non-linearity in the training process. For details
on the neural network, see Table 1.
Figure 1: Semantic segmentation neural network scheme
employed to segment OCT’s B-scans.
2.2.1 Encoding / Decoding Blocks
Each block of the encoding path starts with a resid-
ual learning block, followed by a convolution, BN
and ReLu activation layers (Figure 1). During this
process, the number of channels is doubled. Finally,
the encoding block ends with a max-pooling layer
to halve feature maps’ size, using a 2×2 kernel and
stride 2.
The decoding blocks start with the upscaling of
the respective feature maps, combined with the fea-
ture maps from the corresponding encoding level.
The remaining steps are similar to the encoding
blocks. First, a residual block is used, followed by
a convolution, BN and ReLu activation layer (Fig-
ure 1). In each decoding/encoding block, the number
of channels is halved/doubled.
The classification is achieved using a convolu-
tional layer with a 1 × 1 kernel and reduces the num-
ber of channels to match the number of classes (10),
Imaging4OND 2022 - Special Session on New Developments in Imaging for Ocular and Neurodegenerative Disorders
250

Table 1: Network structure.
Unit Level Layer / Block Filter (Kernel / channels) Stride Output Size
Input 768 x 512 x 1
Encoder Level 1 Residual 3x3 / 16 1 768 x 512 x 16
Conv 3x3 / 16 1 768 x 512 x 16
Level 2 Residual 3x3 / 32 1 384 x 256 x 32
Conv 3x3 / 32 1 384 x 256 x 32
Level 3 Residual 3x3 / 64 1 192 x 128 x 64
Conv 3x3 / 64 1 192 x 128 x 64
Level 4 Residual 3x3 / 128 1 96 x 64 x 128
Conv 3x3 / 128 1 96 x 64 x 128
Level 5 Residual 3x3 / 256 1 48 x 32 x 256
Conv 3x3 / 256 1 48 x 32 x 256
Decoder Level 5 Residual 3x3 / 256 1 48 x 32 x 256
Conv 3x3 / 256 1 48 x 32 x 256
Level 4 Residual 3x3 / 128 1 96 x 64 x 128
Conv 3x3 / 128 1 96 x 64 x 128
Level 3 Residual 3x3 / 64 1 192 x 128 x 64
Conv 3x3 / 64 1 192 x 128 x 64
Level 2 Residual 3x3 / 32 1 384 x 256 x 32
Conv 3x3 / 32 1 384 x 256 x 32
Level 1 Residual 3x3 / 16 1 768 x 512 x 16
Conv 3x3 / 16 1 768 x 512 x 16
Output Conv 1x1 / 10 1 768 x 512 x 10
Output 768 x 512 x 1
followed by a softmax activation.
2.2.2 Loss Function
The cross-entropy loss function is used (eq. 1) where
ω is the weigh function (with custom weight per
pixel), g
l
is the ground truth for class l, and p
l
is the
neural network prediction for class l. This weighting
scheme aims two-fold: to produce accurate classifi-
cations near interface locations; and reduce the likeli-
hood that misclassifications occur near the interfaces.
The second goal is of particular interest as it is
not intended to boost efficiency. Indeed, its contri-
bution in this regard may be negligible. However, it
helps the overall method by reducing the number of
classification errors close to interfaces that would be
difficult, if not impossible, to solve with further pro-
cessing. On the other hand, errors away from inter-
faces can be solved based on a priori information on
the retina, namely that each layer is present (manda-
tory) for the entire B-scan and that layers are strictly
stratified.
L
cross
= −
∑
l
∑
x
ω(x, l)g
l
(x)log(p
l
(x)). (1)
The weight function (ω) is composed of two
components: one captures the differences between
classes, and another differentiates the relevance of
pixels within the same class. The first component is
the class weights determined by the inverse of the rel-
ative frequency of each class
Γ(l) =
1
f (l)
.
The second component uses the distance to the
nearest interface to calculate a weight per pixel. As
determined above, this gives higher weights for pix-
els closer to interfaces. This weight is computed by:
α(x, l) = e
−
d(x,l)
σ
2
, (2)
where d(x, l) is the distance to the nearest interface,
and σ = 15 as determined based on the thickness of
the thinnest layer. The weight function was built such
that the pixel weight is added as a factor for the class
weight:
ω(x, l) = Γ(l)(1 + α(x, l)). (3)
2.3 Datasets
Mice were separated into two sets, one for training
and validation (N=96) and one for testing (N=18),
each with a balanced distribution of WT and 3×Tg-
AD mice. This mice-based split ensures the complete
separation between data used for training and testing.
The training set was built by randomly consider-
ing 25 volumes from each group and the first four
time-points. From each volume, 15 B-scans were ran-
domly selected, with a minimum separation of 5 B-
scans to reduce the similarities between selected B-
Shedding Light on Early Central Nervous System Changes for Alzheimer’s Disease through the Retina: An Animal Study
251
scans, yielding a training set of 3000 B-scans (25 vol-
umes × 2 groups × 4 time points × 15 B-scans).
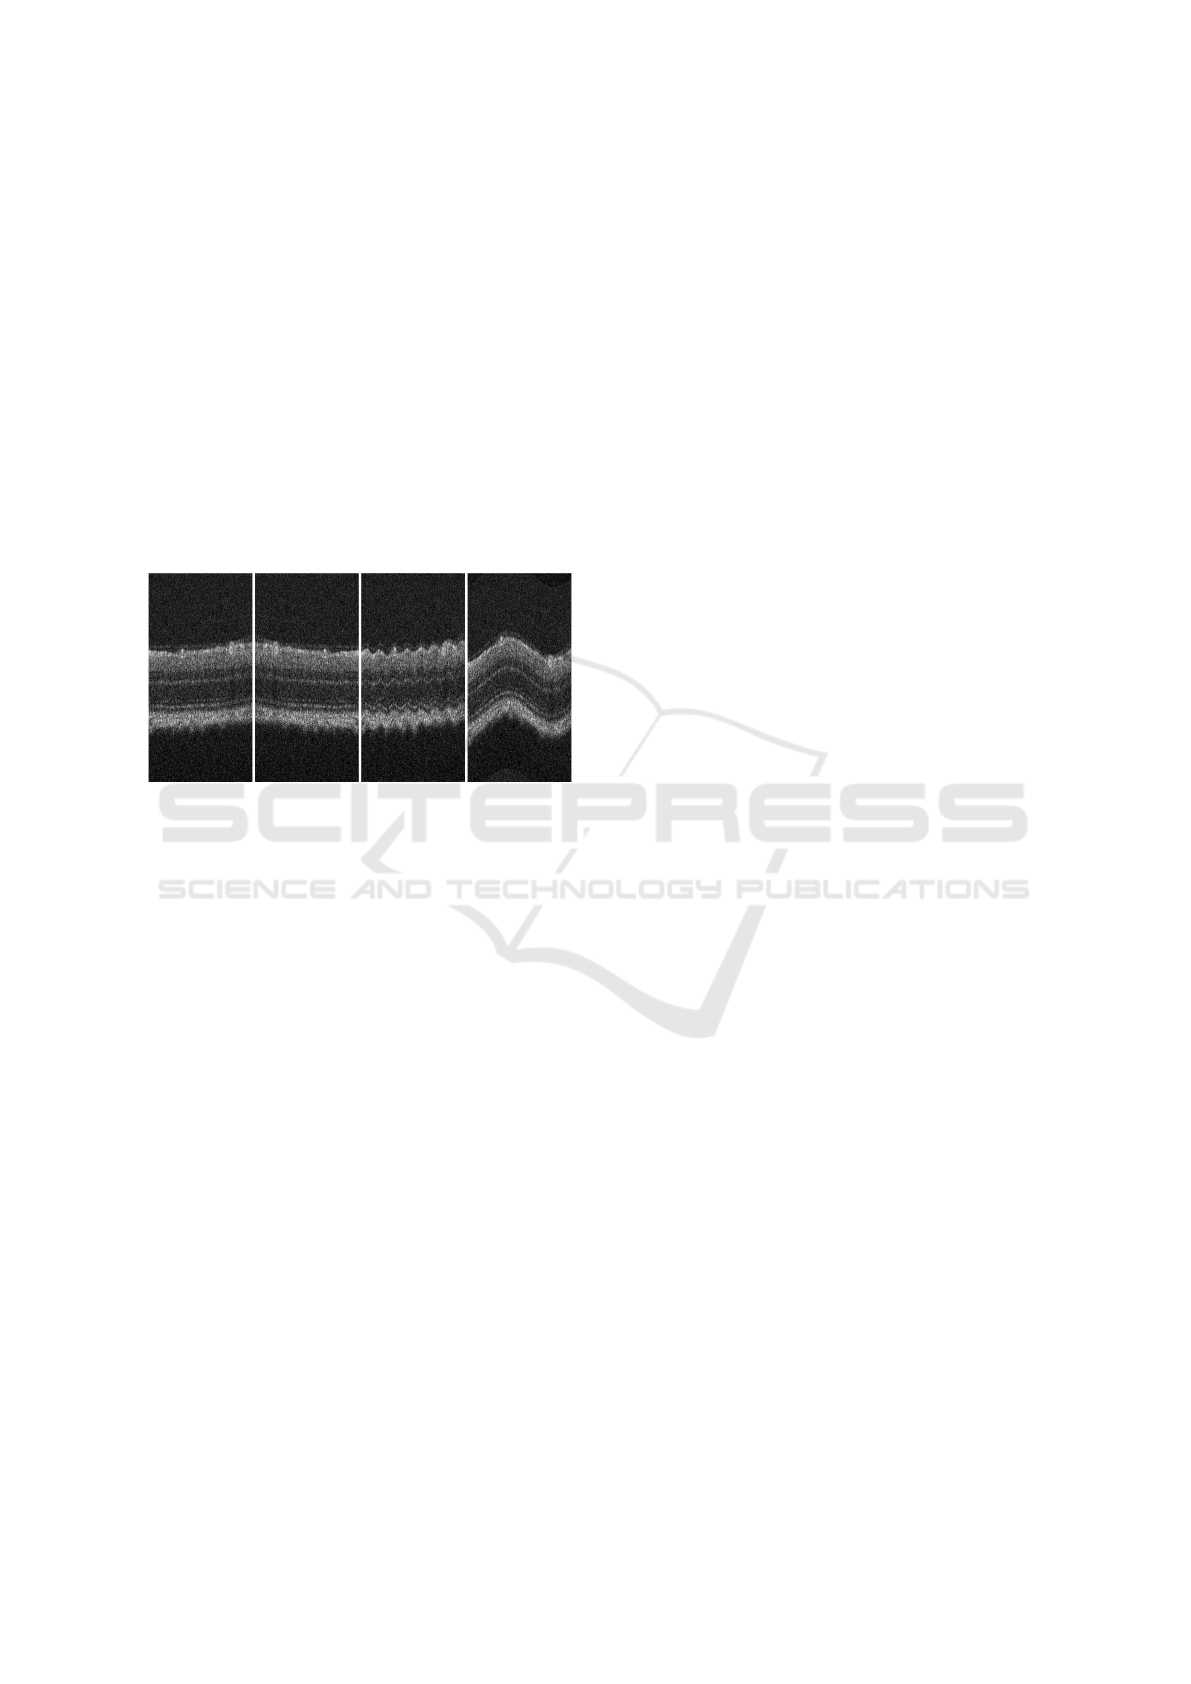
Horizontally mirroring and sinusoidal vertical dis-
placements were used towards data augmentation to
reduce over-fitting and introduce further variability
in the used dataset. The latter uses a sine function
(t(x) = K sin(2π f x + φ)) to determine the vertical
translation of each A-scan across the B-scan. In this
work, we used two sets of range for two of the param-
eters, K and f , one focusing on low amplitude and
high frequency distortions and one focusing on high
amplitude and low frequency. These parameters were
randomly set for each B-scan in the training dataset.
The phase, φ, was not constrained in any way. The
resulting images and the original B-scan example are
shown in Figure 2.
Figure 2: Example of data augmentation, from left to right:
original B-scan, mirrored B-scan, sinusoidal displacements,
respectively low amplitude/high frequency and high ampli-
tude/low frequency.
The ground truth used to train a neural network
is often provided by experts’ manual segmentation
of images composing the training set. However, this
is not a viable option for the current number of im-
ages because of the burden, the time required, and all
associated costs. Hence, a semi-automated process
was used where segmentations were performed based
on image and signal processing techniques (Ferreira
et al., 2020), first and then validated and corrected,
wherever required, by experts.
From the split into training and validation sets (see
above), 180 volumes (92 160 B-scans — 18 mice)
composed the test set.
These volumes were segmented by the developed
neural network (Figure 1) to produce five mean value
fundus images (MVF) (Guimar
˜
aes et al., 2014), each
corresponding to a distinct anatomical layer/layer-
complex of the retina, specifically the retinal nerve
fibre and ganglion cell layer complex (RNFL-GCL),
the inner plexiform layer (IPL), the inner nuclear
layer (INL), the outer plexiform layer (OPL), and the
outer nuclear layer (ONL).
2.4 Training
The Adam method (Kingma and Ba, 2015) was used
during training using a batch size of 8. The initial
learning rate was set to 10
−3
and subsequently re-
duced by a factor of 0.75 when error plateaus. Early
stopping was used to prevent over-fitting, and both
learning rate and early stopping used the validation
accuracy as the performance metric.
All processing was done in Python 3.7.9, with the
neural network models using the Keras 2.7 (Chollet,
2015) framework with TensorFlow 2.7 as backend
(Abadi et al., 2016). The training was performed in
a Ubuntu desktop, equipped with an AMD Rysen 9
3900x CPU @3.8 GHz with 12 cores, 64 GB RAM,
and an Nvidia RTX 3060 with 12 GB of memory, us-
ing version 11.5 of CUDA.
2.5 Interface Detection
The CNN proposed herein produces the semantic seg-
mentation of a single B-scan towards the ultimate
goal of determining the interfaces between retinal
layers/layer-complexes, as shown in Figure 3. A vali-
dation step was implemented at the level of individual
A-scans, and an A-scan is considered correctly seg-
mented if fulfilling the following criteria:
1. all layers are present;
2. any layer can only appear once;
3. the order of the layers is fixed;
4. each layer thickness is consistent across all A-
scans of this B-scan.
These criteria are possible because the optic disc is of
no interest for the present study and only retinas close
to the healthy status are of interest. Therefore, thick-
ness’ variability throughout the B-scan is expected to
be low to all layers.
2.6 Texture Analysis
A MVF was computed for each of the segmented
layers/layer-complexes (Figure 4), with texture anal-
ysis being carried out based on the grey-level co-
occurrence matrices (GLCM) (Haralick et al., 1973)
after reducing the number of grayscale levels from
65536 (16 bits) to 16 (4 bits). Twenty features were
determined per block as in (Soh and Tsatsoulis, 1999)
and (Haralick et al., 1973), and direction. Further-
more, four directions (0º, 45º, 90º and 135º) with sym-
metry ON and scale (pixel distance) of one pixel led
to four GLCM per block (24 × 24 blocks of 20 × 20
pixels each). Each feature was then considered the
Imaging4OND 2022 - Special Session on New Developments in Imaging for Ocular and Neurodegenerative Disorders
252
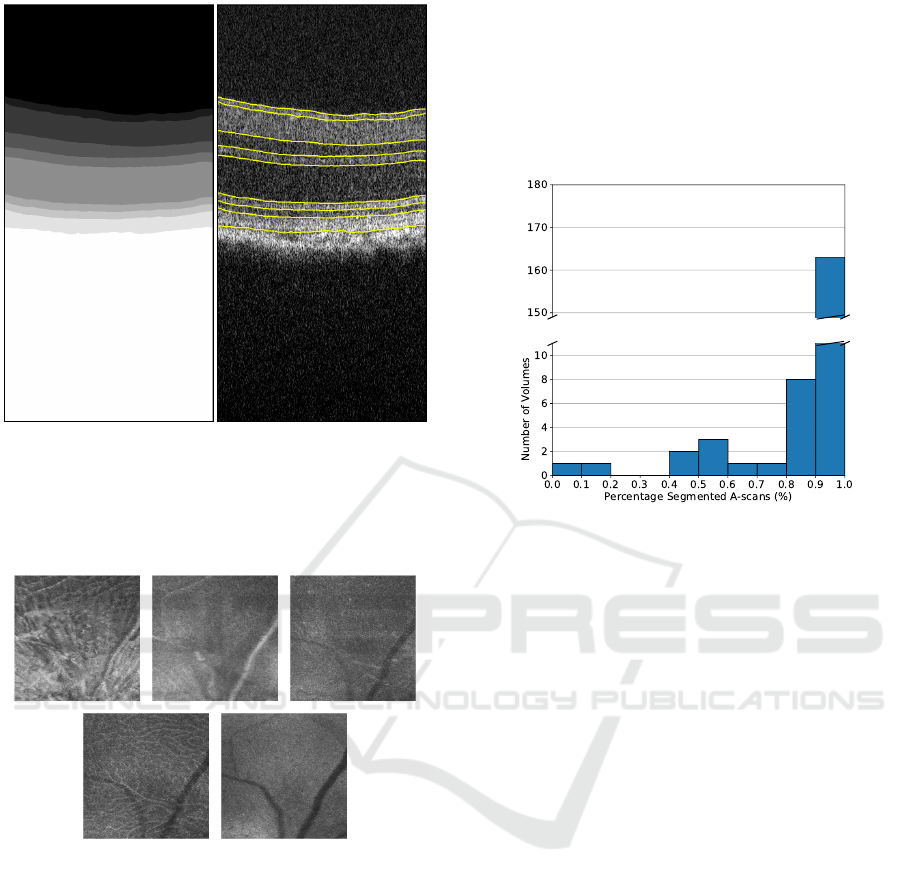
Figure 3: Semantic segmentation (left) and corresponding
interface detection (right) for an example B-scan.
maximum across the four directions to decouple fea-
tures’ values from the orientation, resulting in 20 fea-
tures per block.
Figure 4: Mean value fundus images of a triple-transgenic
mouse model of Alzheimer’s disease. From left to right and
top to bottom: retinal nerve fibre layer-ganglion layer com-
plex; inner plexiform layer; inner nuclear layer; outer plex-
iform layer, and; outer nuclear layer.
3 RESULTS
3.1 Segmentation Capability
In addition to the performance of the segmentation,
concerning the ground truth segmentation, it is es-
sential to assess the feasibility of the segmentation
process to deliver results for a significant number of
cases. This work deals with retinas with significantly
different appearances due to the study duration. In-
deed, the retina of a mouse at one-month-old does
look significantly different from that at twelve or six-
teen months old.
The histogram of the fraction of A-scans cor-
rectly segmented, following the criteria outlined in
section 2.5, is presented in Figure 5. Here, 163 of
the 180 volumes of the test set present 90% to 100%
of A-scans with valid segmentations at all layers.
Figure 5: Histogram of the fraction of A-scans with valid
segmentations at all layers.
A threshold was established from the histogram
above, and only data from volumes with at least 90%
of A-scans correctly segmented were considered. Ta-
ble 2 presents the fraction of these volumes from the
test set by group, eye and age. The number of vol-
umes on the test set varies because of the exclusion of
data due to image quality and the death of mice during
the studied period.
Overall, the segmentation works well in all cases.
However, two particular instances stand out at three
and sixteen months old, both for the control group.
These volumes belong to the same three mice in both
cases. This fact suggests that these consistent errors
are mice specific rather than a segmentation problem.
The texture analysis found extensive and statisti-
cally significant differences between groups.
3.2 Thickness
3.2.1 Normative Data
A normative database was generated based on the
512 × 512 thickness value maps by computing the av-
erage and standard deviation for 3× 3 blocks. Indeed,
a normative 3 × 3 thickness map was computed per
group and time point. An example of a normative
map is provided in Figure 6, along with two appli-
cation examples. A detailed and thorough analysis of
the normative database will be provided in a subse-
quent publication.
Shedding Light on Early Central Nervous System Changes for Alzheimer’s Disease through the Retina: An Animal Study
253
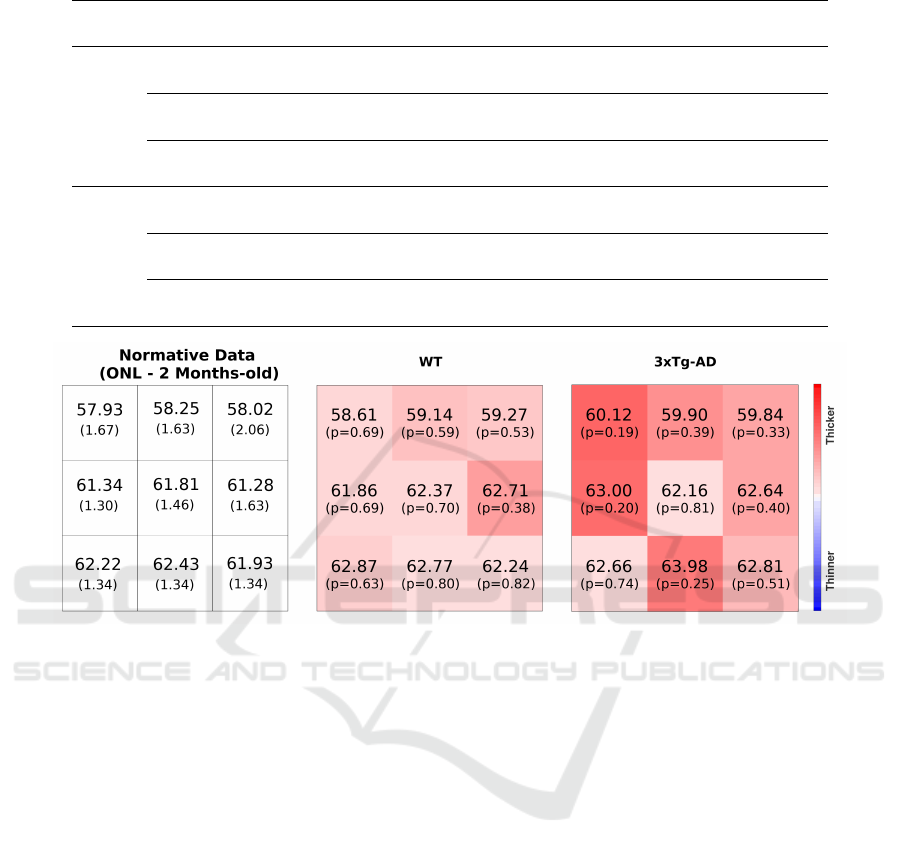
Table 2: Fraction of volumes of the test set correctly segmented by group, eye and age.
Group Eye
One Two Three Four Eight Twelve Sixteen
Month Months Months Months Months Months Months
WT
OD
9 / 9 6 / 6 6 / 6 6 / 6 5 / 6 6 / 6 5 / 6
(100%) (100%) (100%) (100%) (83.3%) (100%) (83.3%)
OS
8 / 9 6 / 6 3 / 6 6 / 6 6 / 6 5 / 6 3 / 6
(88.9%) (100%) (50%) (100%) (100%) (83.3%) (50%)
Total
17 / 18 12 / 12 9 / 12 12 / 12 11 / 12 11 / 12 8 / 12
(94.4%) (100%) (75%) (100%) (91.7%) (91.7%) (66.7%)
AD
OD
8 / 8 7 / 9 8 / 8 5 / 6 6 / 6 5 / 5 3 / 3
(100%) (77.8%) (100%) (83.3%) (100%) (100%) (100%)
OS
8 / 8 7 / 8 8 / 8 5 / 6 6 / 7 4 / 5 3 / 3
(100%) (87.5%) (100%) (83.3%) (85.7%) (80%) (100%)
Total
16 / 16 14 / 17 16 / 16 10 / 12 12 / 13 9 / 10 6 / 6
(100%) (82.4%) (100%) (83.3%) (92.3%) (90%) (100%)
Figure 6: Left: normative thickness values (µm) for the outer nuclear layer (ONL) of WT mice (two-months-old). Thickness
maps for a WT and a 3×Tg-AD mouse (both two-months-old). WT – wild-type; 3×Tg-AD – triple-transgenic mouse model
of Alzheimer’s disease.
3.2.2 Group Differences
The comparison between groups shows consistent
retinal layer differences with the 3×Tg-AD group
presenting a decreased layer thickness except for the
RNFL-GCL complex, where the 3×Tg-AD group
presents an increased thickness, and the ONL, where
thickness values match one another. This finding (at
the RNFL-GCL complex) is against common results
reporting decreased RNFL thickness. Nevertheless,
in the present study, two layers aggregated are consid-
ered because, in these animal groups, it is not possible
to distinguish the RNFL from the GCL.
3.2.3 Age Differences
We demonstrated different behaviours for the retina’s
layers with ageing based on collected data. While
some get thicker over time, some get thinner, and
some keep the same for the reported period, estab-
lishing a thickness normative database (Ferreira et al.,
2021) for each layer, location and time point that can
be used for other comparative studies. A thorough
analysis will be the subject of a subsequent publica-
tion.
3.3 Texture Analysis
From MVF images computed per retinal layer/layer-
complex, as shown in Figure 4, texture analysis met-
rics were computed as disclosed in section 2.6. Four
retinal fundus regions (quadrants) were considered
by averaging 12 × 12 blocks to find widespread sta-
tistically significant differences between groups over
the imaged area and across all retinal layers/layer-
complex. Details for the ONL are presented in Ta-
ble 3 as an example. A thorough analysis will be the
subject of a subsequent publication.
Imaging4OND 2022 - Special Session on New Developments in Imaging for Ocular and Neurodegenerative Disorders
254
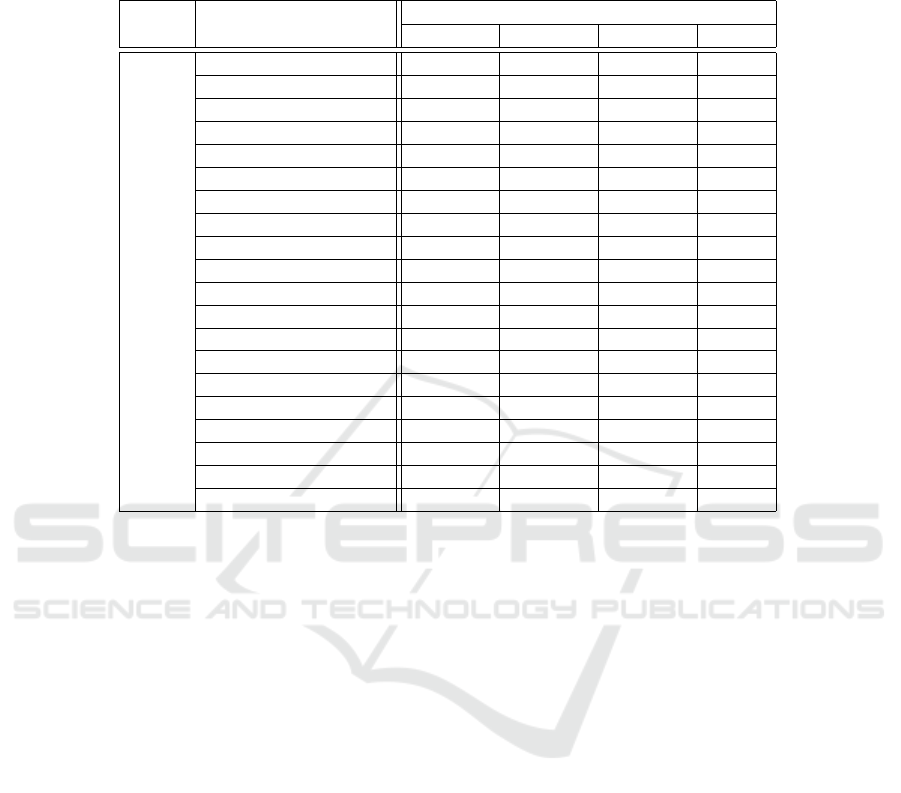
Table 3: Features with statistically significant differences between wild-type and transgenic mice groups for the outer nuclear
layer (ONL). The number of symbols identifies the number of quadrants where the significance was observed for each feature
shown. The green-coloured circles (○) represent a p-value ≤ 0.05, the orange-coloured squares () show p-values ≤ 0.01
and the red-coloured asterisks (*) represent a p-value ≤ 0.001.
Layer Feature
Age (months)
1 2 3 4
ONL
Autocorrelation **** **** *** ○*
Contrast **** **** *** *
Correlation ** ○ ○ ○*
Cluster Prominence **** **** *** *
Cluster Shade **** **** **** ○○
Dissimilarity **** **** **** **○
Energy **** **** **** *○
Entropy **** *** **
Homogeneity **** **** *** *
Maximum Probability **** **** *** *
Sum of Squares **** **** **
Sum Average **** *** ** ○*
Sum Variance **** **** **** **○
Sum Entropy **** **** *** *
Difference Variance **** **** *** *
Difference Entropy ○
IMC1 **** **** **** ○
IMC2 ○ ○
INN **** *** *** ○*
IDN **** *** ○** ○*
4 DISCUSSION AND
CONCLUSIONS
Along the work developed over three years, we con-
tinuously monitor two mice groups, a WT control
group and the 3×Tg-AD, by frequent imaging their
retina by OCT to gather knowledge on the healthy
ageing, the ageing of transgenic mice and the differ-
ence between groups in particular how these compare
over time.
This is the first time mice are consistently imaged
since their young age (one-month-old), demonstrating
an immature retina and shedding light on changes at
the early stages of life.
We have developed a neural network model for
retina segmentation based on the U-Net architecture
and using a new weighting scheme to adapt it to our
objectives. This weighting scheme is pixel-based and
calculated based on the pixels’ distance to the nearest
interface, allowing the prioritisation of the areas close
to the interfaces to produce fewer errors at interface
locations.
To train this model, we used 114 mice from the
two groups. A semi-automated strategy was em-
ployed to determine the ground truth of the selected
B-scans, as the amount of data available makes it dif-
ficult, if not impossible, to produce manual segmenta-
tion for all B-scans. A previously detailed algorithm
(Ferreira et al., 2020) was used to create the initial
segmentation, with manual review and corrections,
wherever needed, from expert graders.
The training and test sets were separated by
mouse, guaranteeing the complete separation between
the two groups. Furthermore, only data from the first
four time-points were considered during training, re-
sulting in 3000 B-scans being used for training. These
were augmented to increase the training set and in-
troduce variations in the layer location and shape to
reduce the possibility of over-fitting.
The results from the test set showed that the model
successfully segmented over 90% of A-scans for the
large majority of the volumes in the test set. We
present the number per group, eye and age by taking
this value as a threshold to consider a volume cor-
rectly segmented.
While we do not see any bias towards any partic-
ular group or time point, only 50% of the left eyes for
mice three and sixteen months old were correctly seg-
mented. A thorough analysis revealed that these eyes
came only from three mice, implying that these errors
might be specific to these mice and not a general lim-
itation of the segmentation process.
Shedding Light on Early Central Nervous System Changes for Alzheimer’s Disease through the Retina: An Animal Study
255

The developed normative data for retinal thick-
ness, both layer-specific and total retina thickness, up
to the age of sixteen months old, is a considerable as-
set by demonstrating the thickness evolution of the
same animals and providing a comparative reference
to other studies.
Also, the consistent imaging and computing of
fundus images from the retina of WT and 3×Tg-AD
and the texture analysis of those allowed to detect
differences between groups since one-month-old and
raise novel scientific questions on their meaning.
In conclusion, these preliminary results from the
ongoing study demonstrate the massive differences
between the retinas of WT and 3×Tg-AD mice since
one-month-old, both from the thickness and texture
analysis viewpoints.
ACKNOWLEDGEMENTS
This study was supported by The Portuguese Foun-
dation for Science and Technology (FCT) through
PTDC/EMD-EMD/28039/2017, UIDB/04950/2020,
Pest-UID/NEU/04539/2019, and by FEDER-
COMPETE through POCI-01-0145-FEDER-028039.
The authors would like to acknowledge the contri-
bution of all team members in the study reported:
Jo
˜
ao Martins, Paula I. Moreira, Ant
´
onio Francisco
Ambr
´
osio and Miguel Castelo-Branco.
REFERENCES
Abadi, M., Barham, P., Chen, J., Chen, Z., Davis, A., Dean,
J., Devin, M., Ghemawat, S., Irving, G., Isard, M.,
Kudlur, M., Levenberg, J., Monga, R., Moore, S.,
Murray, D. G., Steiner, B., Tucker, P., Vasudevan,
V., Warden, P., Wicke, M., Yu, Y., and Zheng, X.
(2016). TensorFlow: A system for large-scale ma-
chine learning. In Proceedings of the 12th USENIX
Conference on Operating Systems Design and Imple-
mentation, OSDI’16, page 265–283, USA. USENIX
Association.
Ahmed, R. M., Paterson, R. W., Warren, J. D., Zetterberg,
H., O’Brien, J. T., Fox, N. C., Halliday, G. M., and
Schott, J. M. (2014). Biomarkers in dementia: clini-
cal utility and new directions. Journal of Neurology,
Neurosurgery & Psychiatry, 85(12):1426.
Alzheimer’s & Dementia (2020). 2020 Alzheimer’s dis-
ease facts and figures. Alzheimer’s & Dementia,
16(3):391–460.
Antony, B. J., Kim, B.-J., Lang, A., Carass, A., Prince,
J. L., and Zack, D. J. (2017). Automated segmen-
tation of mouse OCT volumes (ASiMOV): Validation
& clinical study of a light damage model. PLOS ONE,
12(8):e0181059.
Berger, A., Cavallero, S., Dominguez, E., Barbe, P., Si-
monutti, M., Sahel, J.-A., Sennlaub, F., Raoul, W.,
Paques, M., and Bemelmans, A.-P. (2014). Spectral-
domain optical coherence tomography of the rodent
eye: Highlighting layers of the outer retina using sig-
nal averaging and comparison with histology. PLoS
ONE, 9(5):e96494.
Chiu, K., Chan, T.-F., Wu, A., Leung, I. Y.-P., So, K.-F.,
and Chang, R. C.-C. (2012). Neurodegeneration of the
retina in mouse models of Alzheimer’s disease: what
can we learn from the retina? Age, 34(3):633–649.
Chiu, S. J., Li, X. T., Nicholas, P., Toth, C. A., Izatt,
J. A., and Farsiu, S. (2010). Automatic segmenta-
tion of seven retinal layers in SDOCT images congru-
ent with expert manual segmentation. Optics Express,
18(18):19413–19428.
Chollet, F. (2015). Keras.
Diakogiannis, F. I., Waldner, F., Caccetta, P., and Wu, C.
(2020). ResUNet-a: A deep learning framework for
semantic segmentation of remotely sensed data. IS-
PRS Journal of Photogrammetry and Remote Sensing,
162:94–114.
Dufour, P. A., Ceklic, L., Abdillahi, H., Schr
¨
oder, S.,
Dzanet, S. D., Wolf-Schnurrbusch, U., and Kowal,
J. (2013). Graph-based multi-surface segmentation
of OCT data using trained hard and soft constraints.
IEEE Transactions on Medical Imaging, 32(3):531–
543.
Fang, L., Cunefare, D., Wang, C., Guymer, R. H., Li,
S., and Farsiu, S. (2017). Automatic segmentation
of nine retinal layer boundaries in OCT images of
non-exudative AMD patients using deep learning and
graph search. Biomedical Optics Express, 8(5):2732.
Ferreira, H., Martins, J., Nunes, A., Moreira, P. I.,
Castelo-Branco, M., Ambr
´
osio, A. F., Serranho,
P., and Bernardes, R. (2020). Characterization of
the retinal changes of the 3×Tg-AD mouse model
of Alzheimer’s disease. Health and Technology,
10(4):875–883.
Guimar
˜
aes, P., Rodrigues, P., Lobo, C., Leal, S., Figueira,
J., Serranho, P., and Bernardes, R. (2014). Ocular fun-
dus reference images from optical coherence tomog-
raphy. Computerized Medical Imaging and Graphics,
38(5):381–389.
Habib, M., Mak, E., Gabel, S., Su, L., Williams, G.,
Waldman, A., Wells, K., Ritchie, K., Ritchie, C.,
and O’Brien, J. T. (2017). Functional neuroimag-
ing findings in healthy middle-aged adults at risk
of Alzheimer’s disease. Ageing Research Reviews,
36:88–104.
Haralick, R. M., Shanmugam, K., and Dinstein, I. (1973).
Textural features for image classification. IEEE
Transactions on Systems, Man, and Cybernetics,
SMC-3(6):610–621.
Hart, N. J., Koronyo, Y., Black, K. L., and Koronyo-
Hamaoui, M. (2016). Ocular indicators of
Alzheimer’s: exploring disease in the retina. Acta
Neuropathologica, 132(6):767–787.
He, K., Zhang, X., Ren, S., and Sun, J. (2016). Deep resid-
ual learning for image recognition. 2016 IEEE Con-
Imaging4OND 2022 - Special Session on New Developments in Imaging for Ocular and Neurodegenerative Disorders
256

ference on Computer Vision and Pattern Recognition
(CVPR), pages 770–778. HugoFerreira.
Ioffe, S. and Szegedy, C. (2015). Batch normalization:
Accelerating deep network training by reducing in-
ternal covariate shift. In Bach, F. and Blei, D., ed-
itors, Proceedings of the 32nd International Confer-
ence on Machine Learning, volume 37 of Proceedings
of Machine Learning Research, pages 448–456, Lille,
France. PMLR.
Jack, C. R., Knopman, D. S., Jagust, W. J., Shaw, L. M.,
Aisen, P. S., Weiner, M. W., Petersen, R. C., and
Trojanowski, J. Q. (2010). Hypothetical model of
dynamic biomarkers of the Alzheimer’s pathological
cascade. The Lancet. Neurology, 9(1):119–28.
Jha, D., Smedsrud, P. H., Riegler, M. A., Johansen, D.,
Lange, T. d., Halvorsen, P., and Johansen, H. D.
(2019). ResUNet++: An advanced architecture for
medical image segmentation. In Proceedings - 2019
IEEE International Symposium on Multimedia, ISM
2019, volume 00, pages 225–230. Institute of Electri-
cal and Electronics Engineers Inc.
Kingma, D. P. and Ba, J. (2015). Adam: A method for
stochastic optimization. In Bengio, Y. and LeCun,
Y., editors, 3rd International Conference on Learn-
ing Representations, ICLR 2015, San Diego, CA, USA,
May 7-9, 2015, Conference Track Proceedings.
Kitazawa, M., Medeiros, R., and LaFerla, F. M. (2012).
Transgenic mouse models of Alzheimer disease: De-
veloping a better model as a tool for therapeu-
tic interventions. Current Pharmaceutical Design,
18(8):1131–1147.
Koozekanani, D., Boyer, K., and Roberts, C. (2021). Reti-
nal thickness measurements from optical coherence
tomography using a Markov boundary model. IEEE
Transactions on Medical Imaging, 20(9):900–916.
Krantic, S. and Torriglia, A. (2014). Retina: source of the
earliest biomarkers for Alzheimer’s disease? Journal
of Alzheimer’s disease : JAD, 40(2):237–43.
London, A., Benhar, I., and Schwartz, M. (2013). The retina
as a window to the brain–from eye research to CNS
disorders. Nature Reviews Neurology, 9(1):44–53.
Morales, S., Colomer, A., Mossi, J. M., Amor, R. d., Wold-
bye, D., Klemp, K., Larsen, M., and Naranjo, V.
(2021). Retinal layer segmentation in rodent OCT im-
ages: Local intensity profiles & fully convolutional
neural networks. Computer Methods and Programs in
Biomedicine, 198:105788.
Morgia, C. L., Ross-Cisneros, F. N., Koronyo, Y., Hanni-
bal, J., Gallassi, R., Cantalupo, G., Sambati, L., Pan,
B. X., Tozer, K. R., Barboni, P., Provini, F., Avanzini,
P., Carbonelli, M., Pelosi, A., Chui, H., Liguori, R.,
Baruzzi, A., Koronyo-Hamaoui, M., Sadun, A. A.,
and Carelli, V. (2016). Melanopsin retinal ganglion
cell loss in Alzheimer disease. Annals of Neurology,
79(1):90–109.
Ngo, L., Cha, J., and Han, J.-H. (2020). Deep neural net-
work regression for automated retinal layer segmenta-
tion in optical coherence tomography images. IEEE
Transactions on Image Processing, 29:303–312.
Nunes, A., Silva, G., Duque, C., Janu
´
ario, C., Santana, I.,
Ambr
´
osio, A. F., Castelo-Branco, M., and Bernardes,
R. (2019). Retinal texture biomarkers may help to
discriminate between Alzheimer’s, Parkinson’s, and
healthy controls. PLOS ONE, 14(6):e0218826.
Oddo, S., Caccamo, A., Shepherd, J. D., Murphy, M.,
Golde, T. E., Kayed, R., Metherate, R., Mattson,
M. P., Akbari, Y., and LaFerla, F. M. (2003). Triple-
transgenic model of Alzheimer’s disease with plaques
and tangles intracellular aβ and synaptic dysfunction.
Neuron, 39(3):409–421.
Rathke, F., Schmidt, S., and Schn
¨
orr, C. (2014). Probabilis-
tic intra-retinal layer segmentation in 3-D OCT im-
ages using global shape regularization. Medical Image
Analysis, 18(5):781–794.
Ronneberger, O., Fischer, P., and Brox, T. (2015). U-
Net: Convolutional networks for biomedical image
segmentation. In Lecture Notes in Computer Science
(including subseries Lecture Notes in Artificial Intel-
ligence and Lecture Notes in Bioinformatics), volume
9351, pages 234–241. Springer Verlag.
Roy, A. G., Conjeti, S., Karri, S. P. K., Sheet, D., Katouzian,
A., Wachinger, C., and Navab, N. (2017). ReLayNet:
retinal layer and fluid segmentation of macular optical
coherence tomography using fully convolutional net-
works. Biomedical Optics Express, 8(8):3627.
Sarhan, M. H., Nasseri, M. A., Zapp, D., Maier, M.,
Lohmann, C. P., Navab, N., and Eslami, A. (2020).
Machine learning techniques for ophthalmic data pro-
cessing: A review. IEEE Journal of Biomedical and
Health Informatics, 24(12):3338–3350.
Sch
¨
on, C., Hoffmann, N. A., Ochs, S. M., Burgold, S.,
Filser, S., Steinbach, S., Seeliger, M. W., Arzberger,
T., Goedert, M., Kretzschmar, H. A., Schmidt, B., and
Herms, J. (2012). Long-term in vivo imaging of fib-
rillar tau in the retina of P301S transgenic mice. PLoS
ONE, 7(12):e53547.
Soh, L.-K. and Tsatsoulis, C. (1999). Texture analysis of
SAR sea ice imagery using gray level co-occurrence
matrices. IEEE Transactions on Geoscience and Re-
mote Sensing, 37(2):780–795.
Soukup, P., Maloca, P., Altmann, B., Festag, M., Atzpodien,
E.-A., and Pot, S. (2019). Interspecies variation of
outer retina and choriocapillaris imaged with optical
coherence tomography. Investigative Opthalmology &
Visual Science, 60(10):3332.
Srinivasan, P. P., Heflin, S. J., Izatt, J. A., Arshavsky, V. Y.,
and Farsiu, S. (2014). Automatic segmentation of
up to ten layer boundaries in SD-OCT images of the
mouse retina with and without missing layers due to
pathology. Biomedical Optics Express, 5(2):348.
Venhuizen, F. G., Ginneken, B. v., Liefers, B., Grinsven,
M. J. J. P. v., Fauser, S., Hoyng, C., Theelen, T., and
S
´
anchez, C. I. (2017). Robust total retina thickness
segmentation in optical coherence tomography images
using convolutional neural networks. Biomedical Op-
tics Express, 8(7):3292.
Yazdanpanah, A., Hamarneh, G., Smith, B. R., and Sarunic,
M. V. (2011). Segmentation of intra-retinal layers
from optical coherence tomography images using an
active contour approach. IEEE Transactions on Med-
ical Imaging, 30(2):484–496.
Shedding Light on Early Central Nervous System Changes for Alzheimer’s Disease through the Retina: An Animal Study
257

Zhang, Z., Liu, Q., and Wang, Y. (2018). Road extraction
by deep residual U-Net. IEEE Geoscience and Remote
Sensing Letters, 15(5):749–753.
Imaging4OND 2022 - Special Session on New Developments in Imaging for Ocular and Neurodegenerative Disorders
258
