
A Moodle Component for Data Visualization with Applied Learning
Analytics for Students
M. Barbachano-Chiu
a
, V. Menéndez-Domínguez
b
and L. Curi-Quintal
c
Universidad Autónoma de Yucatán, Mérida, Mexico
Keywords: Learning Analytics, Data Visualization, e-Learning, Moodle, Plugin, Component, Students.
Abstract: One of the main characteristics of e-learning platforms, such as Moodle, is the registration, monitoring, and
storage of the interaction of its users with the published resources, access, and times of entry and exit to them.
This information certainly occupies a lot of space and, since its analysis requires prior knowledge by teachers,
this information is often forgotten and even eliminated. For this, through Learning Analytics, whose main
objective is to apply an intelligent use to data produced by students to predict, evaluate and optimize their
learning, we have proposed the development of a Moodle component that allows, with the help of data
visualization, to present different results obtained through different learning analytics techniques to evaluate
the academic performance of a student or a group enrolled in a course through parameterization, visual and
quantitative support by the tool.
1 INTRODUCTION
In recent years there has been an increasing interest in
educational data analytics, which is not a new area of
research as in previous years it has been referred to as
learning analytics (LA). Learning analytics has been
described as an emerging field where sophisticated
analytical tools are used to improve learning and
education (Koedinger et al., 2010), especially in
learning management systems (Menéndez and
Castellanos, 2014).
These tools provide increasingly large amounts of
data, which can be analysed to easily address
questions that were previously not feasible, involving
the identification of differences between groups of
students or unusual student behaviours (Romero,
Ventura, Pechenizkiy and Baker, 2012). Importantly,
the use of this information and analytical modelling
allows the prediction of student progress and
performance, and the ability to act on that
information.
Specifically, there are four categories of learning
analytics (Romero and Ventura, 2020):
Descriptive (What happened?)
Predictive (What happens next?)
a
https://orcid.org/0000-0002-2712-579X
b
https://orcid.org/0000-0003-3587-1263
c
https://orcid.org/0000-0002-8184-9473
Diagnostic (Why did it happen?)
Prescriptive (Do this to improve)
These will be detailed through the following
proposal, where we sought to cover each of these
categories given the vast amount of information that
Moodle stores as well as the need of teachers for tools
that offer them support to support their courses and
their students’ learning.
This paper presents a proposal for the analysis
of the data stored in the logs generated by the Moodle
platform. The educator through a Moodle component
(plugin) of block type developed in PHP will be able
to observe, through the visualization of data, the
information collected corresponding to the
interaction time of the students with a resource within
a Moodle course.
The teacher will be able to visualise the time
spent by his or her group or specific students on the
course or expected resource through quantitative data
and graphs that visually demonstrate the relationship
that the students have had with the resources (What
happened?), as well as visualising through a line
graph the time spent by each student per day on the
course, thus determining patterns according to the
days (What happens next?).
Barbachano-Chiu, M., Menéndez-Domínguez, V. and Curi-Quintal, L.
A Moodle Component for Data Visualization with Applied Learning Analytics for Students.
DOI: 10.5220/0011125500003182
In Proceedings of the 14th International Conference on Computer Supported Education (CSEDU 2022) - Volume 1, pages 533-542
ISBN: 978-989-758-562-3; ISSN: 2184-5026
Copyright
c
2022 by SCITEPRESS – Science and Technology Publications, Lda. All rights reserved
533

Also across the graphics of plugin is possible
observing multiple reasons why some students get
better grades or which resources are preferred by
students (Why did this happen?), and of course, it is
considered important to offer some dynamicity to the
teacher to introduce a limit parameter according to the
number of accesses and average time so that the
plugin shows which students are above or below the
limit, showing in green those who exceed it and in red
those who do not, thus discovering who to offer more
support and even which resources (Do this to
improve).
This is how, through this proposal, it will be
possible to identify patterns that students follow,
allowing the progress of the group to be monitored.
Section 2 includes a review of similar works and
the most important concepts. Section 3 presents an
overview of the proposed plugin in terms of its
architecture and functionalities. Section 4 showed a
case study applying the plugin in a Moodle Course.
Finally, Section 5 mentions its importance and future
work.
2 PATTERN IDENTIFICATION
PLUGIN FOR THE MOODLE
PLATFORM
Moodle plays the role of a platform that integrates the
different possibilities offered by the network, with a
view to its use in education. Because it is a free
software tool that feeds back on the work done by
multiple institutions and participants collaborating in
a network, educators have the possibility of freely
accessing and incorporating into their subjects
multiple modules or components created by other
users through elements called plugins of various types
(Moodle, 2022). The main ones are described in
Table 1. There are currently 1653 plugins that have
been developed by 929 developers and grouped into
47 categories (Moodle, 2022).
Moodle enables non-classroom learning for
students, facilitating virtuality, and is considered an
e-learning tool (Iker, 2008). The e-learning concept
has a pedagogical and technological duality, the first
refers to the fact that these systems should not be mere
containers of digital information, but that this
information should be transmitted following
pedagogically defined models and patterns to meet
the challenges of these new contexts. The second,
technological, refers to the fact that the entire
teaching and learning process is based on software
applications, mainly developed in Web environments
(García, 2005).
Table 1: Main Moodle components.
Type Description
Activity
An activity is something that a
student will do that interacts with
other students and/or the teacher.
Block
Blocks are elements that can be
added to the left or right column or in
the centre of any page in Moodle.
Registration
These modules are used to augment
ways of handling user registrations.
Authentication
The authentication process in Moodle
is initiated when a user clicks the
Login link in the UI or if they attempt
to access a protected page.
Repository
The repository plugin allows Moodle
to pull in content from external
repositories.
Filters
Filters are a way to automatically
transform content before it is
displayed.
Given the above, the possibility of using
technology with a focus on assessment and the use of
tools such as learning analytics will allow teachers to
have a better understanding of students' online
interactions. With the use of technology, tracking
learners from any device accessing a course, as well
as course resources, will allow for the collection of
information necessary for the presentation of results.
The use of the Moodle platform allows users to add a
plugin as required in a controlled environment.
Nowadays multiple plugins offer among their
features the ability to provide the time a user has spent
on a course, obtain the number of times a user has
visited a resource, track the whole group based on
their times and even qualitative summaries of the
actions performed by the students; some of the
plugins with these features are "Moodle Course
Dedication" (CICEI ULPGC, 2020), "Use Stats"
(Fremaux, 2018) and GISMO (Mazza and Milani,
2004).
To convert data from an e-learning system such
as Moodle into useful information for making
decisions and answering questions in an educational
context, a process called educational data mining is
presented. This data analysis presents a challenge in
devising how to effectively mine these large amounts
of information, looking for meaningful patterns and
presenting them to teachers and students in a useful
way (Kay, Koprinska and Yacef, 2010).
A2E 2022 - Special Session on Analytics in Educational Environments
534

As we encounter the term "learning analytics", we
also encounter the term "data mining", whose
application in e-learning systems consists of an
iterative cycle in which knowledge enters a loop of
the system, and in this way will guide, facilitate, and
improve learning, not only by converting data into
knowledge but also by filtering mined knowledge for
decision making. Data mining in e-learning
environments consists of 4 steps: collecting data, pre-
processing data, applying data mining, and finally
interpreting, evaluating and displaying the results
(Romero, Ventura and García, 2008).
Learning analytics has similarities with data
mining (Baek and Doleck, 2020) of course, also
differences but specifically the process to follow is
similar (Figure 1). Regarding the previous process,
data collection consists of obtaining information on
the use that users make of the e-learning platform, in
our case Moodle; then we proceed to pre-process the
data with the aim of cleaning and transforming this
information into a format that allows it to be analysed
and synthesised. The purpose of this process is to
observe the derived result that gives meaning to the
knowledge of interest to the user and allows to obtain
results that can be presented to them attractively and
understandably, allowing decision making in search
of learning improvement.
Figure 1: General process of learning analytics.
However, just as we find similarities, it is possible to
identify five key distinctions between data mining
and learning analytics (Calvet and Pérz, 2015). These
are:
Discovery: In data mining (DM) researchers are
interested in automated discovery, and human
judgement is a tool for this; in learning analytics
(LA) it is the opposite, harnessing human
judgement is the goal.
Reduction and holism: DM reduces systems to
components and explores them and their
relationships, while LA seeks to understand
whole systems.
Origins: LA seeks intelligent curricula and
outcome prediction, while DM would rely on
educational software and student modelling.
Adaptation and customisation: DM performs
automated adaptation, while LA informs and
trains instructors and students.
Techniques and methods: DM employs
techniques and methods of classification,
clustering, relationship mining, while LA focuses
on an analysis of learner success, concepts,
models of meaning, among many others.
In this sense, graphs provide an excellent approach to
exploring information, as well as being essential for
presenting results. On the other hand, developments
in computer graphics have managed to provide great
benefits such as increased quality and accuracy when
making these graphs. That said, data visualization is
defined as a relatively new term, as it expresses an
idea of involving more than just the representation of
data in graphical form, but that information should be
revealed satisfactorily, concerning quality and
different types of information (Chen, Hardle and
Unwin, 2008).
In the last couple of years, students have started
using Internet to study and due to the easy availability
of online courses, student online activities have
considerably increased which in turn has generated
huge amount of data (Roy and Narayan, 2017).
And given that today, there is no solid theoretical
framework for the application of learning analytics in
learning managers, the term adaptive learning
emerges as a result of joint work between educators,
designers and programmers (Daniel, Cano and
Cervera, 2015).
This is why we propose the application of the term
"learning analytics" in an automatic way through a
plugin adapted to Moodle, which allows educators to
make decisions based on the data collected by the e-
learning system regarding the interaction of students
with the platform and presented in an easy-to-
interpret interface so that the teacher can apply
adaptive learning according to their group and
students.
3 PROPOSAL
The proposal focuses on the development of a
Moodle plugin (Version 3.6.6) open source, which
allows the collection, preparation and transformation
of data, as well as their analysis through an automatic
and intuitive process to obtain results that help
educators to understand the usage patterns of their
students, based on their interaction with the course
resources. This leads to the presentation of graphs that
A Moodle Component for Data Visualization with Applied Learning Analytics for Students
535

show the patterns that users follow in a session,
generated from the data obtained from the interaction
with the various resources proposed by the educator.
Another feature of this tool arises since each
teacher has different parameters for grading,
observing progress and/or interpreting results
according to the subject taught, this Moodle plugin
seeks to offer the ability to distinguish students based
on different parameters such as time and number of
accesses to the course. Given that the teacher can
indicate a point of separation for the tool to
distinguish students, the tool also offers quantitative
and visual characteristics to decide on this
differentiating parameter and its value.
3.1 Development Methodology
To develop the plugin, an incremental software
development process based on SCRUM (Schwaber
and Sutherland, 2011) was carried out through the
following stages:
Backlog: The requirements (functionalities) to be
possessed by the component, the results to be
obtained and how they are deployed to users are
defined.
First Sprint Backlog: The requirements for the
first sprint of 2 weeks are assigned, then we
continue with the first sprint where we define the
architecture necessary to develop a plugin
according to the Moodle specifications (Moodle,
2022) and it is observed that the one that
corresponds most is the "Block", as well as the
use of the Moodle API "Data Manipulation API".
Second Sprint BackLog: The beginning of the
development is defined to generate the necessary
files for the proper functioning of the component.
Third Sprint Backlog: The start of the tests is
determined, as well as the determination of the
validity of the data obtained by the component,
concerning a course and compared with the
results of the calculations obtained manually.
Finally, the loading of the resulting component
on the server of the Faculty of Mathematics of
the Autonomous University of Yucatan,
specifically in the course called "Human-
Computer Interaction (Group B)" - 2019 of the
Bachelor's Degree in Software Engineering with
a group of 28 students.
3.2 Initial Learning Analytics
A few years ago, Gašević, Dawson and Rogers
(Gašević, Dawson and Rogers, 2016) defined which
variables, concerning the characteristics of the
Moodle learning management system, can provide
representative numbers in tools such as quizzes,
feedback, lessons and chats. They considered other
elements such as forums, course logins, resources and
assignments that can simply be used to measure
"login" or "non-login".
Our proposal takes into consideration the time that
users spend on the resources as an essential element
for the analysis of the information, to observe patterns
that allow us to relate students' grades to the time
spent on the resources and activities. The aim is also
to observe which interaction sequences lead to an
improvement in learning in the course, whether team
members spend the same amount of time on a
resource, among many other elements. In the end, it
is observed whether there is a correlation between the
amount of time spent on a course or resource and the
final performance of a student (Kadoic and Oreski,
2018).
Another advantage of the characteristics of the
environment where the plugin will be executed is to
create an interface that allows different educators
(from different areas) the ability to interact with it,
without requiring prior knowledge of the
development of the plugin. So far, the component
allows to know 6 different metrics per group and
student for the analysis of information and
presentation of results:
The average time of the group enrolled in a
course taking as a time element, from the time a
learner enters the course on the platform until
he/she leaves the course to enter a different
course or logout.
The average time of the group enrolled in a
course taking as a time element the sum of the
time intervals per day considering from the time
the learner joined the course and logged out or
joined a different course.
The average time of resource use by the group.
The average time of the group's use of the
resource by taking as a time element the sum of
the group's intervals on that resource per day.
The average time of a pupil's use of the resource
by taking as a time element the sum of the pupil's
intervals on that resource per day.
The average time per day spent by learners on the
course taking as an element of time from entering
the course to leaving the course or logging out.
Results obtained allow educators to predict a
possible path between the different resources used by
students, as well as the progress of each student
regarding the assignment of a project or the feedback
of a test or quiz (Trcka, Pechenizkiy and Aalst, 2010).
A2E 2022 - Special Session on Analytics in Educational Environments
536
This plugin facilitates the task of educators in
analysing large volumes of information through
learning analytics and enables improved decision
making. By automating this time-consuming and
complicated process, it avoids the possibility of
complex results that can lead to misunderstandings
and incomplete understandings.
Moreover, since data visualization facilitates the
correct interpretation of results and the goal of
learning analytics is to provide clear information to
teachers given the patterns found in the data, both can
work together to provide visualizations to represent
complex quantitative data for teachers to interpret in
various graphs to support improved student learning
and adaptive learning processes for students.
3.3 Component Architecture
Software Architecture is a high-level representation
of the structure of a system or application that
describes the parts that comprise it, the interactions
between them, the patterns that supervise its
composition and the restrictions when applying these
patterns (Pressman, 2006). In general, such a
representation is in terms of a collection of
components and the interactions that take place
between them.
The implemented architecture is called Model-
View-Controller (MVC) (Leff and Rayfield, 2001),
which contemplates a three-layer structure,
separating interface, behaviour and data. This
simplifies the implementation and enables the
reusability of the developed components. In the
architecture, each layer is made up of a collection of
components, which, when executed individually or
together, enable the required processes to be
performed.
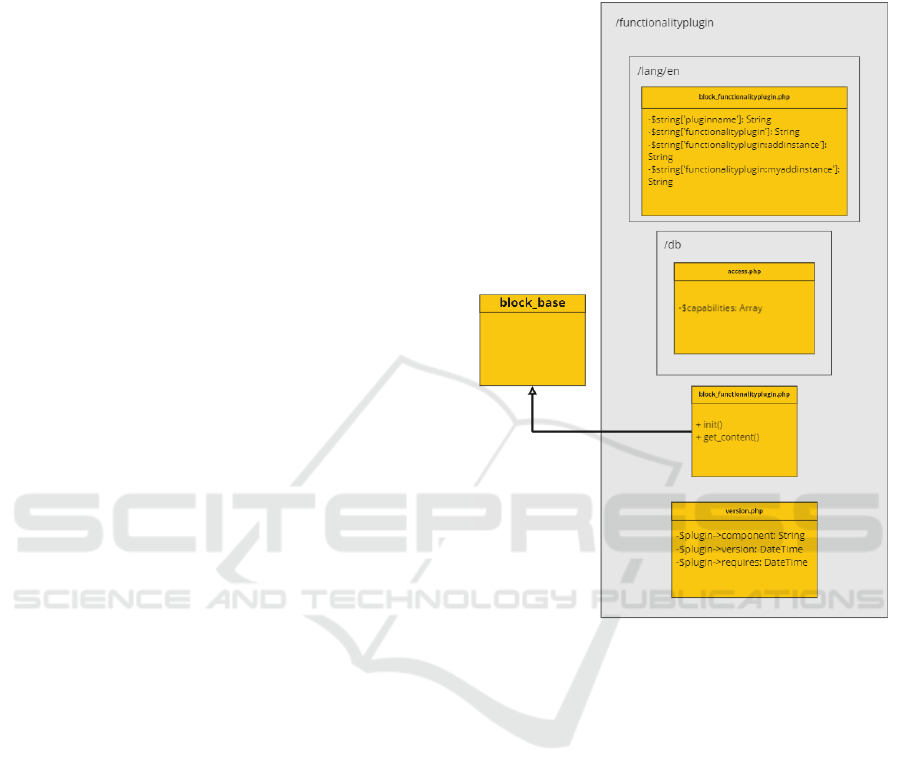
This architecture is limited to the API provided by
Moodle for the development of new block plugins, as
presented in the following Figure 2:
As mentioned above, it was decided to develop a
block plugin because of some crucial points, such as:
The result set must be always at the teacher’s
fingertips.
The plugin is required to display course
information, so its position is of utmost
importance to relate the information displayed by
Moodle (resources) to the information calculated
by the plugin.
The plugin should be easily accessible to avoid
inconvenience or require specialised knowledge
to access it.
When the user interacts with one of the views, the
controller detects the change and requests the data
from one of the already defined models provided by
Moodle through its Data Manipulation API, which
were abstracted and manipulated to return results
relevant to this plugin.
Figure 2: Class diagrams of a Block type plugin.
3.4 Component Architecture
Developing a Web application implies an appropriate
selection of standard technologies that are freely
distributable and independent of any execution
platform, which guarantees its portability,
availability, compatibility and efficiency (Pressman,
2006).
The main development technologies involved in
the plugin are listed below. For each of them, brief
information on their role is given (Wandschneider,
2006):
HTML (HyperText Markup Language) for the
creation of the Web pages that make up the
visible interface of the component.
CSS (Cascade Style Sheets) for defining the
presentation of a Web page in terms of a specific
format and typography. CSS files are referred to
as style sheets.
A Moodle Component for Data Visualization with Applied Learning Analytics for Students
537

JavaScript, to dynamically manipulate the
different elements of the interface, allowing new
interaction styles such as AJAX.
PHP, for the development of software
components, functions and libraries. It is the core
language of the Moodle platform.
SQL language to manipulate the information in
the Moodle database.
For data visualization, the D3.js library (D3.js,
2020) is used, which allows easy and competent
development of the graphics needed to present the
data using HTML, SVG and CSS. D3.js is a
JavaScript code library for manipulating data-driven
documents, combining powerful visualization
components and a data-driven approach to DOM
(Document Object Model) manipulation.
Another library used for data visualization;
specifically graph generation (Nodes and Edges) is
called Vis.js Community Edition, which is called a
dynamic visualization library for browsers, designed
to be easy to develop, to handle large amounts of
dynamic data and to enable manipulation of and
interaction with the data (Vis.js, 2021). This library
consists of multiple components such as Network,
Timeline, Graph3d, Graph2d and DataSet, however,
the one used in this case is "Network" which allows
displaying dynamic graphs, automatically organized
and customizable.
3.5 Access to the Moodle Log
The plugin interacts with the Moodle database
through the Data Manipulation API using information
from the user enrolments, user, enrol,
logstore_standard_log and course tables (Table 2).
The Data Manipulation API has all the functions
required to access the Moodle database. It is
recommended that these functions are only used for
retrieving or modifying database content, as they
provide a high level of abstraction and ensure that
database manipulation will work with different
database management systems while maintaining
component compatibility for future Moodle upgrades.
Given a large amount of information obtained
from the Moodle database and the processing time to
obtain the metrics as well as the graphs presented, it
has been decided to automatically store certain results
in the browser's LocalStorage, this is a storage space
that allows saving small amounts of data in the
browser (Mozilla, 2020) in this case of the teacher, to
display immediate results (if previously entered).
Table 2: Moodle tables used.
Table Description
user
This table stores student profile
information and in particular the
student's unique identifier.
course
This table stores information
about the course(s), to which the
student belongs, as well as a
unique identifier.
enrol
It has the course identifier,
together with course information
regarding when the course was
registered and when it ends.
logstore_standard_log
Stores all the movements made
by the student on the platform,
together with their respective
date and time.
user_enrolments
This table stores when a user
registers for a course and their
course membership.
3.6 Component Interface
The web application is the visible interface of our
Moodle plugin. In its design, we considered topics of
Information Architecture (Morville, 2003): the
distribution of textual content, the number of graphic
elements, the presence of descriptive menus, the use
of links, among others, as well as the
recommendations and specifications provided by
Moodle (Moodle, 2022). The purpose is to create a
functional and aesthetic system in terms of the user
interface.
Based on the establishment of the objectives and
needs of potential users, profiles that group common
needs, experiences and attributes are characterised.
This allows the definition of archetypes (Hassan,
Iazza and Fernández, 2004) and action scenarios that
contextualise a usage situation. As a result, prototypes
are developed and validated through heuristics and
tests with real users to accept useful proposals.
Finally, the system is implemented for use and
maintenance.
This allows structuring the whole package with
visual consistency and fosters a sense of stability
within the application, making it easier for novice
users to navigate and explore, speeding up the
execution of tasks.
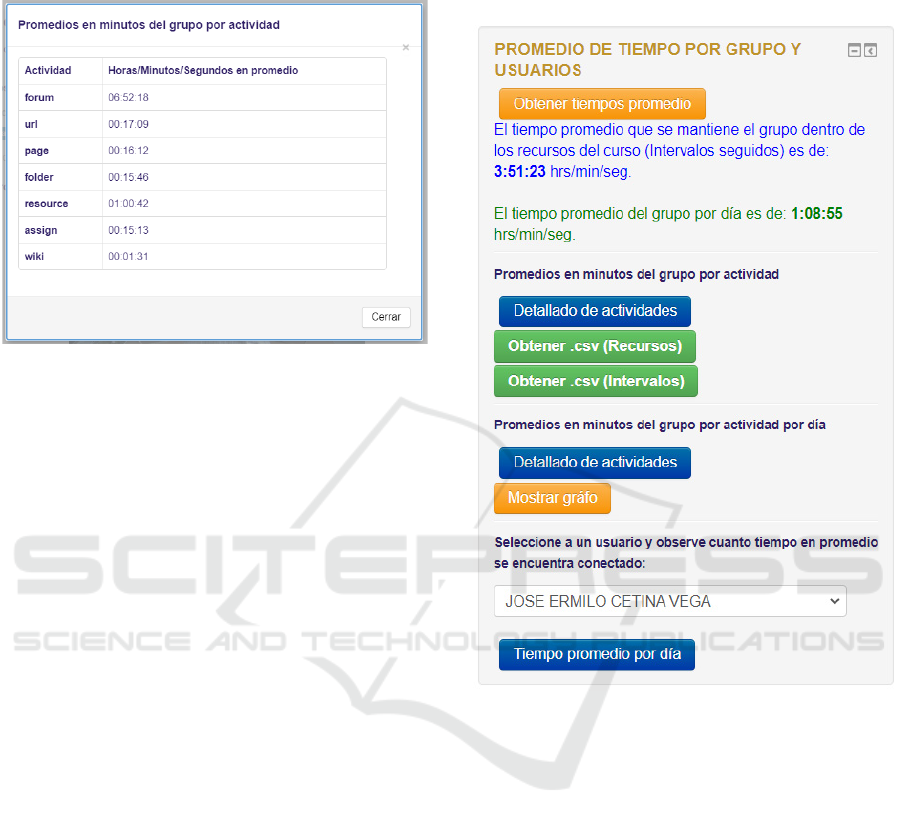
The contents and descriptions have been
structured for easy reading and understanding (Figure
3). The images used have been limited both in
quantity and variety. The resolution and size were
chosen to allow for a reduction in the waiting time for
A2E 2022 - Special Session on Analytics in Educational Environments
538
downloading the page without detracting from its
significance.
Figure 3: Average time of group per resource.
Regarding the proposed plugin, this is a type of
component called by Moodle as a "block", which
allows it to be added by the teachers of a course
statically, on the left or right side of where the
resources of the course are presented. This plugin
must be configured within the Moodle administration
panel to be viewed only by teachers, preventing
students from accessing confidential information of
their fellow students.
The plugin acts as an intermediary between the
complex processing of the vast amount of data in the
system and the user (teacher) in need of quantitative
and qualitative data to support decision making.
Because of this, the plugin has been composed of
several views that allow a simple and easy
visualization for the user.
Starting from the main interface, where general
information of the group is displayed such as:
The average time the group is kept within the
group's resources.
The average time of the group per day.
Download of .csv files with the time intervals
of the users per day and course resource.
In this interface (Figure 3), we can observe other
functionalities that we will detail below.
The two "activity detail" buttons show the
following interface, in which we find the average
times of the group per activity (considering as unit of
time since the student enters a resource until he leaves
one and switches to another) and with the other button
the average times of the group per activity per day (in
this one we consider as a unit of time the sum of all
time that a student entered a resource per day), in
these interfaces you can see which are the activities
or resources where the students have spent the most
time (forums, URLs, pages, folders, resources,
wikis).
Figure 4: Main interface.
At this point, we have observed how the tool
through quantitative data shows us information about
the behaviour of the group concerning the resources,
however, taking advantage of the use of data
visualization and the vast amount of information that
Moodle collects, we have been able to develop a
relationship graph, whose objective is to relate the
resources concerning the users of the course,
observing the amount of time spent on each resource
per student.
We can observe in this same interface the filtering
functionality for students, where the teacher places
the minimum value to separate the students in the
network (in red when they are below the minimum
value and in green when it is equal or greater than the
value placed), this can be according to the average
time dedicated to the course or the number of accesses
to it (Figure 4).
A Moodle Component for Data Visualization with Applied Learning Analytics for Students
539
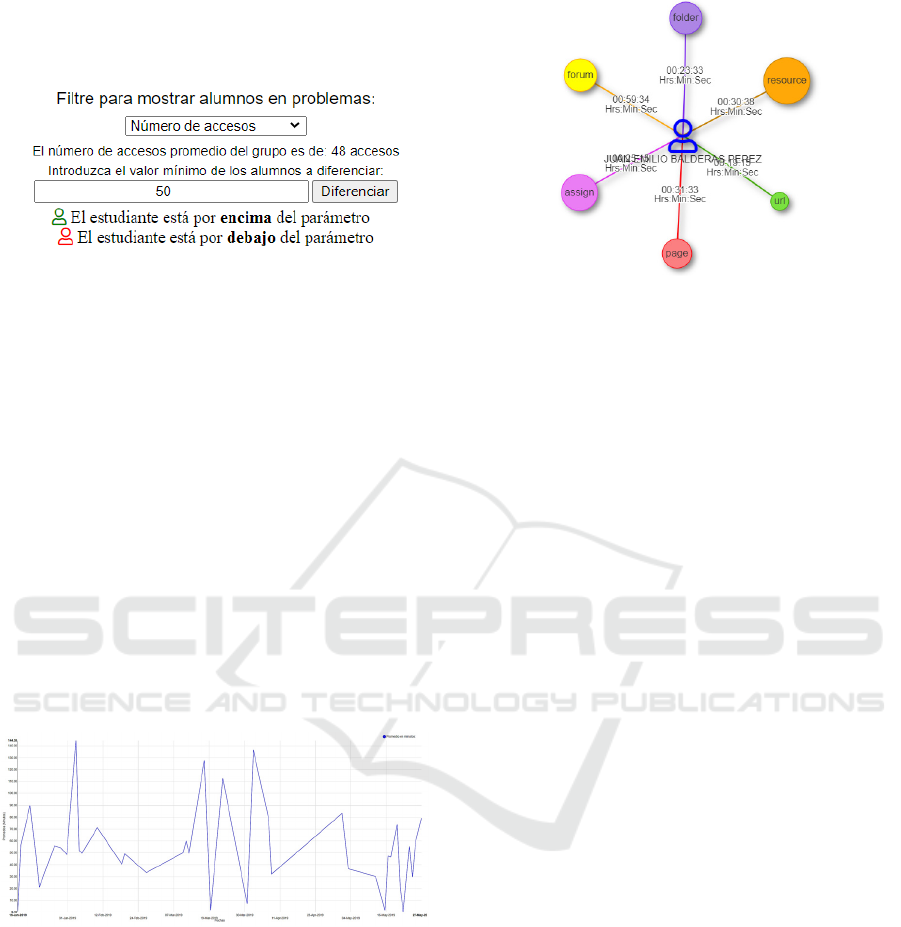
The tool aims to make this task even easier for the
teacher by providing the average time and number of
accesses of the group to have a reference point.
Figure 5: Student filtering functionality by minimum value.
Finally, in the main interface, we find the
"Average time per day" button where we can select a
student from the group to obtain the average time of
the selected student per activity per day as well as the
average time concerning the course (Figure 3).
Since this information is only quantitative and its
interpretation can be complicated, two graphs have
been proposed to allow a better visualization:
Starting from the main interface, where general
information of the group is displayed such as:
The first is a line graph, where the time in
minutes that the user dedicated per date to the
course is observed (Figure 6)
The second is the same relationship graph
(Figure 7), however, in this case, the main node
is the student, and the surrounding nodes are
the resources, observing their relationship and
time spent with each one of them.
Figure 6: Line chart with average times per date of a
selected.
As we have seen, all the interfaces present a
similar and intuitive design to guide the user through
the interface, allowing them to observe results
without the complex task of understanding and
analysing the vast amount of data that Moodle stores
in its various databases tables.
Figure 7: Graph of student-resource relationships.
4 CASE STUDY
The software evaluation process considers two types
of assessments to ensure the quality of a product:
verification and validation (Pressman, 2006).
While verification is aimed at verifying that the
product has been developed correctly, validation
evaluates the developed product against the stated
needs, i.e., whether the correct product has been built
according to the initial objectives.
This case study focuses on the validation of the
component, its main objective being to check that the
proposed plugin is consistent with the objectives for
which it has been developed.
First, the plugin was incorporated into the Moodle
course called "Human-Computer Interaction (Group
B)" of the bachelor’s degree in Software Engineering
offered by the Faculty of Mathematics of the
Autonomous University of Yucatan in 2019. The
number of students enrolled was 28.
The programmed functionalities were validated to
ensure that they were available and did not generate
errors or affect the performance of the Moodle
platform. Subsequently, learning analytics were
generated for the group and some students for testing.
Some examples of the results obtained are presented
below.
The graph is obtained by the following
mathematical expression:
𝑎
𝑏
(1
)
Where:
a = Time of entry to an external resource of the
course.
b = Time of entry to a resource in the course.
n = Number of time slots per pupil per day F.
i = ith student time slot of day F.
A2E 2022 - Special Session on Analytics in Educational Environments
540
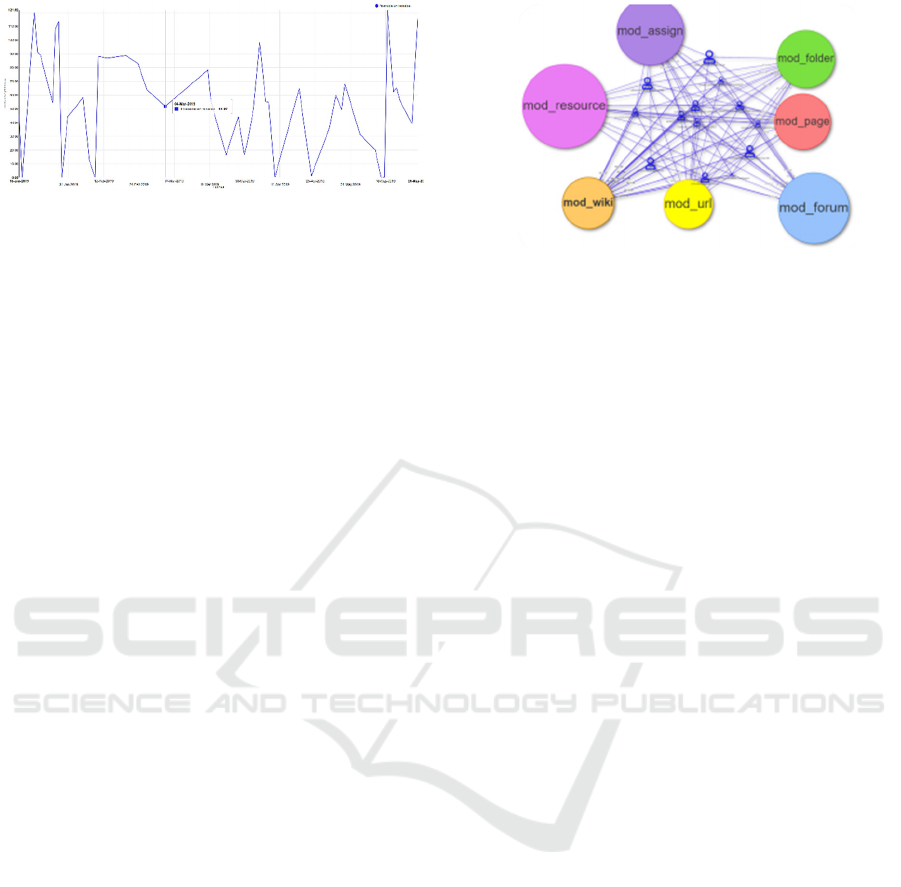
Figure 8: Graph of results generated by a pupil’s
component.
In this graph (Figure 8) we can see on the y-axis
(vertical) the average amount of time a student spends
in the course per day, where on the x-axis (horizontal)
we observe the days on which he/she entered, this is
obtained through the sum of the times per resource
occupied by the students per day (mathematical
expression mentioned above). With this, we can see
on which dates the students spend more time in the
course than on other days.
All this allows us to verify that the proposed
component fulfils its initial purpose, pending the
validation of its usability in an experiment involving
potential users.
5 CONCLUSIONS
Learning analytics can be transparently applied in e-
learning systems by using components to reduce the
need for prior or advanced knowledge. A benefit is
obtained by processing the large amounts of
information that are stored in these platforms, thus
allowing the automation of the process necessary to
analyse the information and present the results
obtained (Romero et al., 2008).
Likewise, these results can be represented by
graphs to identify and observe patterns based on the
progress of the students to determine the results of
one concerning the group, as well as the improvement
of the course through the adaptation of new resources
that improve learning.
Results represented by the graphs provide
teachers with information about the time their
students spend interacting with the resources
previously described, allowing them to know the
behaviour of the group within a Moodle course. With
this, it is possible to continuously monitor the
progress that a student can present over the other
members of the group (Figure 9).
Figure 9: Graph of the students in a course concerning the
used resources.
The plugin provides results that favour the
planning of new strategies, which can support the
high demand for digital activities, to improve student
learning.
In addition to providing useful information for the
teacher, this last network of relationships allows the
introduction of 2 types of parameters to filter the
students:
Filter by average time
Filter by number of accesses
With this, it is possible to distinguish those
students who are below average or above a specific
parameter, to be able to offer adaptive learning to
their profile.
The COVID-19 pandemic has encouraged
computer-based activities that reduce people's
presence and education is no exception; distance
education in all its aspects and variations is an
important alternative to maintain a healthy distance.
In this sense, learning management systems become
online spaces where all activity performed by the
learner is evidenced.
As previously mentioned, our proposal extends
Moodle as a tool that offers value to the learning
process, incorporating new functionalities that enable
an easy and interactive understanding of the results
obtained.
By implementing the architecture of a Moodle
plugin, the use of the plugin in different versions of
the platform is made possible, even favouring the
speed of the plugin in terms of its operation. This
means that its use by teachers requires downloading
and adding it to Moodle through the administrator
who manages the platform in their school.
It is worth mentioning that one aspect to improve
is to establish the time that a student is connected in
Moodle, as in some cases the user does not explicitly
log out but closes the browser window directly and
this generates wrong values.
A Moodle Component for Data Visualization with Applied Learning Analytics for Students
541

In addition, in the latest updates, Moodle has
launched a new feature, called Learning Analytics
API, which acts as an open system with a wide variety
of models and indicators like predictors, goals and
intuitions.
The aim is to incorporate these options from the
information stored in the Moodle log and to explore
new visualization techniques and their application to
student groups to evaluate the effectiveness of the
proposal in terms of usability.
ACKNOWLEDGEMENTS
To the Autonomous University of Yucatan for
facilitating the completion of this work.
REFERENCES
Baek, C., Doleck, T. (2020). Educational Data Mining
versus Learning Analytics: A Review of Publications
From 2015 to 2019.
Calvet L., Pérez, A. (2015). Educational Data Mining and
Learning Analytics: differences, similarities, and time
evolution, RUSC. Univ. Knowl. Soc. J.
Chen, C., Härdle, W., Unwin, A. (2008). Handbook of Data
Visualization, 2008 ed. Springer.
CICEI ULPGC. (2022). Blocks: Course dedication.
[Online]. Available:
https://moodle.org/plugins/block_dedication.
D3. (2021). D3.js. [Online]. Available: d3js.org. [Accessed:
05-Jun-2020].
Daniel, J., Cano, E., Cervera, G. (2015). The Future of
MOOCs: Adaptive Learning or Business Model?,
RUSC Universities and Knowledge Society Journal,
12(1), 64–73.
Docs, M. W. Window.localStorage. (2020). Available:
https://developer.mozilla.org/es/docs/Web/API/Windo
w/localStorage. [Accessed: 20-March-2020]
Fremaux, V. (2022). Blocks: Use State. [Online].
Available: https://moodle.org/plugins/block_use_stats.
García, F. (2005). Estado actual de los sistemas e-learning,
Teoría la Educ. Educ. y Cult. en la Soc. la Inf. ISSN
1138-9737, No. 6, 2, (Ejemplar Dedic. a Estado actual
los Sist. e-learning), vol. 6.
Gašević, D., Dawson, S., Rogers, T., Gasevic, D. (2016).
Learning analytics should not promote one size fits all:
The effects of instructional conditions in predicting
academic success, Internet High. Educ.
Hassan, Y., Iazza, G., Martín, F. (2004). Diseño Web
Centrado en el Usuario: Usabilidad y Arquitectura de la
Información, Hipertext.net.
Iker, R. (2008). Moodle, la plataforma para la enseñanza y
la organización escolar, IKASTORRATZA. e-Revista
de Didáctica, pp. 1–12.
Kadoic, N., Oreski, D. (2018). Analysis of student behavior
and success based on logs in Moodle, in 2018 41st
International Convention on Information and
Communication Technology, Electronics and
Microelectronics, MIPRO 2018 – Proceedings.
Kay, J., Koprinska, I., Yacef, K. (2010). Educational data
mining to support group work in software development
projects, Handbook of Educational Data Mining,
Chapman & Hall/CRC.
Koedinger, K., Baker, R.,Cunningham, K., Skogsholm, A.,
Leber, B., Stamper, J. (2010). A data repository for the
EDM community: The PSLC datashop, Handbook of
Educational Data Mining, Chapman & Hall/CRC.
Leff, A., Rayfield, J. (2001). Web-application development
using the Model/View/Controller design pattern, in
Proceedings - 5th IEEE International Enterprise
Distributed Object Computing Conference.
Mazza, R., Milani, C. (2004). GISMO: a Graphical
Interactive Student Monitoring Tool for Course
Management Systems, TEL’04 Technology Enhanced
Learning ’04 International Conference.
Menéndez, V., Castellanos, M. (2014). La calidad en los
Sistemas de Gestión del Aprendizaje, Abstr. Appl.
Mag., vol. 4.
Moodle. (2022). Moodle Dev. [Online]. Available:
https://docs.moodle.org/dev/Main_Page. [Accessed:
15-March-2022].
Moodle. (2022). Moodle Plugins. [Online]. Available:
https://moodle.org/plugins.
Morville, P. (2003). Information Architecture for the World
Wide Web, vol. 40, no. 06.
Pressman, R. (2006). Ingeniería del Software - Un enfoque
práctico, Sexta Edición.
Romero C., Ventura, S., García, E. (2008) Data mining in
course management systems: Moodle case study and
tutorial, Comput. Educ.
Romero, C., Ventura, S. (2020). Educational Data Mining
and Learning Analytics: An Updated Survey
Romero, C., Ventura, S., Pechenizkiy, M., Baker, R. (2010)
Handbook of educational data mining.
Roy, S., Narayan, S. (2017). Emerging trends in
applications of big data in Educational data mining and
learning analytics, Confluence.
Schwaber, K., Sutherland, J. (2011). The Scrum Guide -
The Definitive Guide to Scrum: The Rules of the Game,
Scrum. org.
Trcka, N., Pechenizkiy, M., Aalst, W. (2010). Chapter 9:
Process Mining from Educational Data, in Handbook of
Educational Data Mining, pp. 123–142.
Visjs.org. Vis.js Network. (2021). https://visjs.github.
io/vis-network/docs/network/. [Accessed: 01/03/2021]
Wandschneider, M. (2006). Core Web Application
Development with PHP and MySQL, Prentice-Hall
Professional Technical Reference.
A2E 2022 - Special Session on Analytics in Educational Environments
542
