
Sustainability and Goal Fitness Index for the Analysis of Sustainable
Development Goals: A Methodological Proposal
Sanny González
1a
, Gabriel Pereira
1,2,3 b
and Arturo González
1c
1
Universidad Nacional de Asunción, Facultad Politécnica, Grupo de Investigación en Sistemas Energéticos
(FPUNA-GISE), San Lorenzo, Paraguay
2
Transición Energética y Desarrollo Sostenible (TrEnDS), Asunción, Paraguay
3
Universidad Americana, Facultad de Ciencias Económicas y Administrativas, Lab-iDi, Asunción, Paraguay
Keywords: Sustainable Development Goals (SDGs), Economic Fitness, Complexity, Sustainability Fitness Index (SFI),
Goal Fitness Index (GFI), Goal Achievement Capability (GAC), Sustainability.
Abstract: The Sustainable Development Goals (SDGs) were adopted in September 2015 by the 193 member states of
the United Nations (UN), which include 17 goals, 169 targets and 244 indicators, as an attempt to radically
change the approach of the Sustainable Development Goals. Millennium Development (MDG). Since the
adoption of the 2030 Agenda, the scientific community has increased its interest in the evaluation, analysis,
and evaluation of the interrelationships between the SDGs, proposing different approaches and using a
diversity of methodological tools for the interactions of the SDGs. This research proposes a methodology that
takes advantage of the concepts of Economic Fitness for the creation of a Sustainability Fitness Index (SFI)
for the countries and a Goal Fitness Index (GFI) for each SDG. These indices are intended to provide a tool
to analyze the interrelationships between the Sustainable Development Goals in such a way that they offer a
new approach to address the capacities of the countries and the fulfillment of the SDGs. The results of the SFI
are a first attempt to identify development priorities aligned with the SDGs in each country, based on their
available productive capacities, which could help make more efficient use of their limited resources and
increase the achievement of the SDGs.
1 INTRODUCTION
The 2030 Agenda represents a new era in the
worldwide challenge of achieving some of the most
ambitious objectives for the humanity, setting a “plan
of action for people, planet and prosperity” that must
be achieved within 15 years (2015-2030) (UN, 2015).
In this pathway towards sustainability, the
countries have experienced several implementation
challenges, including limited resources (economic,
human, infrastructure, etc.), highly complex network
of interactions between SDGs, and lack of alignment
between national development plans and the 2030
Agenda. (Lack of policy coherence; policy vs politics).
In the last few years, the countries have sent their
Voluntary National Reviews (VNRs) to the High-
Level Political Forum on Sustainable Development of
the United Nations, sharing their experiences and
a
https://orcid.org/0000-0002-8385-2852
b
https://orcid.org/0000-0001-9966-6715
c
https://orcid.org/0000-0001-5672-3679
results in the implementation of the SDGs at the
national level (UN, 2016). The learnings from these
experiences have enhanced the importance of
improving the understanding of the nature and impact
of the interlinkages between the different SDGs at the
national level, considering their universal and
integrated design.
As many experts have underlined, in this global
scenario and facing the complexity and universality
of the SDGs, a priority setting for the implementation
of the 2030 Agenda is recommended (Pereira et al,
2021; Allen et al., 2018; Allen et al., 2018a; Weitz et
al., 2018; Zelinka & Amadei, 2019; McGowan et al.,
2018), in order to: improve the qualitative and
quantitative understanding on SDGs interactions;
identify direct and indirect effects of SDGs
interactions; detect patterns on SDGs interactions;
identify critical goals and targets (central nodes) in
González, S., Pereira, G. and González, A.
Sustainability and Goal Fitness Index for the Analysis of Sustainable Development Goals: A Methodological Proposal.
DOI: 10.5220/0011122400003197
In Proceedings of the 7th International Conference on Complexity, Future Information Systems and Risk (COMPLEXIS 2022), pages 105-115
ISBN: 978-989-758-565-4; ISSN: 2184-5034
Copyright
c
2022 by SCITEPRESS – Science and Technology Publications, Lda. All rights reserved
105

the SDG network; and secondary analyses to increase
synergies and avoid trade-off in the implementation
of the 2030 Agenda.
This work follows the ideas presented in (Pereira
et al., 2021) who presented a paper that studies the
interactions between countries and their compliance
with the SDGs from the point of view of complex
systems, based mainly on the theory of economic
complexity proposed by (Haussman et al., 2014).
The aim of this study is to propose a new
methodological approach for the analysis of the SDG
interlinkages and the progress of the countries in the
implementation of the 2030 Agenda, based on their
accumulated sustainability capabilities measured
using economic fitness and network theory
(Tacchella et al., 2012; Cristelli et al., 2013;
Tacchella et al., 2013; Pugliese, Zaccaria &
Pietronero., 2016).
This paper is organized as follow: first, in Section
II a brief account of state-of-the-art literature on
Sustainable Development Goals (SDGs) and SDG
interlinkages analysis from the point of view of
Economic Fitness is made. Then, in Section III the
methodology, based on the economic fitness (from
the point of view of complexity analysis) to evaluate
the SDG interlinkages is explained. Third, in Section
IV, we show the results and discussion of our
analyses, including the interpretation of the findings.
Finally, in Section V, the conclusions are
presented.
2 LITERATURE REVIEW
The UN Sustainable Development Goals (SDGs),
adopted in September 2015 in the document called
“Transforming our world: the 2030 Agenda for
Sustainable Development” set the structure of the
SDGs, including its 17 goals, 169 targets and 244
indicators, as an attempt to change the approach from
the top-down agenda of the Millenium Development
Goals (MDGs) to the bottom-up agenda of the SDGs.
This new approach should improve the adoption of
the “indivisible and integrated” 2030 Agenda,
focusing on the 3 dimensions of the sustainable
development: social, economic, and environmental
(UN, 2015).
As mentioned before, the scarcity of resources is
one of the main challenges that the countries must
face in their way towards sustainability. In this
context, and according to (UNCTAD, 2014),
achieving the 2030 Agenda will require not only
political commitment, but also important global
investments of approximately 5-7 trillion USD per
year (2015-2030), which already presents important
gaps.
Then, from the perspective of the complexity of
the interactions in the SDG`s network, the evidence
from the VNRs reveal the need of improving the
understanding of the interlinkages between goals,
targets, and indicators in the system, to take
advantage of the synergies and to improve policy
coherence and alignment with the national
development plans (UN, 2016; Allen et al., 2018;
Allen et al., 2018a; Weitz et al., 2018; Pereira et al.
2021).
2.1 The Design & Nature of the SDGs
Since 2016 the scientific community has increased its
interest in the assessment, analysis, and evaluations
of the interlinkages between the SDGs, proposing
different approaches and using a diversity of
methodological tools for SDG interactions.
Moreover, the analysis of SDG interlinkages offers
fundamental information for policymakers, guiding
the decision-making and the policy-design, to balance
the different interests of the country (social,
economic, or environmental).
In this context, the authors have begun to focus
the analysis in the progress of countries in the
accomplishment of the SDGs, through rankings (by
goals, targets or indicators), qualitative
methodologies, traffic light approaches, and many
others (Griggs et al., 2017; ICSU, ISSC, 2015; Sachs
et al., 2018; Schmidt-Traub et al., 2017; Salvia et al.,
2019), in order to identify critical goals and targets
for the sustainable development of the countries.
Nowadays, the report made by (Sachs et al., 2018)
and published annually since 2016 with Bertelsmann
Stiftung and the Sustainable Development Solutions
Network (SDSN), is the reference for evaluating the
progress of countries towards sustainable
development.
The analysis and evaluation of the SDGs is a very
complex task, as it has been already underlined in
several studies (Dargin et al., 2019; Karnib, 2017;
McCollum, et al., 2018), therefore, new
methodologies have been proposed in the last years to
improve our understanding.
In the beginning, the literature on the SDG
interlinkages focused on the study of one-on-one
impact, evaluating the interaction of an SDG with
another goal or development priority (Vladimorova &
Le Blanc, 2016, Alcamo, 2019; Nerini et al., 2017;
Maes et al., 2019).
More recently, the scope has been expanded to the
analysis of the interactions between a set of goals, in
COMPLEXIS 2022 - 7th International Conference on Complexity, Future Information Systems and Risk
106

an approach known as the “nexus approach”. Then,
several studies propose different “nexus” and
combinations of set of goals, as for example: water-
energy-food nexus, energy-poverty-climate nexus,
etc. (Liu et al, 2018; Bleischwitz et al, 2018; Dargin
et al., 2019; Karnib, 2017).
As mentioned by (Liu et al., 2018), the nexus
approach facilitates the identification of synergies
between goals, the improvement of policy design and
the implementation of policies. Moreover, the nexus
approach reduces the “silo-thinking” to focus on the
synergies of critical resources and the promotion of
wellbeing (Liu et al., 2018; Bleischwitz et al., 2018;
Dargin et al., 2019; Karnib, 2017).
Authors using the nexus approach underline that
focusing only on the type of interaction is not enough,
and it must also be considered an impact analysis
(direct or indirect) of the interactions (Karnib, 2017).
Recent studies have incorporated semi-
quantitative methodologies with the purpose of
improving the comprehension of the interactions
(synergies and trade-off) in the intricate and complex
SDG network, offering a new perspective in the
analysis and visualization of the different interactions
(i.e. network analysis) (Allen et al, 2018; Allen et al,
2018a; Weitz et al., 2018; Zelinka & Amadei, 2019;
McGowan et al, 2018; Lusseau & Mancini, 2018).
The results of these studies are relevant for
policymakers and stakeholders to comprehend the
nature of the SDG interlinkages and to improve the
SDG priority setting at the national level.
Nevertheless, even if we still have low understanding
of the SDG interactions, the existent literature in this
topic have demonstrated that there are more positive
interactions (synergies) than trade-off in the SDG
network (Weitz et al., 2018; Nerini et al., 2017; Maes
et al., 2019).
Even with its limitations, the analysis of
interactions between SDGs are fundamentally
important for politics and policymakers, considering
that allows the identification of development
priorities for the countries, the validation of strategic
policies through the alignment with the prioritized
SDGs (policy coherence) and the evaluation of
strategies for development at the national level (Allen
et al., 2018a), Le Blanc, 2015; Nerini et al., 2017;
Karnib, 2017; Maes et al., 2019; Griggs et al., 2017).
The challenge of understanding the intricate and
complex SDG network of interactions have been
clearly explained by (Weitz et al., 2018), which have
expressed: “Understanding interactions between
targets requires quite detailed information, but it also
requires the ability to maintain a holistic view of the
system as a whole, since it is possible that one policy
change can change the dynamics of the whole
system”.
2.2 Understanding the SDG
Interlinkages
Considering the universality of SDGs, the diversity of
sectors and stakeholders, the scarcity of resources,
and the complexity of the interactions in the SDG
network, is inevitable and almost obligatory, the
identification of priorities within the SDGs (Allen et
al, 2018; Weitz et al., 2018; McGowan et al., 2018;
Alcamo, 2019; Nilsson et al., 2016; Scherer et al.,
2018; Singh et al., 2018; Pereira et al., 2021). The
selection of priorities within the SDGs, are the
reflection of the strategies and policies that each
country (expressed by its policymakers) has decided
to adopt, considering the level of urgency in each
sector (McGowan et al., 2018).
The study of the SDG interlinkages has rapidly
evolved from the pioneer study of (Le Blanc, 2015),
criticized for the superficiality of the analysis of the
interactions between SDGs and the mapping
visualization. Similarly, (Vladimorova & Le Blanc,
2016) have presented an analysis of official reports
from the United Nations to evaluate the interactions
between education and SDGs, using the wording
reference methodology. Again, as in the previous
study, the results lack of deepness in the analysis of
the SDG interlinkages.
Applying the network approach and reinforcing
the results presented by (Le Blanc, 2015) about the
asymmetry of the interlinkages between the SDGs,
(McGowan et al., 2018) highlight that those
interlinkages are uneven, observing the lack of
connections between critical SDGs as those related to
gender equality, peace, and governance. These
authors have based their analysis on the report from
the (Griggs et al., 2017) and based on the interactions
identified on it from a science-based perspective
(ICSU, ISSC, 2015), they constructed a SDG network
of interactions considering 4 main elements: degree
(number of links per node), strength (total number of
links from a node), closeness (distance with other
nodes in the network and centrality of a node in the
network), betweenness (flow of information through
the network).
Following with the use of the network approach,
(Allen et al., 2018) and (Allen et al., 2018a) have
implemented a network analysis of SDG targets
interlinkages for 22 Arab countries, based on the
assessment scale of (Nilsson et al., 2016) for the
evaluation of the intensity of the interactions (from -
3 to +3), through a cross-impact matrix to identify
Sustainability and Goal Fitness Index for the Analysis of Sustainable Development Goals: A Methodological Proposal
107

synergies, trade-off, and neutral interactions. The
SDG network, obtained through an expert elicitation
process, considers to 2 main network metrics: the
outdegree and closeness centrality. These results are
later used as inputs for the evaluation of policy gaps
and the design of a multi-criteria analysis, helping to
set the development priorities for the Arab region.
Using the same methodology, (Weitz et al., 2018)
have evaluated the interactions between 34 SDG
targets, obtaining results that reinforce the hypothesis
that there are more synergies than trade-off in the
SDG network, but in which the trade-off represents a
serious threat for the accomplishment of the 2030
Agenda worldwide. The SDG network obtained in
this study provides a deeper level of analysis,
showing the directionality of the interactions between
SDG targets, the type of interactions, the intensity of
the influence of targets in the SDG network, and the
clusters of SDG targets in the network.
Recently (Lusseau & Mancini, 2018) analyzed
how the interactions of the SDGs, at the goal and
target levels, vary according to the level of income of
countries. The results show the existence of unstable
networks, composed by antagonistic subgroups,
where the identification of development of priorities
in each country is needed.
2.3 SDG Priorization & Economic
Complexity
The study from (El-Maghrabi et al., 2018) has set the
foundations for the use of the principles of economic
complexity and the product-space theory in the
challenge of setting priorities within the SDGs, based
on the capabilities of each country. This study, from
the World Bank, has only made a methodology
proposal and offered only a few examples of its
utility, having a very limited scope.
In the same context, (Pereira et al., 2021) broaden
the scope of the methodology proposed by (El-
Maghrabi et al., 2018) and offered a wider
perspective on how countries could use the economic
complexity principles and the product space theory to
set priorities, to rank the SDGs according to their
complexity (Goal Complexity Index), and to rank the
countries according to their performance towards
sustainable development (Sustainability Complexity
Index).
The results from (Pereira et al., 2021) show that
according to the Goal Complexity Index (GCI), the
top 3 of more complex goals in the 2030 Agenda, are
the SDG12 (Responsible Production &
Consumption), SDG13 (Climate Action) and SDG17
(Peace, Governance & Partnerships). In the other
hand, the least complex goals are SDG9 (Industry,
Innovation, and Infrastructure), SDG3 (Health &
Wellbeing) and SDG7 (Energy). In this context, an
optimal strategy for countries could be following the
sustainability complexity path, to fully achieve the
2030 Agenda, advancing from the accomplishment of
less complex goals to more complex goals,
From the perspective of the Sustainability
Complexity Index (SCI), the results show that the
biggest challenges for the accomplishment of the
SDGs mainly remain in Africa and Southeast Asia. In
South America, Bolivia and Venezuela present the
lowest levels of SCI.
It is important to note that the work carried out by
(Pereira et al., 2021) resulted in the inspiration for the
realization of this work and resulted in the
methodological proposal that is presented as an
alternative for the study of sustainable development
objectives in an innovative way.
2.4 Economic Fitness
The Economic Fitness theory proposes a new
algorithm that shows an iterative and non-linear
approach, which makes it possible to efficiently
capture the link formed between the export basket of
different countries and their industrial
competitiveness (Tacchella et al., 2012; Cristelli et
al., 2013; Tacchella et al., 2013). This model has its
initial basis in the construction of a binary matrix of
countries and products (Mcp), which represents the
export basket of each country, whose elements are 1
if country "c" exports product "p" with revealed
comparative advantage and 0 otherwise. This method
consists of coupled nonlinear maps, and in each
iteration new information is added.
Therefore, the general idea of the algorithm
proposed in the Economic Fitness theory lies in
defining an iteration process for the fitness of the
countries (F
c
) with the complexity of the products
(Q
p
), and then obtaining the values of the
convergence. In the case of F
c
, it is appropriate that it
be proportional to the sum of the exported products
weighted by their complexity Q
p
.
For the case of Q
p
it becomes less intuitive,
because, in a first approximation, the complexity of a
product is inversely proportional to the number of
countries that export it. But in each iteration more
information is added considering that, if a country has
a high level of Fitness, the weight is reduced to limit
the complexity of a product, on the other hand,
countries with low Fitness contribute more and
tended to limit the complexity of the products
(Tacchella et al., 2012; Cristelli et al., 2013;
COMPLEXIS 2022 - 7th International Conference on Complexity, Future Information Systems and Risk
108

Tacchella et al., 2013; Pugliese, Zaccaria &
Pietronero., 2016). These ideas are summarized in the
iteration of the following equations:
⎩
⎪
⎨
⎪
⎧
F
()
= M
Q
()
Q
()
=
1
∑
M
1
F
()
→
⎩
⎪
⎨
⎪
⎧
F
()
=
F
()
〈
F
()
〉
Q
()
=
Q
()
〈
Q
()
〉
Where:
n=Index of iteration.
c=Total number of countries.
p=Total number of products.
F
=Fitness of the country "c".
Q
=Product Complexity "p".
M
=Product − Country Logical Matrix.
𝑂𝑏𝑠.: F
and Q
corresponding to the
normalization
Since this theory proposes that less complex
exporters make a dominant contribution to product
complexity, nonlinearity is a fundamental
mathematical property that is unavoidable in view of
the problem of economic diversification (Cristelli et
al., 2013). For the definition of the complexity of the
products, the sum in the denominator is strongly
dominated by the countries that have a lower Fitness
measure. Another issue that must be considered when
considering the product complexity denominator is
that, as the total number of countries that export that
specific product increases, this means that the
complexity of the products decreases, considering
thus the ubiquity of the product.
To establish the M
cp
Matrix, which allows the
calculations of the Economic Fitness, it is necessary
to consider the Revealed Comparative Advantage.
The definition of Revealed Comparative Advantage
(RCA) proposed by Balassa (1965), is used to make
countries and products comparable, since it represents
the exports of products by country. This index
establishes that a country has revealed a comparative
advantage in a product if it exports more than the rest
of the world, in which case the RCA index adopts a
value equal to or greater than one; if it is less than one,
it indicates the opposite. It is formally defined as:
𝑅𝐶𝐴
=
X
X
X
X
Where:
X
=Exports o
f
the countr
y
"c" o
f
the product "p".
X
=Total Exports of the country "c".
X
=Total World Exports o
f
the product "p".
X
=Total World Exports o
f
the year
(
All Products
)
.
This measure makes it possible to build a matrix
that connects each country with the products it
manufactures. The entries in the matrix are 1 if the
export of the product in each country with Revealed
Comparative Advantage is greater than or equal to 1,
and 0 otherwise. We formally define this as the M
cp
(Haussman et al., 2014) matrix, as:
𝑀
=
1, if RCA
≥1
0, otherwise
3 METHODOLOGY
3.1 Methodological Design:
Sustainability and Goal Fitness
Index
This research proposes a methodology that takes
advantage of the concepts of Economic Fitness for the
creation of a Sustainability Fitness Index (SFI) of
the countries and a Goal Fitness Index (GFI) for
each SDGs. These indices are intended to provide a
tool to analyze the interrelationships between the
Sustainable Development Goals in such a way as to
offer a new approach for addressing the capabilities
of the countries and the fulfilment of the SDGs.
To achieve the implementation of the proposed
methodology, two fundamental steps are required.
The first step is to identify the SDG compliance
capabilities of each of the study countries, like the use
of the RCA index proposed by Balassa (1966); and in
a second step, perform the calculations of the SFI and
the GFI based on the mathematical models proposed
by Tacchela et al., (2012).
Step 1: Goal Achievement Capability (GAC)
Each country is responsible for voluntarily reporting
its progress in terms of compliance with the different
SDGs. Each of the 17 Sustainable Development
Goals requires specific capabilities to be achieved.
Although each country is different and has its own
challenges to achieve the goals, however, the
capabilities required for their achievement will
possibly be very similar (at least to a great extent).
Then, considering the concepts of comparative
advantages, an index based on the Goal
Achievement Capability (GAC) is proposed, which
will indicate the relationship between the SDGs
(achieved) and the countries, establishing a
country/goal matrix (M
cg
) like the proposal in Pereira
et al., (2021).
To determine the value of the Goal Achievement
Capability, we propose the use of data obtained from
Sustainability and Goal Fitness Index for the Analysis of Sustainable Development Goals: A Methodological Proposal
109

the public database from the Sustainable
Development Report 2019 proposed by Sachs et al.,
(2019). In this database, a qualitative evaluation is
presented, based on the performances reported by the
countries in each SDG, where we can observe a 4-
colour scale: Green = Goal Achievement; Yellow =
Challenges Remain; Orange = Significant Challenges
and Red = Major Challenges.
Given the scale, we propose that for any SDG that
presents a performance colour other than "Red", it
will be considered that the country has the minimal
capabilities to meet the SDG. So, it is represented by
the following equation:
𝐺𝐴𝐶
=
1𝑖𝑓 𝐺𝑜𝑎𝑙≠𝑅𝑒𝑑
0𝑜𝑡ℎ𝑒𝑟𝑤𝑖𝑠𝑒
Once the GAC value is obtained for each country
and for each goal, a logical matrix of countries by
goals is created, which we call M
cg
, where, for this
model based on the available data on compliance with
the SDGs, it is necessary to M
cg
= GAC
cg
Step 2: Calculation of the Sustainability Fitness Index
and the Goal Fitness Index
Once the capabilities to meet the goals of each SDG
for each country have been identified, the
mathematical models used in the Theory of Economic
Fitness [Tacchella et al., 2012] (See Section 2.4) for
the analysis of the SDGs are extrapolated. The
following equations are used:
⎩
⎪
⎨
⎪
⎧
SFI
()
= M
GFI
()
GFI
()
=
1
∑
M
1
SFI
()
→
⎩
⎪
⎨
⎪
⎧
SFI
()
=
SFI
()
〈
SFI
()
〉
GFI
()
=
GFI
()
〈
GFI
()
〉
Where:
n=Index of iteration.
c=Total number of countries.
g=Total number of goals.
SFI
=Sustainability Fitness of the Country "c".
GFI
=Goal Complexity of the Goal "g".
M
=Country − Goal Logical Matrix.
Obs.: SFI
and GFI
corresponding to the
normalization
3.2 Methodological Steps
A work based on structured methodology in 5 well-
defined steps was carried out.
4
Data used for the study: https://bit.ly/34YTk0B
Step 1: Identification of Secondary Databases
All data used for this study were obtained from the
following secondary sources:
• SDG compliance data they were obtained from
the public database from the Sustainable
Development Report 2019 proposed by Sachs et
al., (2019)
• Socio-Economic Data: Datos.bancomundial.org,
URL: https://datos.bancomundial.org/indicator/
NY.GDP.PCAP.CD
It should be noted that the data used for the study
is available to interested parties
4
.
Step 2: Design of the Complexity Fitness
Mathematical-Computational Model for the Analysis
of the SDGs
The mathematical-computational model was created
based on the Economic Fitness models proposed by
Tacchela et al., (2012) and runs were made using
proprietary models in the software MatLab
®
. In case
any interested party requires the models, they can
request it from the authors without any
inconvenience.
The scope of the study covered a total of 191
countries. The countries Haiti and Somalia were not
considered for this study because they have not
registered any SDG for which they have a GAC
(GAC
cg
= 1), which does not allow an adequate
analysis for the proposed model.
On the other hand, the convergence of the model
when considering the SFI occurs on average at
iteration 24, and when considering the GFI it occurs
on average at iteration number 25, in both indices a
𝑡𝑜𝑙𝑒𝑟𝑎𝑛𝑐𝑒=10
how to stop point for iterations.
Step 3: Validation of the Results of the Sustainability
Fitness Index
Validations were performed from two positions. The
first corresponds to a comparison between the results
obtained under this proposed model vs the results
obtained by Pereira et al., (2021). On the other hand,
some correlations were made with other known socio-
economic indices to identify some correlation and
thus analyze its implications.
Step 4: Results Analysis
Descriptive comments were made on the results
obtained from the model, in addition to the results of
the validations carried out.
COMPLEXIS 2022 - 7th International Conference on Complexity, Future Information Systems and Risk
110
Step 5: Conclusions and Recommendations
After the analysis of the results, a conclusion on the
methodological proposal is presented, as well as a
critical review of the results and the model presented.
4 RESULTS
Results related to SFI and GFI were obtained, in
addition to the validations carried out for the model.
In terms of the SFI, results were obtained for 191
countries, where their sustainability capabilities can
be inferred based on compliance with the SDGs.
Figure 1 shows graphically the general results of the
SFI.
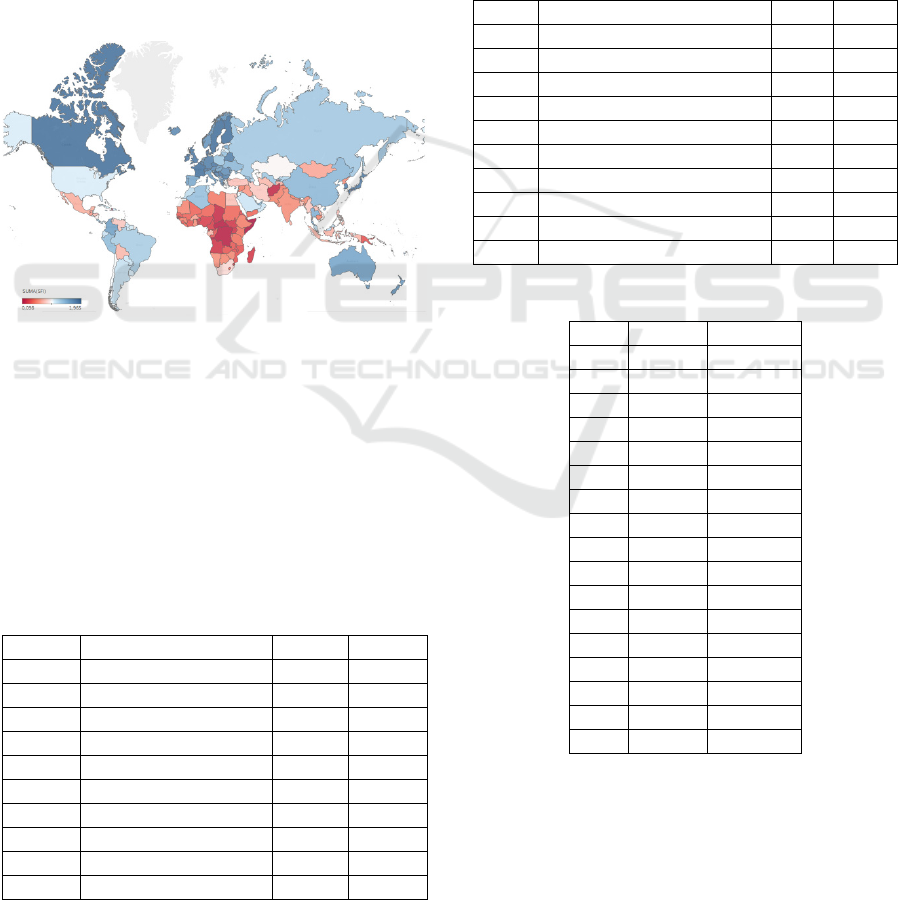
Figure 1: Worldwide SFI 2019.
The Figure 1 show the results SFI through heat
map for the year 2019, where warmer colors reflect
lower levels of sustainability fitness. Then, from
Figure 1, the biggest challenges for the
accomplishment of the SDGs mainly remain in Africa
and Southeast Asia. In the same context, the biggest
challenge in South America seems to be in Bolivia,
Chile, Venezuela, and Ecuador. Nevertheless, from
the results of the SFI we can observe a diversity and
Table 1: Top-10 best performers SFI 2019.
Rank Country Id. SFI
1 Croatia HRV 1,965
2 Canada CAN 1,867
3
F
inland FIN 1,867
4
F
rance FRA 1,867
5 Sweden SWE 1,867
6 Switzerland CHE 1,827
7 Denmar
k
DNK 1,827
8 Czech Republic CZE 1,824
9 Serbia SRB 1,824
10 United
K
in
g
dom GBR 1,813
heterogeneity of performances worldwide, with
countries showing a strong path towards sustainable
development and the achievement of the SDGs.
For example, in Table 1 we can observe the list of
the top-10 performers in the SFI, finding mostly
European and high-income countries. In the other
hand, in the list of worst performers in the SFI (Table
2), we mainly find African and low-income countries.
However, further studies are needed to improve our
understanding of the correlation and causality
between performance on the SFI, level of income and
the achievement of the SDGs worldwide.
Table 2: Top-10 worst performers SFI 2019.
Rank Country Id. SFI
184 South Sudan SSD 0,254
185
A
n
g
ola
A
GO 0,251
186 U
g
anda UGA 0,242
187
M
icronesia,
F
ed. Sts.
F
SM 0,230
188 Chad TCD 0,203
189
Afg
hanistan
A
F
G
0,190
190
H
aiti
H
T
I
0,152
191 Central
Af
rican Republic CAF 0,149
192 Con
g
o, Dem. Rep. COD 0,149
193 Somalia SOM 0,098
Table 3: Ranking of GFI 2019.
Rank Goal GFI 2019
1 Goal 16 2,073
2 Goal 2 1,962
3 Goal 3 1,689
4 Goal 9 1,434
5 Goal 10 1,295
6 Goal 6 1,136
7
Goal 1 0,984
8 Goal 5 0,851
9 Goal 8 0,806
10 Goal
7
0,802
11 Goal 14 0,779
12 Goal 4 0,760
13 Goal 11 0,674
14 Goal 1
7
0,466
15 Goal 15 0,443
16 Goal 13 0,435
1
7
Goal 12 0,411
In Table 3 you can see the result obtained for the
GFI. The SDGs that are at the bottom of the ranking
are those for which the least capabilities are required
for their implementation in the countries. On the other
hand, the SDGs with the highest GFI and therefore
located in the first places, correspond to those that are
Sustainability and Goal Fitness Index for the Analysis of Sustainable Development Goals: A Methodological Proposal
111
highly complex, so not many countries have the
capacity to achieve them.
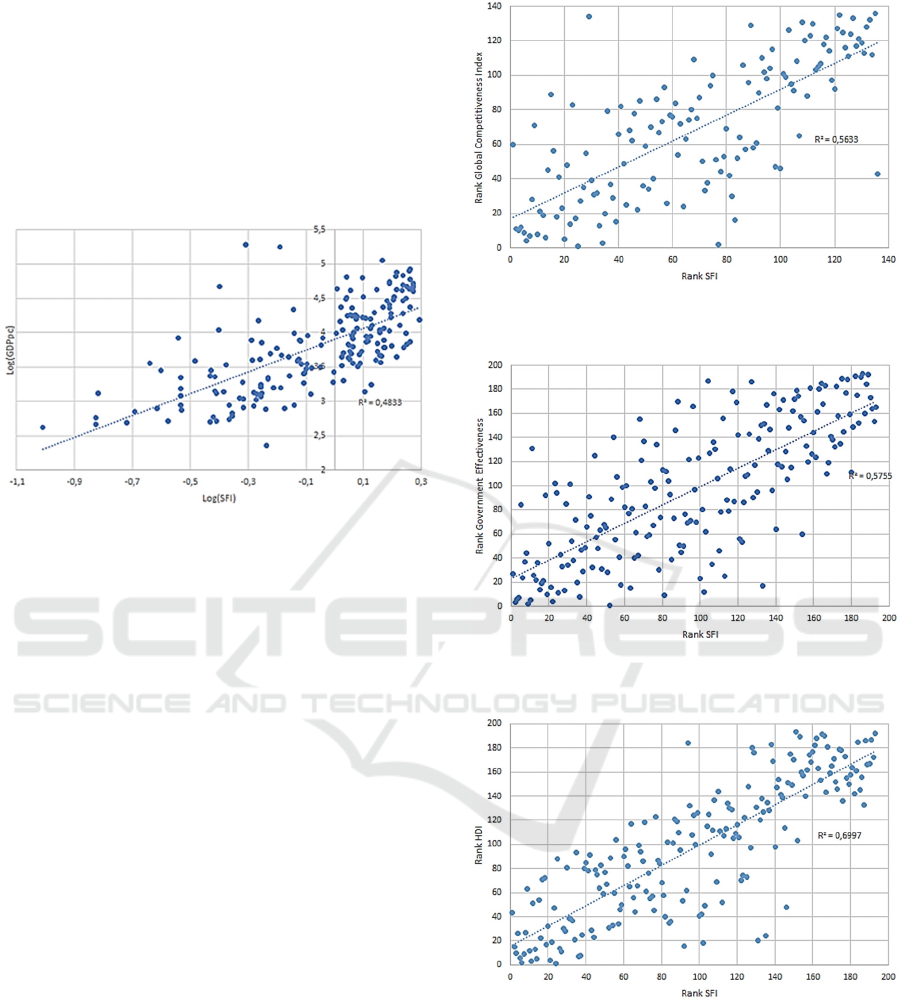
On the other hand, following the results obtained
in the validation process of the SFI 2019, four
correlation analyzes were carried out with: The
GDP
pc
; The Rank of Global Competitiveness Index;
The Rank of Government Effectiveness; The Rank of
Human Development Index for all countries covered
in the study for the year 2019.
Figure 2: Relation between SFI 2019 Vs GDP
pc
2019.
There is a very interesting trend in terms of the
SFI and the level of the GPD
pc
of the countries. It
could be inferred that as the GPD
pc
increases, the SFI
also increases. Therefore, it is an element that could
be important to increase the fitness of countries in
terms of sustainability (See Figure 2).
This behavior is also repeated when the SFI is
subjected to correlation with other indices such as the
Rank of Global Competitiveness Index and the Rank
of Government Effectiveness. Both high indices
imply that the countries are highly competitive and
effective. It is not strange to infer that they have the
capacity to implement programs and public policies,
which would at least make it easier to establish and
comply with plans and actions that allow achieving
sustainability goals. In Figure 3 and Figure 4 the
mentioned behavior can be clearly observed.
Regarding the behavior of the connection
between the SFI and the HDI, an interesting
connection could also be observed. This allows us to
infer a priori that countries with a HIGH index may
have greater capacities to achieve sustainability
goals. It would be necessary to carry out more
studies and with a greater range of years to obtain
better observations and therefore better conclusions
on this point (See Figure 5).
Figure 3: Relation between Rank of SFI 2019 Vs Rank of
Global Competitiveness Index
2019.
Figure 4: Relation between Rank of SFI 2019 Vs Rank of
Government Effectiveness 2019.
Figure 5: Relation between Rank of SFI 2019 Vs Rank of
Human Development Index
2019.
5 CONCLUSIONS
The methodological approach proposed in this study
aims to guide the policy-design and decision-making
in countries, through the use and consideration of
data, capabilities, comparative advantages, and
COMPLEXIS 2022 - 7th International Conference on Complexity, Future Information Systems and Risk
112
fitness metrics. As in previous studies, the analysis of
the SFI is limited to the availability of data series,
public information, and reliable data on the progress
of the countries in their performances in the different
SDGs. It must be underlined, that the methodology
used for the SFI is limited, because the data from the
SDG Report are not comparable year-by-year.
However, the Sachs et al., (2021) has stablished a
definitive methodology that will allow data
comparability for the following years.
The results of the SFI are a first attempt to identify
development priorities aligned with the SDGs in each
country, based on their available productive
capabilities, which could help to make a more
efficient use of their limited resources and boost the
achievement of the SDGs. Following this path could
help the country countries to accelerate their way
towards sustainable development and to create
synergies within the SDG network.
It is important to highlight that by taking the
Economic Fitness model, applied to the analysis of
the SDGs, it is possible to take advantage of the
virtues to obtain more information about the
capabilities necessary to achieve a goal. This occurs
because the countries that achieve few goals provide
more information, since it can be inferred that the
goals that these countries have achieve with less
capabilities than others and have still managed to
meet them.
For the next steps, we suggest further studies on
the SFI and GFI, to improve the experimentation and
validation of the mathematical model and fitting the
parameters used to define which countries presents
the minimal capabilities to achieve an SDG.
ACKNOWLEDGEMENTS
The authors are very grateful to the Paraguayan
National Council of Science and Technology
(CONACyT) for financial support through the
PRONII Program.
AUTHORS CONTRIBUTIONS
Activities
Methodology
Literature
Review
Mathematic
Model
Data
Manuscript
Calculations
Results
Analysis
S.G. X X X X X
G.P. X X X X
A.G. X X X X
REFERENCES
Alcamo, J., 2019. Water quality and its interlinkages with
the Sustainable Development Goals. Current Opinion in
Environmental Sustainability, 36, pp. 126–140.
Allen, C., Metternich, G., Wiedmann, T., 2018. Prioritising
SDG targets: assessing baselines, gaps and
interlinkages. Sustainability Science.
https://doi.org/10.1007/s11625-018-0596-8
Allen, C., Metternich, G., Wiedmann, T., 2018a. Initial
progress in implementing the Sustainable Development
Goals (SDGs): a review of evidence from countries.
Sustainability Science. https://doi.org/10.1007/s11625-
018-0572-3
Balassa, B. (1965). Trade liberalisation and “revealed”
comparative advantage 1. The manchester school,
33(2), 99-123.
Bleischwitz, R., Spataru, C., VanDeveer, S.D., Obersteiner,
M., van der Voet, E., Johnson, C., Andrews-Speed, P.,
Boersma, T., Hoff, H., van Vuuren, D.P., 2018.
Resource nexus perspectives towards the United
Nations Sustainable Development Goals. Nature
Sustainability, Volume 1, pp. 737-743.
https://doi.org/10.1038/s41893-018-0173-2
Cristelli, M., Gabrielli, A., Tacchella, A., Caldarelli, G., &
Pietronero, L. (2013). Measuring the intangibles: A
metrics for the economic complexity of countries and
products. PloS one, 8(8), e70726.
Dargin, J., Daher, B., Mohtar, R.H., 2019. Complexity
versus simplicity in water energy food nexus (WEF)
assessment tools. Science of the Total Environment,
650, pp. 1566–1575. https://doi.org/10.1016/j.scitote
nv.2018.09.080
Dörgo, G., Sebestyén, V., Abonyi, J., 2018. Evaluating the
Interconnectedness of the Sustainable Development
Goals Based on the Causality Analysis of Sustainability
Indicators. Sustainability 2018, 10, 3766;
doi:10.3390/su10103766
El-Maghrabi, M. H., Gable, S., Osorio Rodarte, I., Verbeek,
J., 2018. Sustainable Development Goals Diagnostics:
An Application of Network Theory and Complexity
Measures to Set Country Priorities. World Bank Group
- Office of the Senior Vice President UN Relations and
Partnerships. Policy Research Working Paper 8481,
WPS8481.
Felipe J, Hidalgo CA. Economic diversification:
implications for Kazakhstan. Development and modern
industrial policy in practice. Issues and country
experiences. Cheltenham UK: Edward Elgar Pub; 2015.
Gusmao, R.G., Leal Filho, W., Gonçalves, O.L., de Mattos,
D.L., Veigas, L., 2018. A literature-based review on
potentials and constraints in the implementation of the
sustainable development goals. Journal of Cleaner
Production, 198, pp. 1276-1288.
https://doi.org/10.1016/j.jclepro.2018.07.102
Hausmann, R., Hidalgo, C. A., Bustos, S., Coscia, M., &
Simoes, A. (2014). The atlas of economic complexity:
Mapping paths to prosperity. Mit Press.
ICSU, ISSC, 2015.Review of the Sustainable Development
Goals: The Science Perspective. Paris: International
Sustainability and Goal Fitness Index for the Analysis of Sustainable Development Goals: A Methodological Proposal
113

Council for Science (ICSU). ISBN: 978-0-930357-97-9
International Council for Science (ICSU), 2017. A Guide to
SDG Interactions: from Science to Implementation
(D.J. Griggs, M. Nilsson, A. Stevance, D. McCollum
(eds)). International Council for Science, Paris. DOI:
10.24948/2017.01
Le Blanc, D., 2015. Towards Integration at Last? The
Sustainable Development Goals as a Network of
Targets. Sustainable Development, 23, pp. 176-187.
DOI: 10.1002/sd.1582
Liu, J., Hull, V., Godfray, H.C.J., Tilman, D., Gleick, P.,
Hoff, H., Pahl-Wostl, C., Xu, Z., Chung, M.G., Sun, J.,
Li, S., 2018Nexus approaches to global sustainable
development. Nature Sustainability, Volume 1, pp.
466-476. https://doi.org/10.1038/s41893-018-0135-8
Lusseau, D., Mancini, F., 2018. Income-based variation in
Sustainable Development Goal interaction networks.
Nature Sustainability. https://doi.org/10.1038/s41893-
019-0231-4
Karnib, A., 2017. Mapping the direct and indirect
interlinkages across the sustainable development goals:
A qualitative nexus approach. International Journal of
Development and Sustainability, Volume 6, No. 9, pp.
1150-1158.
Llamosas, C., Pereira, G., González, A., Blanco, G., 2021.
Energy and development: exploring the potential of the
energy sector to fulfil development goals in Paraguay.
Población y Desarrollo, pp. 58-68, Vol. 27, No. 52,
Junio 2021. https://doi.org/10.18004/pdfce/2076-
054x/2021.027.52.058
Maes, M., Jones, K., Toledano, M. Milligan, B., 2019.
Mapping synergies and trade-offs between urban
ecosystems and the sustainable development goals.
Environmental Science and Policy, 93, pp. 181 -188.
https://doi.org/10.1016/j.envsci.2018.12.010
McGowan, P.J.K., Stewart, G.B., Long, G., Grainger, M.J.,
2018. An imperfect vision of indivisibility in the
Sustainable Development Goals. Nature Sustainability,
Brief Communication. https://doi.org/10.1038/s41893-
018-0190-1
McCollum, D.L., Gomez, L., Busch, S., Pachauri, S.,
Parkinson, S., Rogelj, J., Krey, V., Minx, J.C., Nilsson,
M., Stevance, A-S., Riahi, K., 2018. Connecting the
sustainable development goals by their energy inter-
linkages. Environmental Research Letters 13.
https://doi.org/10.1088/1748-9326/aaafe3
Moyer, J., Bohl, D., 2019. Alternative pathways to human
development: Assessing trade-offs and synergies in
achieving the Sustainable Development Goals. Futures,
105, pp.199-210. https://doi.org/10.1016/j.futures.20
18.10.007
Nerini, F., Tomei, J., Seng To, L., Bisaga, I., Parikh, P.,
Black, M., Borrion, A., Spataru, C., Castán, V.,
Anandarajah, G., Milligan, B., Mulugetta, Y., 2017.
Mapping synergies and trade-offs between energy and
the Sustainable Development Goals. Nature Energy.
https://doi.org/10.1038/s41560-017-0036-5
Nilsson, M., Griggs, D., Visbeck, M., 2016. Map the
interactions between Sustainable Development Goals.
Nature, Volume 534, pp. 320-322.
Nilsson, M., Chisholm, E., Griggs, D., Howden-Chapman,
P., McCollum, D., Messerli, P., Neumann, B.,
Stevance, A-S, Visbeck, M., Stafford-Smith, M., 2018.
Mapping interactions between the sustainable
development goals: lessons learned and ways forward.
Sustainability Science, 13, pp. 1489-1503.
https://doi.org/10.1007/s11625-018-0604-z
Pereira, G.; González, A. and Blanco, G. (2021).
Complexity Measures for the Analysis of SDG
Interlinkages: A Methodological Approach. In
Proceedings of the 6th International Conference on
Complexity, Future Information Systems and Risk -
COMPLEXIS, ISBN 978-989-758-505-0; ISSN 2184-
5034, pages 13-24. DOI: 10.5220/0010374600130024
Pugliese, E., Zaccaria, A., & Pietronero, L. (2016). On the
convergence of the Fitness-Complexity Algorithm. The
European Physical Journal Special Topics, 225(10),
1893-1911.
Sachs, J., Schmidt-Traub, G., Kroll, C., Lafortune, G.,
Fuller, G., 2018. SDG Index and Dashboards Report
2018. New York: Bertelsmann Stiftung and Sustainable
Development Solutions Network (SDSN).
http://sdgindex.org/reports/2018/
Sachs, J., Schmidt-Traub, G., Kroll, C., Lafortune, G.,
Fuller, G. (2019): Sustainable Development Report
2019. New York: Bertelsmann Stiftung and Sustainable
Development Solutions Network (SDSN).
Sachs, J., Kroll, C., Lafortune, G., Fuller, G., & Woelm, F.
(2021). Sustainable development report 2021.
Cambridge University Press.
Salvia, A., Leal Filho, W., Brandli, L., Griebeler, J., 2019.
Assessing research trends related to Sustainable
Development Goals: local and global issues. Journal of
Cleaner Production, 208, pp. 841-849.
https://doi.org/10.1016/j.jclepro.2018.09.242
Scherer, L., Behrens, P., de Koning, A., Heijungs, R.,
Sprecher, B., Tukker, A., 2018.Trade-offs between
social and environmental Sustainable Development
Goals. Environmental Science and Policy, 90, pp. 65-
72. https://doi.org/10.1016/j.envsci.2018.10.002
Schmidt-Traub, G., Kroll, C., Teksoz, K., Durand-Delacre,
D., Sachs, J., 2017. National baselines for the
Sustainable Development Goals assessed in the SDG
Index and Dashboards. Nature Geoscience, Vol.10, pp.
546-556. DOI: 10.1038/NGEO2985
Singh, G., Cisneros-Montemayor, A.M., Swartz, W.,
Cheung, W., Guy, J.A., Kenny, T-A., McOwen, C.J.,
Asch, R., Geffert, J.L., Wabnitz, C., Sumaila, R.,
Hanich, Q., Ota, Y., 2018. A rapid assessment of co-
benefits and trade-offs among Sustainable
Development Goals. Marine Policy, 93, pp. 223-231.
http://dx.doi.org/10.1016/j.marpol.2017.05.030
Tacchella, A., Cristelli, M., Caldarelli, G., Gabrielli, A., &
Pietronero, L. (2012). A new metrics for countries'
fitness and products' complexity. Scientific reports,
2(1), 1-7.
Tacchella, A., Cristelli, M., Caldarelli, G., Gabrielli, A., &
Pietronero, L. (2013). Economic complexity:
conceptual grounding of a new metrics for global
COMPLEXIS 2022 - 7th International Conference on Complexity, Future Information Systems and Risk
114

competitiveness. Journal of Economic Dynamics and
Control, 37(8), 1683-1691.
United Nations, Synthesis of voluntary national reviews
2016. Department of Economic and Social Affairs,
New York, 2016.
United Nations, Report of the Open Working Group of the
General Assembly on Sustainable Development Goals,
A/68/970: New York, 2014
UNCTAD (United Nations Conference on Trade and
Development): World investment report. 2014
https://unctad.org/en/PublicationsLibrary/wir2014_en.
pdf
United Nations, General Assembly: Transforming our
world: the 2030 Agenda for Sustainable Development,
A/RES/70/1: New York, 2015.
Vladimirova, K., Le Blanc, D., 2016. Exploring Links
Between Education and Sustainable Development
Goals Through the Lens of UN Flagship Reports.
Sustainable Development. DOI: 10.1002/sd.1626
Weitz, N, Carlsen, H., Nilsson, M., Skanberg, K., 2018.
Towards systemic and contextual priority setting for
implementing the 2030 Agenda. Sustainable Sciences,
13, pp. 531-548, https://doi.org/10.1007/s11625-017-
0470-0
Zelinka, D., & Amadei, B. (2019). Systems Approach for
Modeling Interactions Among the Sustainable
Development Goals Part 1. International Journal of
System Dynamics Applications, 8(1), 23–40.
doi:10.4018/ijsda.2019010102
Sustainability and Goal Fitness Index for the Analysis of Sustainable Development Goals: A Methodological Proposal
115
