
Teachers' and Students' Perception Regarding the Use of Moodle
Douglas Legramante
1a
, Ana Azevedo
2b
and José Manuel Azevedo
2c
1
Federal Institute of Rondônia, Vilhena Campus, Rondônia, Brazil
2
CEOS.PP, ISCAP, Polytechnic of Porto, Porto, Portugal
Keywords: e-Learning, Virtual Learning Environment, Moodle, Perception, Students, Teachers.
Abstract: This paper seeks to analyse the perceptions of students and teachers regarding the factors that influence
satisfaction and the intention to continue using Moodle. An approach that integrates DeLone and McLean's
Information Systems Success Model to Davis' Technology Acceptance Model is used. The two models are
widely used in research related to the context of e-learning. A quantitative methodological approach was
assumed, based on the post-positivist paradigm. Data collection was carried out employing a self-administered
questionnaire developed in Google Forms. Descriptive analysis techniques were applied for the data analysis
of 144 valid questionnaires. The results showed that teachers and students have a positive perception of the
ease of use and usefulness of Moodle, besides evidencing those users are satisfied and intend to continue
using Moodle. This research contributes to the formation of knowledge about the perception of Moodle users
as support for classroom teaching, providing helpful information for educational institutions, researchers,
managers, administrators, and designers of e-learning systems.
1 INTRODUCTION
With the development of Information and
Communication Technologies (ICT) and the
popularisation of the Internet, the use of Learning
Management Systems (LMS), also known as Virtual
Learning Environments (VLE), have been gradually
growing in educational institutions. VLE has been
used as a space to contribute and support the
development of the teaching and learning process,
meeting the needs and contemplating each
individual's pace who actively participates in that
process.
In Brazil, the use of VLE, such as Moodle, to offer
distance or semi-attendance education has been
significantly expanded (Cardoso, 2016) after the
approval of the Law of Directives and Bases of
Education (LDB) nº 9394/96, which regulates the
practices of Distance Education (DE) in regular
education, and the Ordinances 2253/01 and 4059/04
of the Ministry of Education (MEC), which allow
educational institutions to offer up to 20% of the
workload of their courses with no presential
a
https://orcid.org/0000-0002-5725-2589
b
https://orcid.org/0000-0003-0882-3426
c
https://orcid.org/0000-0001-6951-4278
activities. Many Higher Education Institutions (HEI)
have adopted VLE in their pedagogical projects
(Bedregal-Alpaca et al., 2019), both in online courses
and for support to face-to-face courses, stimulating
the use of new technologies and ways of learning
beyond the confines of the classroom.
Within the Federal Institute of Education, Science
and Technology of Rondônia (IFRO), the Vilhena
Campus was a precursor in the implementation of
Moodle. Since 2015 it has been used to complement
the workload of integrated technical courses, with the
offer of up to 20% of the workload in VLE. In the
following years, the model was also implemented in
the other undergraduate courses of the Campus. From
March 2020, with the advent of the new Covid-19 and
the consequent adoption of remote learning, the
classes were taught entirely in distance learning
format, with content and materials being made
available through Moodle. However, aspects of how
Moodle is used and its users' perceptions have never
been formally investigated so far within the
institution.
Given the above, this study has as the main
objective to analyse the perceptions of students and
Legramante, D., Azevedo, A. and Azevedo, J.
Teachers’ and Students’ Perception Regarding the Use of Moodle.
DOI: 10.5220/0011121800003182
In Proceedings of the 14th International Conference on Computer Supported Education (CSEDU 2022) - Volume 1, pages 523-532
ISBN: 978-989-758-562-3; ISSN: 2184-5026
Copyright
c
2022 by SCITEPRESS – Science and Technology Publications, Lda. All rights reserved
523

teachers regarding the factors that influence the
satisfaction and the intention to continue using
Moodle. In addition, we also seek to analyse the
frequency of use of Moodle activities and resources,
by teachers, in undergraduate courses in IFRO -
Campus Vilhena.
The structure for the rest of the paper is the
following. Firstly, some related topics are introduced.
Next, the methodology is described. Results are
presented and discussed in the following sections.
The article finishes with the conclusion.
2 RELATED TOPICS
2.1 Virtual Learning Environment
(MOODLE)
For its flexibility and customisation (Batista, 2016),
VLE enable synchronous (when it happens in real-
time) and/or asynchronous (when it does not happen
in real-time) interaction in face-to-face, distance or
semi-presence courses or subjects (Sebastião, 2015;
Sobreira, 2013). They can also be used to provide
content or materials and allow the management of
courses (Sebastião, 2015).
WebCT, developed by Murray Goldberg in 1996,
was the world's first successful VLE for higher
education. It was used by more than 10 million
students at its peak in over 2,500 universities in 80
countries (UBC Computer, 2004). Currently, several
systems of this category are available in the market,
emphasising Blackboard, of commercial nature, and
Moodle, a free and open-source system that allows
adaptations or modifications in its code (Batista,
2016). Moodle, an acronym for Modular Object-
Oriented Dynamic Learning Environment, is a
platform created to support the processes of teaching
and learning at a distance, developed in 1999 by
educator and computer scientist Martin Dougiamas in
his doctoral research at the Science and Mathematics
Education Centre, Curtin University of Technology,
Perth, Australia. Currently, Moodle is the most used
VLE globally, standing out as an important tool to
support the teaching and learning process (Costa et
al., 2017). Currently, with version 3.10, Moodle has
261 million users, 35 million courses and 179,000
sites in 243 countries (Moodle, 2020). Moodle allows
the simulation of various classroom situations,
providing a set of activities and resources that enable
and optimise synchronous and asynchronous
interaction between teachers and students (Sebastião,
2015). Despite this, previous research indicates that
the platform's resources and activities are under-
utilised, i.e. not used or used by a minimal number of
teachers (Badia et al., 2019; Batista, 2016; Rodrigues,
2020).
2.2 Factors Related to Satisfaction and
Continuity of Moodle Use
Davis' (1989) Technology Acceptance Model (TAM)
is the most widely used theory in e-learning
acceptance research, with 86% of studies using this
model as a base theory (Šumak et al., 2011). TAM has
been configured as one of the most used models in
studies that aim to explain and predict the individual
acceptance of technologies based on users'
perceptions (Al-Azawei et al., 2017; Pires & Costa
Filho, 2008; Šumak et al., 2011; Surendran, 2012).
TAM has been widely extended, employing different
variables. It has also been used successfully to explain
usefulness and use in different contexts, including e-
learning (Al-Fraihat et al., 2020; Surendran, 2012.
Studies conducted in the context of e-learning
systems have used TAM to predict the usefulness,
intention to use and usage of e-learning systems. (Al-
Fraihat et al., 2020). Thus, TAM constitutes an
adequate model to study the factors that influence
users' decision to use a specific e-learning technology
(Šumak et al., 2011). However, Bedregal-Alpaca et
al. (2019) highlight the need to add to TAM other
external variables that directly influence perceived
usefulness and ease of use.
After reviewing 180 research articles, published
from 1981 to 1987, DeLone and McLean (1992)
constituted a model to measure the success of
Information Systems (IS) (Al-Fraihat et al., 2020).
The model relates the aspects of system quality and
information quality with the use and satisfaction of
the user concerning the system and considers that
these factors affect the individual and organisational
impacts caused by the use of the system. After ten
years, the model was revised. DeLone and McLean
(2003) found theoretical evidence that service quality
positively influences user use and satisfaction and is
also a determinant of success (Cidral et al., 2018).
Although this model was developed in an
organisational context (Dağhan & Akkoyunlu, 2016),
researchers have adopted it, including in e-learning
systems. This was made either partially, entirely, in
extended form, or integrated with another model to
estimate various information systems' success, use,
and continuity (Wang & Chiu, 2011).
The literature review demonstrated that TAM is
the most widely used theory in e-learning. It is also
widely extended, being used as the base theory in
most studies. However, TAM seeks to determine and
A2E 2022 - Special Session on Analytics in Educational Environments
524

explain acceptance and use but not assess user
satisfaction. Hence, integration with the IS Success
Model proves valid since this model has also been
adopted in the e-learning contexts.
3 METHODOLOGY
This research proposes several variables that result
from the integration of the variables of TAM (1989)
and the variables information quality and satisfaction
of the IS Success Model (2003) to analyse the
perception of students and teachers of undergraduate
courses in IFRO - Campus Vilhena, regarding the
satisfaction and the intention to continue using
Moodle. Table 1 presents the definition of each of the
analysed variables. The study adopted a quantitative
approach. Data collection was conducted by means of
a self-administered questionnaire developed in the
Google Forms tool made available to participants via
the Internet. The data collection instrument was based
on the IS Success Model (DeLone & McLean, 2003)
and TAM (Davis, 1989). It encompasses five
variables, as stated in table 1, namely Quality of
Information (QI), Perceived Ease Of Use (PEOU),
Perceived Usefulness (PU), User Satisfaction (US),
and Behavioural Intention to use (BI).
Table 1: Definition of the analysed variables.
Definitio
n
Model/Author
QI
Quality of the information
that the system can store,
deliver or
p
roduce.
IS Success Model
(DeLone &
McLean, 2003
)
.
PEOU
The degree to which a
person believes that using a
particular system would be
free of effort.
TAM (Davis,
1989; Davis et al.,
1989) e TAM 2
(Venkatesh &
Davis, 2000).
PU
The degree to which a
person believes that using a
particular system would
enhance his or her job
p
erformance.
TAM (Davis,
1989; Davis et al.,
1989)
US
The degree to which a
person believes that using a
particular system will
improve their job
p
erformance.
IS Success Model
(DeLone &
McLean, 2003).
BI
Users' intention regarding
the continued use of the
information s
y
stem.
TAM (Davis,
1989; Davis et al.,
1989
)
Notes: Quality of Information (QI); Perceived Ease Of Use
(PEOU); Perceived Usefulness (PU); User Satisfaction (US);
Behavioural Intention to use (BI).
Two data collection instruments were designed
because some questions regarding the
characterisation of the participants were specific to
each of the categories (teachers and students). Both
questionnaires were composed of two sections. The
first section comprises a set of questions regarding the
characterisation of the participants. The second
section integrates the various statements referring to
the five variables under analysis (see appendix). For
the sample characterisation, we considered aspects
such as gender, age, ICT domain and frequency of
Moodle use, common to all participants; marital
status and occupation, exclusive to students; training
base, degree, teaching time and frequency of use of
Moodle resources, exclusive to teachers. In order to
ensure the suitability and correct context of the
present research, the statements were developed from
previous studies related to e-learning (Al-Fraihat et
al., 2020; Chiu et al., 2005; Dağhan & Akkoyunlu,
2016; Davis et al., 1989; DeLone & McLean, 2003;
Pereira et al., 2015; Roca et al., 2006; Venkatesh et
al., 2003) and adapted to the context of this study,
besides being adjusted according to the target
audience of each instrument; since, according to
Davis et al. (1989), the analysis of the adoption of a
technology or innovation should be adjusted to the
context to which it is submitted. All statements that
comprise the questionnaire were arranged in a Likert
scale of 5 points, with the anchors being "Strongly
Disagree" and "Strongly Agree", being "Neutral or
Uncertain" the intermediate position. On a Likert
scale, the participant is asked to respond to each of
the statements in varying degrees of agreement or
disagreement. Each answer receives its own
numerical score to measure the respondent's
favourable or unfavourable attitude. Thus, it is
possible to measure attitudes, perceptions, and know
the respondent's degree of agreement with the
proposed statements in the survey instrument
(Kothari, 2004).
The population comprised 76 teachers and 201
students of higher education courses of IFRO -
Campus Vilhena. The choice of this institution was
based on the convenience and judgment of the
researcher; therefore, it was not probabilistic. A
simple random sample technique was used since the
questionnaire was sent to all individuals in the
population. Therefore, each subject had an equal
opportunity to be included in the sample (Prodanov,
2013).
Data were analysed by applying descriptive
statistical techniques using IBM SPSS Statistics (v.
26).
Teachers’ and Students’ Perception Regarding the Use of Moodle
525
4 RESULTS
4.1 Sample Characterisation
The final sample consisted of 144 (n = 144) valid
questionnaires, 44 from teachers and 100 from
students, corresponding to a net response rate of
57.89% and 49.75%, respectively. The total net
response rate was 51,99%
4.2 Teachers' Characterisation
The percentage of male teacher respondents was
65.9%, while only 34.1% were female. As for the age
group, teachers aged between 36 and 45 comprised
40.9% of the sample, followed by teachers aged
between 26 and 35 (34.1%). Concerning their higher
education background, 50% of the teachers hold a
licentiate degree, followed by 34.1% who hold a
bachelor's degree. About post-graduate degrees,
45.5% of the respondents hold a Master's degree, and
only 25% of the teachers hold a PhD. Regarding the
length of time working as a teacher, most teachers
(52.3%) have more than eleven years of experience.
Finally, only 2.3% of the teachers consider they have
insufficient mastery in ICT use. We also investigated
which Moodle resources and activities are most used
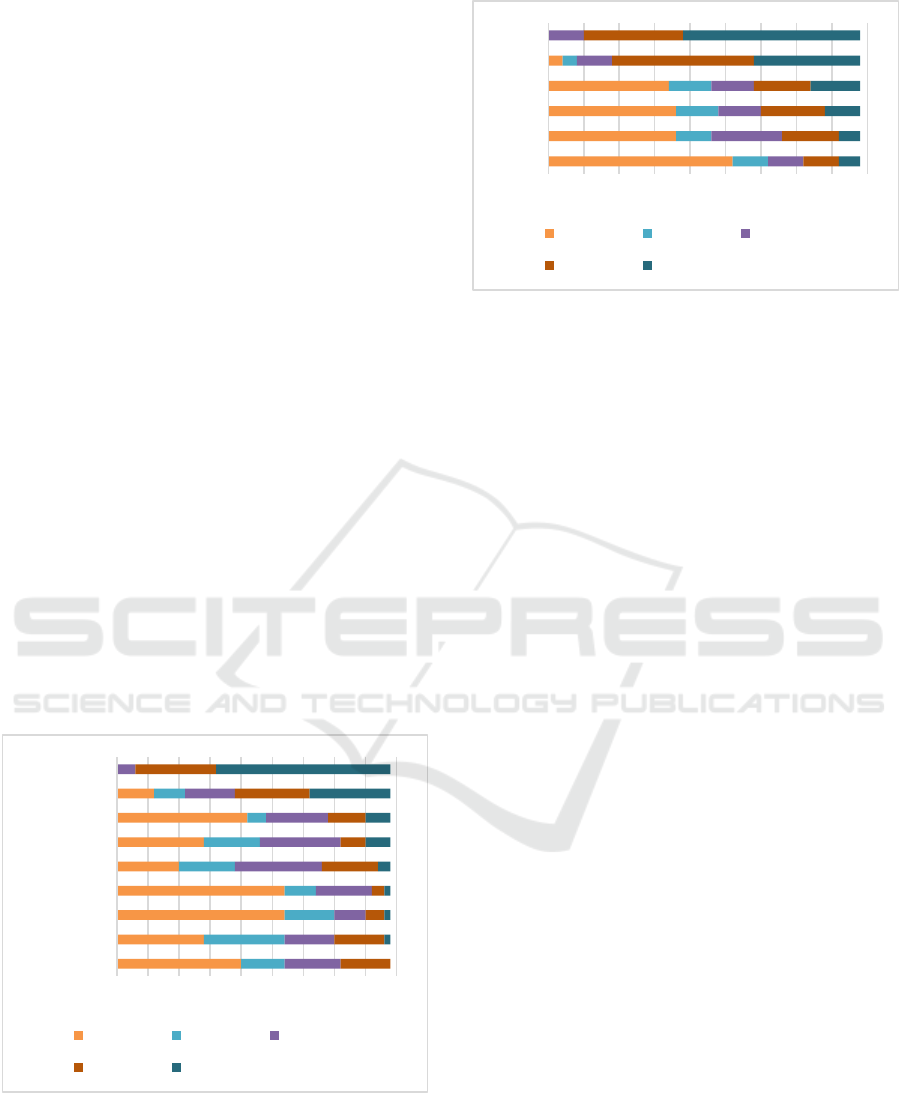
by teachers. According to the results illustrated in
Figure 1, the most frequently used activities are
assignment and quiz. Most teachers never or rarely
used glossary, workshop, and database activities.
Figure 1: Activities.
As illustrated in Figure 2, the most frequently
used resources are file and URL. Notably, book is the
resource used less frequently by most teachers.
Figure 2: Resources.
4.3 Students' Characterisation
As for the students, there was a higher representation
of women, totalling 67% of the sample. Regarding
marital status, most (63%) were single, while only
29% were married. Regarding occupation, 50% of the
respondents did not work. As to the age group,
respondents aged 18 to 25 formed the majority,
comprising 61% of the sample. Only 3% of the
respondents considered they had insufficient mastery
of ICT use. Finally, 46% of students used Moodle
daily, and 44% used Moodle a few times a week.
4.4 Teachers' and Students'
Perceptions on using Moodle
To verify whether teachers and students have a
negative or a positive perception of the five
considered variables, an analysis of the frequency of
teachers' and students' responses to the statements
that make up each variable was carried out.
Considering the scale used, the answers in levels 1
and 2 (Strongly Disagree (SD) and Disagree (D),
respectively) indicate a negative perception; the
answers in levels 4 and 5 (Agree (A) and Strongly
Agree (SA), respectively) indicate a positive
perception; and the answers in level 3 (N) indicate
neutrality or indecision.
The results of the frequency analysis of
teachers' answers (Table 2) show that most teachers
positively evaluated the quality of information
(48.5%), perceived ease of use (57.2%), perceived
usefulness (53.8%), user satisfaction (65.2%) and
intention to continue using (78.8%).
0 5 10 15 20 25 30 35 40 45
Database
Chat
Glossary
Workshop
Forum
Choice
Lesson
Quis
Assignment
Never Seldom Sometimes
Frequently Always
0 5 10 15 20 25 30 35 40 45
Book
Folder
Page
Label
URL
File
Never Seldom Sometimes
Frequently Always
A2E 2022 - Special Session on Analytics in Educational Environments
526

Table 2: Frequency and Percentage of Teachers’ Answers.
Item SD D N A SA Mean Median Mode
QI1 6 (13,6%) 8 (18,2%) 7 (15,9%) 19 (43,2%) 4 (9,1%) 3,16 4 4
QI2 7 (15,9%) 9 (20,5%) 9 (20,5%) 16 (36,4%) 3 (6,8%) 2,98 3 4
QI3 1 (2,3%) 5 (11,4%) 9 (20,5%) 24 (54,5%) 5 (11,4%) 3,61 4 4
QI4 0 (0,0%) 6 (13,6%) 10 (22,7%) 25 (56,8%) 3 (6,8%) 3,57 4 4
QI5 2 (4,5%) 12 (27,3%) 15 (34,1%) 12 (27,3%) 3 (6,8%) 3,05 3 3
QI6 1 (2,3%) 15 (34,1%) 14 (31,8%) 12 (27,3%) 2 (4,5%) 2,98 3 2
QI 17 (6,4%) 55 (20,8%) 64 (24,2%) 108 (40,9%) 20 (7,6%) - - -
PEOU1 1 (2,3%) 10 (22,7%) 3 (6,8%) 18 (40,9%) 12 (27,3%) 3,68 4 4
PEOU2 1 (2,3%) 15 (34,1%) 10 (22,7%) 12 (27,3%) 6 (13,6%) 3,16 3 2
PEOU3 1 (2,3%) 5 (11,4%) 11 (25,0%) 22 (50,0%) 5 (11,4%) 3,57 4 4
PEOU4 1 (2,3%) 9 (20,5%) 11 (25,0%) 19 (43,2%) 4 (9,1%) 3,36 4 4
PEOU5 0 (0,0%) 11 (25,0%) 9 (20,5%) 15 (34,1%) 9 (20,5%) 3,50 4 4
PEOU6 1 (2,3%) 9 (20,5%) 5 (11,4%) 24 (54,5%) 5 (11,4%) 3,52 4 4
PEOU 5 (1,9%) 59 (22,3%) 49 (18,6%) 110 (41,7%) 41 (15,5%) - - -
PU1 4 (9,1%) 9 (20,5%) 10 (22,7%) 17 (38,6%) 4 (9,1%) 3,18 3 4
PU2 4 (9,1%) 6 (13,6%) 10 (22,7%) 18 (40,9%) 6 (13,6%) 3,36 4 4
PU3 5 (11,4%) 7 (15,9%) 9 (20,5%) 18 (40,9%) 5 (11,4%) 3,25 4 4
PU4 4 (9,1%) 6 (13,6%) 15 (34,1%) 14 (31,8%) 5 (11,4%) 3,23 3 3
PU5 3 (6,8%) 12 (27,3%) 10 (22,7%) 14 (31,8%) 5 (11,4%) 3,14 3 4
PU6 1 (2,3%) 3 (6,8%) 4 (9,1%) 26 (59,1%) 10 (22,7%) 3,93 4 4
PU 21 (8,0%) 43 (16,3%) 58 (22,0%) 107 (40,5%) 35 (13,3%) - - -
US1 3 (6,8%) 4 (9,1%) 3 (6,8%) 31 (70,5%) 3 (6,8%) 3,61 4 4
US2 2 (4,5%) 8 (18,2%) 7 (15,9%) 21 (47,7%) 6 (13,6%) 3,48 4 4
US3 4 (9,1%) 11 (25,0%) 4 (9,1%) 22 (50,0%) 3 (6,8%) 3,20 4 4
US 9 (6,8%) 23 (17,4%) 14 (10,6%) 74 (56,1%) 12 (9,1%) - - -
BI1 1 (2,3%) 3 (6,8%) 4 (9,1%) 26 (59,1%) 10 (22,7%) 3,93 4 4
BI2 0 (0,0%) 1 (2,3%) 10 (22,7%) 22 (50,0%) 11 (25,0%) 3,98 4 4
BI3 0 (0,0%) 5 (11,4%) 4 (9,1%) 22 (50,0%) 13 (29,5%) 3,98 4 4
BI 1 (0,8%) 9 (6,8%) 18 (13,6%) 70 (53,0%) 34 (25,8%) - - -
Notes: Quality of Information (QI); Perceived Ease Of Use (PEOU); Perceived Usefulness (PU); User Satisfaction (US);
Behavioral Intention to use (BI). Strongly Disagree (SD); Disagree (D); Neutral or Uncertain (N);
Agree (A); Strongly
Agree (SA).
In addition, most of the items that make up each
of the variables have a mean, median and mode above
3, which also indicates a positive perception. Despite
having the same mean (2.98, below 3, thus
corresponding to a negative perception), items QI2
and QI6 have different modes, revelling different
perceptions. Analysing each item individually, we
observed that the item QI2 has a mean of 2.98,
however, a mode of 4, which reveals a positive
perception of most teachers regarding the ease of
navigation through Moodle.
Item QI6 has a mean of 2.98 and a mode of 2,
which indicates a negative perception of most
teachers about Moodle to offer information that is
easy to be understood. Item PEOU2 (I find it easy for
Moodle to do what I want it to do), despite having a
mean of 3.16, has a mode of 2, which shows that most
teachers had a negative perception about this item.
Teachers’ and Students’ Perception Regarding the Use of Moodle
527

The items PU6 and BI1 had proportionally the highest
level of agreement (81.8%) from the teachers,
followed by BI3 (79.5%), US1 (77.3%) and BI2
(75%). QI5 and PU4 obtained the highest number of
neutral or undecided answers (34.1%). QI2, QI6 and
PEOU2 had the highest discordant answers (36.4%),
followed by US3 and PU5 (34.1%).
Similarly, the results of the frequency analysis of
student responses (Table 3) indicate that most
students also positively evaluated the items related to
information quality (48.8%), perceived ease of use
(66.3%), perceived usefulness (63.2%), user
satisfaction (59.4) and intention to continue using
(57.7%). All items that make up each of the variables
had a mean, median and mode above 3.
Table 3: Frequency and Percentage of Students’ Answers.
Item SD D N A SA Mean Median Mode
QI1 8 (8%) 16 (16%) 39 (39%) 30 (30%) 7 (7%) 3,12 3 3
QI2 8 (8%) 14 (14%) 34 (34%) 28 (28%) 16 (16%) 3,30 3 3
QI3 3 (3%) 12 (12%) 26 (26%) 42 (42%) 17 (17%) 3,58 4 4
QI4 5 (5%) 6 (6%) 30 (30%) 41 (41%) 18 (18%) 3,61 4 4
QI5 5 (5%) 15 (15%) 32 (32%) 36 (36%) 12 (12%) 3,35 3 4
QI6 5 (5%) 13 (13%) 36 (36%) 32 (32%) 14 (14%) 3,37 3 3
QI 34 (5,7%) 76 (12,7%) 197 (32,8%) 209 (34,8%) 84 (14,0%) - - -
PEOU1 0 (0%) 6 (6%) 10 (10%) 61 (61%) 23 (23%) 4,01 4 4
PEOU2 1 (1%) 7 (7%) 23 (23%) 54 (54%) 15 (15%) 3,75 4 4
PEOU3 2 (2%) 18 (18%) 31 (31%) 41 (41%) 8 (8%) 3,35 3 4
PEOU4 1 (1%) 9 (9%) 26 (26%) 52 (52%) 12 (12%) 3,65 4 4
PEOU5 3 (3%) 12 (12%) 23 (23%) 56 (56%) 6 (6%) 3,50 4 4
PEOU6 2 (2%) 9 (9%) 19 (19%) 53 (53%) 17 (17%) 3,74 4 4
PEOU 9 (1,5%) 61 (10,2%) 132 (22,0%) 317 (52,8%) 81 (13,5%) - - -
PU1 2 (2%) 5 (5%) 20 (20%) 59 (59%) 14 (14%) 3,78 4 4
PU2 2 (2%) 10 (10%) 27 (27%) 50 (50%) 11 (11%) 3,58 4 4
PU3 2 (2%) 15 (15%) 34 (34%) 39 (39%) 10 (10%) 3,40 3 4
PU4 5 (5%) 12 (12%) 41 (41%) 33 (33%) 9 (9%) 3,29 3 3
PU5 3 (3%) 4 (4%) 11 (11%) 62 (62%) 20 (20%) 3,92 4 4
PU6 2 (2%) 7 (7%) 19 (19%) 55 (55%) 17 (17%) 3,78 4 4
PU 16 (2,7%) 53 (8,8%) 152 (25,3%) 298 (49,7%) 81 (13,5%) - - -
US1 3 (3%) 9 (9%) 33 (33%) 49 (49%) 6 (6%) 3,46 4 4
US2 4 (4%) 12 (12%) 25 (25%) 50 (50%) 9 (9%) 3,48 4 4
US3 3 (3%) 13 (13%) 20 (20%) 56 (56%) 8 (8%) 3,53 4 4
US 10 (3,3%) 34 (11,3%) 78 (26,0%) 155 (51,7%) 23 (7,7%) - - -
BI1 2 (2%) 11 (11%) 19 (19%) 59 (59%) 9 (9%) 3,62 4 4
BI2 2 (2%) 16 (16%) 30 (30%) 45 (45%) 7 (7%) 3,39 4 4
BI3 3 (3%) 13 (13%) 31 (31%) 43 (43%) 10 (10%) 3,44 4 4
BI 7 (2,3%) 40 (13,3%) 80 (26,7%) 147 (49,0%) 26 (8,7%) - - -
Notes: Quality of Information (QI); Perceived Ease Of Use (PEOU); Perceived Usefulness (PU); User Satisfaction
(US); Behavioral Intention to use (BI). Strongly Disagree (SD); Disagree (D); Neutral or Uncertain (N);
Agree (A);
Strongly Agree (SA).
A2E 2022 - Special Session on Analytics in Educational Environments
528

The item PEOU1 presented proportionally the
highest number of agreeing to answers (84%) among
the students, followed by PU5 (82%) and PU1 (73%).
The statement PU4 had the highest number of neutral
or undecided answers (41%). QI1 and QI2 had the
highest number of answers with disagreements (24%
and 22%, respectively).
5 DISCUSSION
The results of the frequency analysis, performed with
IBM SPSS Statistics, showed that although only 2.3%
of the teachers considered that they had insufficient
mastery in the use of ICT, most of the activities and
resources in Moodle are never or rarely used. The
results indicated that assignment and quiz were the
most used activities. This finding confirms the results
of Badia et al. (2019). In contrast, the study of Batista
(2016) showed that forum is the most used activity,
followed by assignment, with quiz appearing only in
the third position. Regarding resources, our results
showed that file and URL are the most used ones,
partially contrasting with the findings of Badia et al.
(2019). As seen, the findings do not follow a
uniformity, which may indicate that the choice of
which resource to use may be associated with the type
of course, the profile of the teacher, the objectives of
the curricular unit and the domain of the teacher with
respect to the use of the resources provided by
Moodle.
The frequency analysis of the participants'
answers showed that, in general, the PEOU variable
stood out as the best evaluated by students, followed
by PU, US and BI. Regarding the teaching staff, the
items referring to the BI variable had the most
positive evaluations, followed by US, PEOU and PU.
These results show a positive perception of students
and teachers regarding the ease of use and usefulness
of Moodle, besides demonstrating that users are
satisfied and intend to continue using Moodle,
supporting the findings of previous studies (Carvalho
Neto, 2009; Chiu et al., 2005; Pereira et al., 2015).
However, despite also having a positive assessment,
the QI variable had the worst performance compared
to the other variables due to many neutral/uncertain
answers. This result may indicate that the statements
were not clear enough and thus generated doubts in
the participants, which suggests that an improvement
for these items should be considered.
6 CONCLUSION
In addition to contributing to the formation of
knowledge about the perception of students and
teachers about the factors that influence the
satisfaction and intention to continue using Moodle as
VLE to support classroom teaching in undergraduate
courses in IFRO - Campus Vilhena, this study also
allowed participants to express their opinions about
the use of this platform.
The results of the descriptive analysis reflect a
positive perception of teachers and students regarding
the ease of use and usefulness of Moodle, besides
evidencing that users are satisfied and intend to
continue using Moodle. Despite this, most activities
and resources available in Moodle are never or rarely
used by teachers. Thus, the educational institution
should define strategies to monitor the specific needs
of each teacher and, based on the teaching and
learning objectives of each curricular unit, promote
training actions to maximise the use of all resources
and Moodle activities.
These findings may be useful for researchers and
professionals in the area, by providing information
that can contribute to the management and
incremental improvement of the use of Moodle, as
support for classroom teaching. Besides providing
subsidies for the planning of pedagogical actions,
contributing to the improvement of the teaching and
learning process.
Furthermore, institutions should conduct periodic
surveys with users to identify problems and
limitations and thus seek continuous improvement in
Moodle use. Thus, this research is expected to be a
driver for further research aimed at analysing users'
perceptions regarding the use of Moodle in the
institution.
Although the results are encouraging and helpful,
the present study, like any research, has its limitations
that require future research.
The sample studied is limited to students and
teachers of undergraduate courses of only one public
educational institution, so the results cannot be
generalised. Thus, we suggest that future research
study and compare larger populations from different
levels of education (primary, secondary, technical,
undergraduate and post-graduate) of public and
private institutions.
The fact that this study was conducted in a period
of remote classes due to the Covid-19 pandemic
should also be considered, as this condition may have
affected the participants' perceptions. Furthermore,
responses to this study were voluntary and, therefore,
inevitably subject to self-selection variance.
Teachers’ and Students’ Perception Regarding the Use of Moodle
529

Finally, the participants' responses represent
cross-sectional data, i.e., measuring users'
perceptions at a single point in time. Hence,
perceptions may change with increasing user
experience over time. Thus, additional longitudinal
studies are recommended.
The study of the linear causal relationships among
the latent variables of the model obtained from the
integration of TAM and IS Success Models, through
the use of Structural Equation Modeling analysis, is
also planned to be implemented in the near future.
ACKNOWLEDGEMENT
This work is financed by portuguese national funds
through FCT - Fundação para a Ciência e Tecnologia,
under the project UIDB/05422/2020
REFERENCES
Al-Fraihat, D., Joy, M., Masa'deh, R., & Sinclair, J. (2020).
Evaluating E-learning systems success: An empirical
study. Computers in Human Behavior, 102, 67–86.
https://doi.org/10.1016/j.chb.2019.08.004
Badia, A., Martín, D., & Gómez, M. (2019). Teachers'
Perceptions of the Use of Moodle Activities and Their
Learning Impact in Secondary Education. Technology,
Knowledge and Learning, 24(3), 483–499.
https://doi.org/10.1007/s10758-018-9354-3
Batista, S. A. D. da S. (2016). Fatores determinantes na
adoção e uso continuado da plataforma Moodle numa
instituição de ensino superior [Dissertação (Mestrado
em Educação), Universidade de Lisboa].
https://repositorio.ul.pt/handle/10451/22686
Bedregal-Alpaca, N., Cornejo-Aparicio, V.,
Tupacyupanqui-Jaén, D., Flores-Silva, S., Bedregal-
Alpaca, N., Cornejo-Aparicio, V., Tupacyupanqui-Jaén,
D., & Flores-Silva, S. (2019). Evaluación de la
percepción estudiantil en relación al uso de la plataforma
Moodle desde la perspectiva del TAM. Ingeniare.
Revista Chilena de Ingeniería, 27(4), 707–718.
https://doi.org/10.4067/S0718-33052019000400707
Cardoso, G. D. S. (2016). O ambiente virtual de ensino e
aprendizagem: Aplicação da plataforma Moodle no
ensino presencial. 95.
Carvalho Neto, S. (2009). Dimensões de qualidade em
ambientes virtuais de aprendizagem [Tese (Doutorado
em Administração), Universidade de São Paulo - USP].
https://doi.org/10.11606/T.12.2009.tde-02022010-
123846
Chiu, C.-M., Hsu, M.-H., Sun, S.-Y., Lin, T.-C., & Sun, P.-
C. (2005). Usability, quality, value and e-learning
continuance decisions. Computers & Education, 45(4),
399–416. https://doi.org/10.1016/j.compedu.2004.
06.001
Cidral, W. A., Oliveira, T., Di Felice, M., & Aparicio, M.
(2018). E-learning success determinants: Brazilian
empirical study. Computers & Education, 122, 273–
290. https://doi.org/10.1016/j.compedu.2017.12.001
Costa, C., Alvelos, H., & Teixeira, L. (2017). Acceptance
of Moodle by professors: A study in a Portuguese
Higher Education Institution. Atas Da Conferência Da
Associação Portuguesa de Sistemas de Informação,
16(16), 278-285–285. https://doi.org/10.18803/capsi.
v16.278-285
Dağhan, G., & Akkoyunlu, B. (2016). Modeling the
continuance usage intention of online learning
environments. Computers in Human Behavior, 60,
198–211. https://doi.org/10.1016/j.chb.2016.02.066
Davis, F. D. (1989). Perceived Usefulness, Perceived Ease
of Use, and User Acceptance of Information
Technology. MIS Quarterly, 13(3), 319–340.
https://doi.org/10.2307/249008
Davis, F. D., Bagozzi, R. P., & Warshaw, P. R. (1989). User
Acceptance of Computer Technology: A Comparison
of Two Theoretical Models. Management Science,
35(8), 982–1003.
DeLone, W. H., & McLean, E. R. (1992). Information
Systems Success: The Quest for the Dependent
Variable. Information Systems Research, 3(1), 60–95.
https://doi.org/10.1287/isre.3.1.60
DeLone, W. H., & McLean, E. R. (2003). The DeLone and
McLean Model of Information Systems Success: A
Ten-Year Update. Journal of Management Information
Systems, 19(4), 9–30. https://doi.org/10.1080/
07421222.2003.11045748
Kothari, C. R. (2004). Research Methodology: Methods
and Techniques. New Age International Pvt. Ltd.,
Publishers.
Moodle. (2020). Moodle. Moodle. https://moodle.com/pt/
Pereira, F. A. de M., Ramos, A. S. M., & das Chagas, M.
M. (2015). Satisfação e continuidade de uso em um
ambiente virtual de aprendizagem. REGE - Revista de
Gestão, 22(1), 133–153. https://doi.org/10.5700/
rege555
Prodanov, C. C. (2013). Metodologia do trabalho
científico: Métodos e Técnicas da Pesquisa e do
Trabalho Acadêmico (2nd ed.). FEEVALE.
Roca, J. C., Chiu, C.-M., & Martínez, F. J. (2006).
Understanding e-learning continuance intention: An
extension of the Technology Acceptance Model.
International Journal of Human-Computer Studies,
64(8), 683–696. https://doi.org/10.1016/j.ijhcs.
2006.01.003
Rodrigues, S. M. (2020). A Utilização de Recursos e
Atividades do Moodle por Parte de Docentes do Ensino
Superior Politécnico: Progresso ou Estagnação? -
Estudo de caso. Revista Ibérica de Sistemas e
Tecnologias de Informação, E31, 480–496.
Sebastião, A. P. F. (2015). A utilização do ambiente virtual
de aprendizagem Moodle em uma instituição de ensino
superior pública. Revista Profissão Docente, 15(32),
131–139. https://doi.org/10.31496/rpd.v15i32.838
Sobreira, L. (2013, March 6). Vivências de Alunos e
Professores no Uso da Plataforma Moodle como
A2E 2022 - Special Session on Analytics in Educational Environments
530

Complemento às Aulas Presenciais de Química para o
1
o
Ano do Ensino Médio: Um Estudo de Caso
[MasterThesis]. http://dspace.uevora.pt/rdpc/handle/
10174/11157
Šumak, B., Heričko, M., & Pušnik, M. (2011). A meta-
analysis of e-learning technology acceptance: The role
of user types and e-learning technology types.
Computers in Human Behavior, 27(6), 2067–2077.
https://doi.org/10.1016/j.chb.2011.08.005
UBC Computer Scientist Wins $100,000 Award for Popular
Course Software. (2004, September 27). UBC News.
https://news.ubc.ca/2004/09/27/archive-media-
releases-2004-mr-04-103/
Venkatesh, V., & Davis, F. D. (2000). A Theoretical
Extension of the Technology Acceptance Model: Four
Longitudinal Field Studies. Management Science,
46(2), 186–204. https://doi.org/10.1287/mnsc.46.2.
186.11926
Venkatesh, V., Morris, M. G., Davis, G. B., & Davis, F. D.
(2003). User Acceptance of Information Technology:
Toward a Unified View. MIS Quarterly, 27(3), 425–
478. JSTOR. https://doi.org/10.2307/30036540
Wang, H. C., & Chiu, Y. F. (2011). Assessing e-learning
2.0 system success. Computers & Education, 57(2),
1790–1800. https://doi.org/10.1016/j.compedu.2011.
03.009
APPENDIX
Survey Items
Code Statement Adapted from
Perceived Ease Of Use (PEOU)
PEOU1 Learning to use Moodle is easy for me. (Davis, 1989; Roca et al., 2006)
PEOU2 I find it eas
y
for Moodle to do what I want it to do.
(
Davis, 1989
)
PEOU3 M
y
interaction with Moodle is clear and understandable.
(
Davis, 1989; Roca et al., 2006
)
PEOU4 I find interactin
g
with Moodle flexible
(
Davis, 1989
)
PEOU5 It is easy for me to become skilled in using Moodle. (Davis, 1989; Roca et al., 2006)
PEOU6 Overall, I find Moodle easy to use. (Davis, 1989; DeLone & McLean, 2003)
Perceived Usefulness (PU)
PU1 Usin
g
Moodle allows me to
g
et tasks done more
q
uickl
y
.
(
Davis, 1989; Venkatesh & Davis, 2000
)
PU2
Using Moodle improves my performance at work. (Teachers)
Using Moodle improves my academic performance. (Students)
(Davis, 1989; Roca et al., 2006)
PU3 Usin
g
Moodle increases m
y
p
roductivit
y
.
(
Davis, 1989
)
PU4
Use of Moodle increases my effectiveness at work. (Teachers)
Using Moodle increases my learning effectiveness. (Students)
(Davis, 1989; Roca et al., 2006)
PU5
The use of Moodle facilitates my work. (Teachers)
Using Moodle, it is easier to follow and study the course material.
(Students)
(Davis, 1989)
PU6
Overall, I find Moodle useful for my work. (Teachers)
Overall, I fin
d
Moodle useful for my learning. (Students)
(Davis, 1989; Roca et al., 2006)
Quality of Information (QI)
QI1 Moodle's la
y
out and user interface are user friendl
y
.
(Chiu et al., 2005; Pereira et al., 2015)
QI2 Moodle is eas
y
to navi
g
ate around.
QI3 Moodle offers the resources I need.
QI4 I feel comfortable using the resources offered by Moodle.
QI5 Moodle offers comprehensive information.
QI6 Moodle offers information that is easy to understand.
User Satisfaction (US)
US1
I am satisfied with the experience of using Moodle. (Chiu et al., 2005; Dağhan & Akkoyunlu,
2016)
US2
I am satisfied with Moodle's performance. (Al-Fraihat et al., 2020; Chiu et al., 2005;
Da
ğ
han & Akko
y
unlu, 2016
)
US3 Moodle meets my educational needs. (Al-Fraihat et al., 2020)
Behavioral intention to use (BI)
BI1
I intend to continue using Moodle frequently. (Teachers)
I intend to use Moodle in my studies often. (Students)
(Chiu et al., 2005; Venkatesh et al., 2003)
BI2
I anticipate that I will continue to use Moodle in my daily life.
(Teachers)
I anticipate that I will use Moodle in my day to day studies.
(
Students
)
Teachers’ and Students’ Perception Regarding the Use of Moodle
531

Code Statement Ada
p
ted from
BI3
I have plans to continue using Moodle in the future. (Teachers)
I have
p
lans to use Moodle in m
y
studies in the future.
(
Students
)
A2E 2022 - Special Session on Analytics in Educational Environments
532
