
Financial Feasibility of Opaque Envelopes in ECBC Complaint
Energy Efficient Indian Commercial Buildings: An Approach
for Maximising the Internal Rate of Return
Pranav Kishore
1
, Stuthi Shetty
1
, Bysani Sathwik
1
, Nandhini Selvam
2
, Vaibhav Jain
1
and Pradeep Kini
2
1
Centre of Sustainable Built Environment, Manipal School of Architecture and Planning,
Manipal Academy of Higher Education, Manipal, India
2
Manipal School of Architecture and Planning, Manipal Academy of Higher Education, Manipal, India
Keywords: Architecture Optimization, Internal Rate of Return, Energy Saving, Building Code, Energy Policy, Green
Building.
Abstract: Buildings are one of the major contributors to energy consumption and Green House Gas emissions. To
regulate harmful emissions the government is trying its best to overcome these problems by enforcing energy
conservation codes and rating systems for buildings in India. The developers and the investors of project are
more interested in the profit. The Internal Rate of Return of a project supports the selection of the project,
which is widely used worldwide. This study has been conducted to optimize the Internal Rate of Return (IRR)
to find out the best opaque wall section in the warm and humid climate of India with Energy Conservation
Building Code (ECBC) compliance, using wall thermal transmittance values as the constraints to control the
energy consumption within buildings. This will lead to the reduction electricity demand contributing towards
a mitigating the climate change and also to gain profit for the investors by annual energy savings from
sustainable commercial buildings. This study estimates an 18% to 40% IRR from the commercial building by
conforming with ECBC benchmarks.
1 INTRODUCTION
The world is undergoing a serious issue related to
climate change and buildings are one of the
contributors. The greenhouse gas emissions
especially, Carbon dioxide emissions have led to an
increase in the global surface temperature, which
results in an increase of the mean sea level due to the
melting of glaciers, thus harming the environment
that we live in. Global surface temperatures have
exceedingly increased over the last decade (2011-
2020) concerning 6500 years ago ranging from 0.2
0
C
to 1
0
C and now even further according to The
Intergovernmental Panel on Climate Change (IPCC)
report (IPCC). In the year 2015, the United Nations
adopted The 2030 Agenda for Sustainable
development which has a total of 17 goals called the
Sustainable Development Goals (SDGs), an urgent
call for action for all countries, which results in global
development while tackling climate change to
preserve the current environment (Nations, n.d.).
Among these 17 SDGs 4 of the goals (affordable and
clean energy, industry, innovation, and infrastructure,
sustainable cities and communities, responsible
consumption and production) are directly or
indirectly linked to the building sector. As
responsible architects, they must reduce the negative
impact on the climate and maximize the profit of
stakeholder or investor over the buildings for
whoever is requiring to help. On global level, the
building sector has become one of the major sources
of CO
2
emissions. Efforts are being made to develop
a more sustainable environment (Jiang, Liu,
Czarnecki, & Zhang, 2019). Everything started with
the United Nations Framework for Convention on
Climate Change (UNFCCC), introduced by United
Nations in 1992. The ultimate objective of UNFCCC
is to stabilize the greenhouse gases in the atmosphere
at a level which resulted in the formation of the
United States Green Building Council (USGBC) and
Leadership in Energy and Environmental Design
(LEED) – a Green building rating system.
Scientific literature shows that even if the most
aggressive mitigation measures are successful, we
130
Kishore, P., Shetty, S., Sathwik, B., Selvam, N., Jain, V. and Kini, P.
Financial Feasibility of Opaque Envelopes in ECBC Complaint Energy Efficient Indian Commercial Buildings: An Approach for Maximising the Internal Rate of Return.
DOI: 10.5220/0011114300003206
In Proceedings of the 4th International Conference on Finance, Economics, Management and IT Business (FEMIB 2022), pages 130-139
ISBN: 978-989-758-567-8; ISSN: 2184-5891
Copyright
c
2022 by SCITEPRESS – Science and Technology Publications, Lda. All rights reserved

can expect climate-related changes, such as
increasing temperatures over the next 30 years (Aijazi
& Brager, 2018). In the total GHG emissions 16% of
the emissions are due to embodied energy and the
remaining 86% is because of the operation of the
systems (Filippin, Larsen, & Ricard, 2018). So, it is
required to reflect on the operational energy
consumption, which leads to the price of the total
energy consumed. There is a spike of 29.2% increase
in the Energy Performance Index of the buildings i.e.
60 KWh/Sq.m per year to 78 KWh/Sq.m per year
(Gercek & Arsan, 2019).
India is responsible for 8% of the total GHG
emission (IPCC). The building sector in India is
accountable for 35% of the summed up energy
consumption and the energy use is increasing at the
rate of 8% (Khosla & Janda, 2019). To deal with
climate change, the Indian government introduced the
Energy Protection Act in 2001 which also oversees
the Bureau of Energy Efficiency (BEE) in its
framework. The BEE introduced the Energy
Conservation Building Code (ECBC) in the year
2007. Various Initiatives were taken by the
Government of India like National Building policies,
Smart city initiatives, building codes, and rating
systems to incorporate Energy Efficiency and to set
new benchmarks for building performance (Garg,
Kumar, Pipralia, & Garg, 2018).
A study conducted by Kishore N says that five
cities under all climate zones in India according to
National Building Code (NBC) were analyzed which
resulted in a temperature rise of 3.7-4.2 °C in the
future. The study propounds that there is a significant
overall increase in the energy load ranging from 18%
to 89% in 2020, 32% to 132% in 2050, and 85% to-
184% in 2080 if the residential buildings are operated
in the same manner. The use of passive strategies may
reduce the load by 50% to 60% in the future (Kishore,
2021).
Green building technology can be promoted by
strengthening the policy and incentive system.
Special training for employees, awareness towards
technological innovation, and an approach towards
integrated design application act as direct driving
forces towards Green Building Implementation
(Zhang, et al., 2019).
1.1 Technical Challenges
In the year 2002, India started the Green building
movement in India. In the following years, ECBC
was enforced which set benchmark constraints for the
building construction. The reference building model
developed by Bhatnagar Et al. performs better in the
Energy Performance Index than just the guidelines
from ECBC and ECBC+ in all the five climate zones
of India as per National Building Code (NBC), due to
the market transformation to LEDs. But, the envelope
in the reference buildings are inefficient due to the
higher cost of insulations (Bhatnagar, Mathur, & Garg,
2019). On the contrary, the study in this paper will help
to deal with the envelope. Many benchmarks and
standards have been defined for the Indian context but
the implementation needs reinforcement (Sharma,
2018). India has different climate zones and needs
different types of buildings, hence no single code
applies in the same manner to all these situations.
1.2 Financial Challenges
Higher occupancy generates higher demand for
electricity, causing a hike in energy loads leading to
energy poverty, especially in highly populated areas
in India. To tackle the energy poverty issue in India
the government has enforced policies such as the
Electricity Act of 2003, the National Electricity policy
of 2005, and so on with the agenda to expand electricity
supply, especially to rural areas which have resulted in
a considerable decline in energy poverty across the
country. Multi-dimensional energy poverty index and
district-level information are examined to estimate the
extent of energy poverty at a place (Sadath & Acharya,
2018). Also, for every building implementing
sustainability, the buyer has to pay a premium price
and the gap between the buyer's willingness to pay and
the cost of sustainable building imposes an economic
challenge, hence both these issues have to be
negotiated. Finally, the public views that the
construction industry and buyers are focused on short-
term benefits and not convincingly invested in the
concept of sustainability and hence withdraw their idea
of accepting change (Hoxha & Shala, 2019).
2 BACKGROUND STUDY
The reference building model of India states that the
cooling load of commercial buildings ranges from
16% to 28% based on the typology and occupational
hours of the building (Bhatnagar, Mathur, & Garg,
2019). The heat in the building can be cooled with
many strategies in which HVAC systems like VAV
and VRF systems are used which consume electricity.
The electricity demand is increasing every day. In
India, 56% of the electricity is generated by coal fired
power plants which release the highest amount of
CO
2
emissions into the atmosphere when compared
to any other source (IEA, 2021). One of the
Financial Feasibility of Opaque Envelopes in ECBC Complaint Energy Efficient Indian Commercial Buildings: An Approach for
Maximising the Internal Rate of Return
131
approaches to reduce energy consumption within the
building is to reduce heat transfer into the building.
Studying the building life cycle and certain market
participants, it is identified that “going green” can be
financially feasible and also profitable over the life
span of the building. But, certain factors delay the
decision-making of the developers and occupants in
choosing to "go green", especially in terms of
economic viability (Zhang, Wu, & Liu, 2017).
Scope: Literature over the past decade show
experiments and case studies conducted for the
financial returns in buildings due to the higher
investments in construction. However, this extra
investment should have brought higher rental because
of the characteristics of the green buildings. But the
situation is complex because the financial benefits of
green building have not been accounted for. As such a
study has not been conducted which can establish a
relation between the financial benefit and energy
efficiency of green building in a rapidly developing
economy like that of India. So this study uses the
reference building model of India for commercial
buildings as a base case to understand the same. RBM
(Reference Building Model) has been simulated
against the building energy codes of India to calculate
the Internal Rate of Return using the financial savings
from the energy efficiency of the building and also
bringing the extra cost associated with the construction
of green buildings to understand the design decisions
by various professionals of AEC(Architecture,
Engineering, and Construction) industry.
3 METHODOLOGY
3.1 Energy Simulation
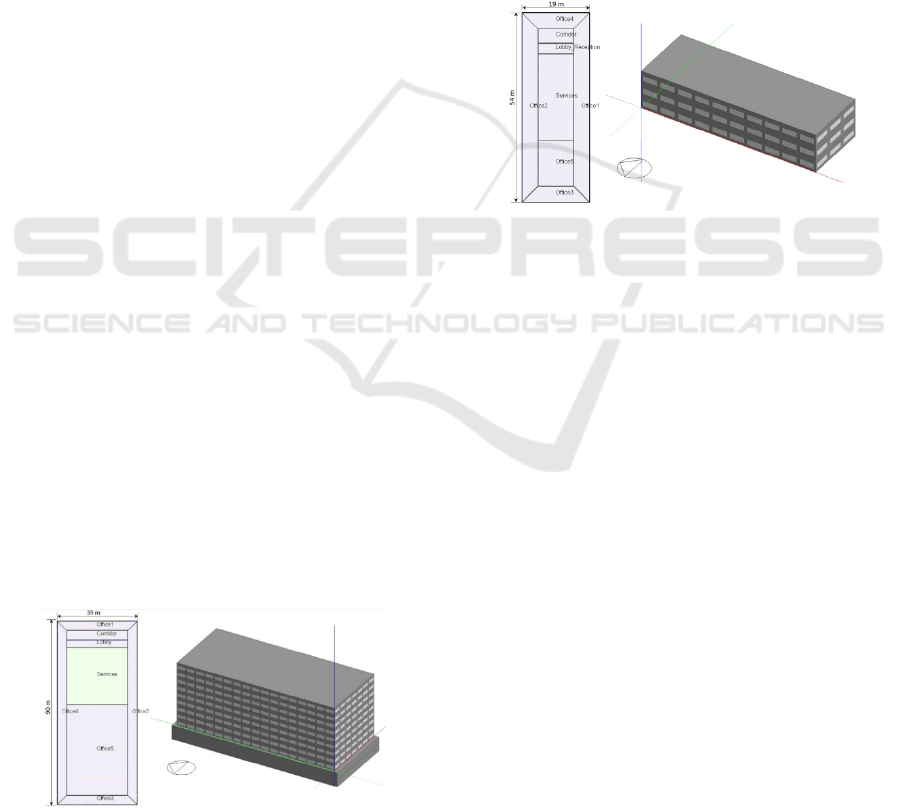
3.1.1 Reference Building Model (RBM)
The reference building model of India for commercial
buildings has been considered for the study. In the
RBM, the buildings were divided into 2 types
Figure 1: High-rise building model Image by: (Bhatnagar,
Mathur, & Garg, 2019).
based on, no. of floors and types of functional hours
in each building, – Low-rise -8hr, Low-rise – 24hr,
high-rise – 8hr and high-rise – 24hr. A total of 230
commercial buildings have been analyzed for the
RBM study. Indian climate zones are divided into five
types according to NBC 2006, however development
of Indian RBM is only for four climate zones
excluding cold climate zone. The RBM analysis is
based on various inputs such as form, envelope, loads,
and systems, along with certain general categories
like location, ventilation requirements, etc. The study
is a four-step process: 1. Identification of building
typologies, 2. Building parameters identification, 3.
Sample size and data collection, 4. Determining
values of building parameters. (Bhatnagar, Mathur,
& Garg, 2019).
Figure 2: Low-rise building model Image by: (Bhatnagar,
Mathur, & Garg, 2019).
Figures 1 and 2 show the reference building models
for high-rise and low-rise building typology
respectively.
3.1.2 Energy Performance Calculator
For this study the RBM in the Warm and humid
climate is modeled in the Energy Performance
Calculator (EPC). EPC is an Excel-based tool that can
be used to calculate the energy performance of a
building. It is developed by IMAGINE lab at the
Georgia Institute of Technology. EPC uses energy
plus weather files, systems in building like Lighting
systems and HVAC systems, Building Integrated
Energy Generation System, zones and their
occupancy, and building envelope details to calculate
Energy Performance Index (EPI).
3.1.3 Thermal Transmittance
The heat from the exterior spaces transmits to the
spaces through a building envelope which has
conductivity in it known as thermal conductivity.
Thermal transmittance is a function of the thermal
conductivity and thickness of the envelope material.
FEMIB 2022 - 4th International Conference on Finance, Economics, Management and IT Business
132
(1)
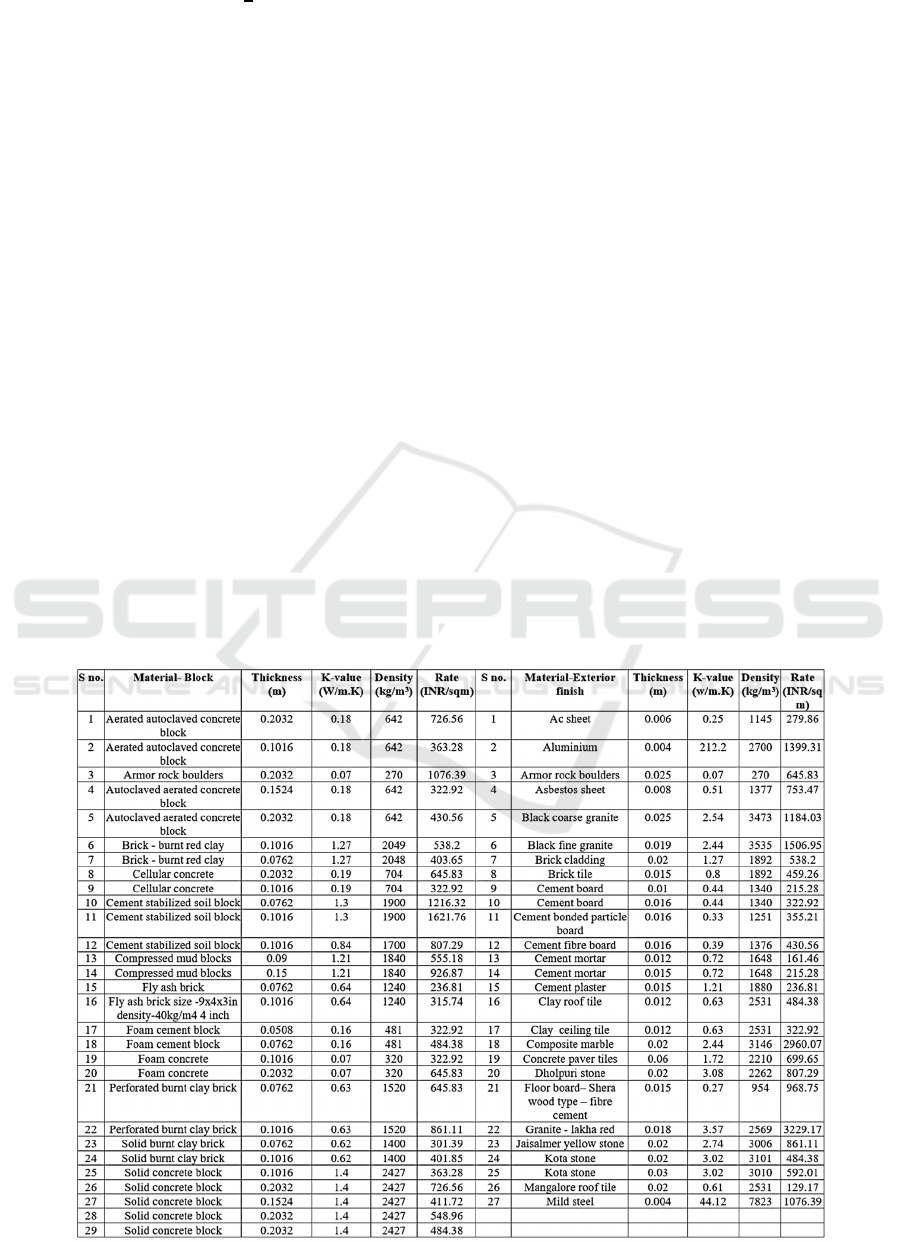
3.2 Material Data
Opaque wall materials are combined to make
different sections, which causes a change in the
thermal transmittance of the combined wall section.
The different materials for the exterior finish, interior
finish, and block are taken as the variables for the
materials. These materials are taken from
optimization-based feasibility analysis for ECBC for
different opaque wall assemblies in India taken from
a study by Pranav Kishore et al (Kishore, Kini, & Raj,
2020) as shown in Table 1 and Table 2.
The 4 different types of wall finish typologies (F1
= both side finish, F2 = both exposed, F3 = finished
inside and exposed outside and F4 = exposed inside
and finished inside) have been considered for the
study. The number of layers of finishes has been
restricted to three layers as per practical application.
The materials used in the study are accepted and used
in the compilation of materials used in the industry
which complies with ECBC 2017 and is tested by
CARBSE, CEPT Ahmedabad, and verified by CSBE,
MAHE, Manipal.
3.3 Energy Conservation Building
Code
Buildings consume a significant proportion of energy
resources, so the Bureau of Energy Efficiency (BEE
– India) has launched Energy Conservation Building
Code (ECBC) in the year 2007 to establish minimum
building performance standards for the commercial
buildings of India, which is a regulatory tool to limit
the energy footprint of the commercial buildings.
Section 4 in ECBC explains the building envelope.
The building envelope is considered as skin of
building, which consists of walls, openings, and roof.
These components play a crucial role in the heat
transfer into the building. It is required to maintain the
thermal comfort of the occupants in a building as it
affects the functionality of the occupants. If the heat
transfer is very high then the temperature in the space
increases and HVAC systems are used to achieve
thermal comfort. As the HVAC systems consume
more amount of energy, which leads to more
expenditure on the systems. So ECBC 2017 provides
us the different benchmarks for the envelope based on
climate zone, type of building and different levels of
Table 1: Block materials and exterior finish materials for wall (Shetty, Kishore, Kini, Acharya, & Raj, 2020).
Financial Feasibility of Opaque Envelopes in ECBC Complaint Energy Efficient Indian Commercial Buildings: An Approach for
Maximising the Internal Rate of Return
133
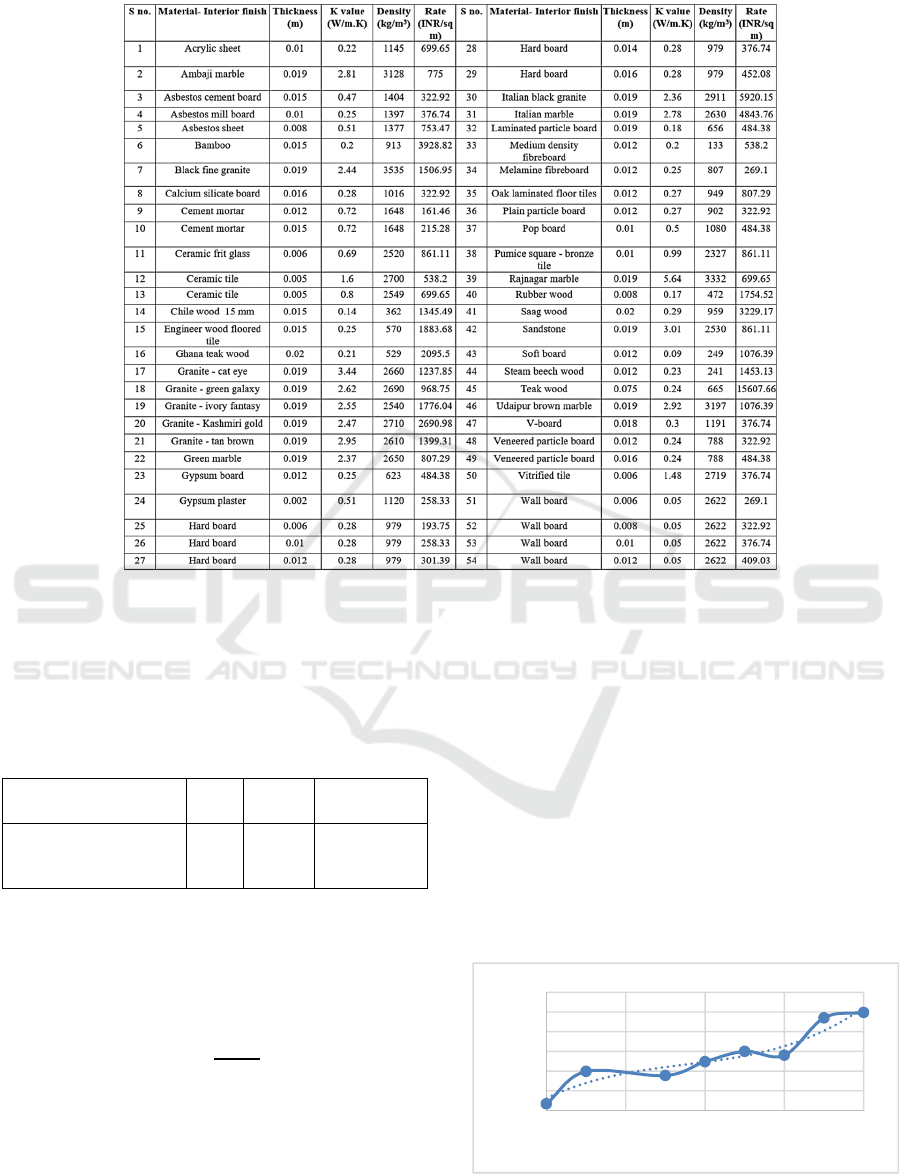
Table 2: interior finish materials for wall (Shetty, Kishore, Kini, Acharya, & Raj, 2020).
efficiency like ECBC, ECBC+, and super ECBC. In
this study, only warm and humid climate was
considered, so the benchmarks used for the wall of
different levels of ECBC in warm and humid climate
for commercial buildings are as per Table 3.
Table 3: maximum u-factor values.
ECBC ECBC+ ECBCSuper
Maximum thermal
transmittance for the opaque
external walls in W/sqmK
0.40 0.34 0.22
3.4 Internal Rate of Return
IRR is an evaluation method that measures the
financial gains of an investment. The rate (R) at
which NPV is zero is the IRR.
∑
= 0 (2)
Where, NPV = net present value
R= discount rate
t= time of the cash flow
C
t
= net cash flow at time t
C
o
= total initial investment cost
3.5 Regression for Electricity Price
The study makes use of linear regression for
calculations. All the electricity prices from 2011 to
2019 have been collected and a simple curve is
plotted with the available data points and the equation
of the curve is used for the prediction of the price of
electricity per unit in the future as in Graph 1. In the
past prices did not change much, due to communist
government in the state and also due to COVID crisis.
This graph infers the rise in electricity price per unit
over the building life span along with the rise in trend
of price related to the internal rate of return across the
expected life-span of the building (Ramesh, Prakash,
& Shukla, 2010).
Graph 1: Regression line showing electricity prices over the
year.
y = 0,0193x
3
- 116,92x
2
+ 235539x - 2E+08
R² = 0,9157
4
5
6
7
8
9
10
2011 2013 2015 2017 2019
Price of electricity per unit
(KWh)
Year
FEMIB 2022 - 4th International Conference on Finance, Economics, Management and IT Business
134
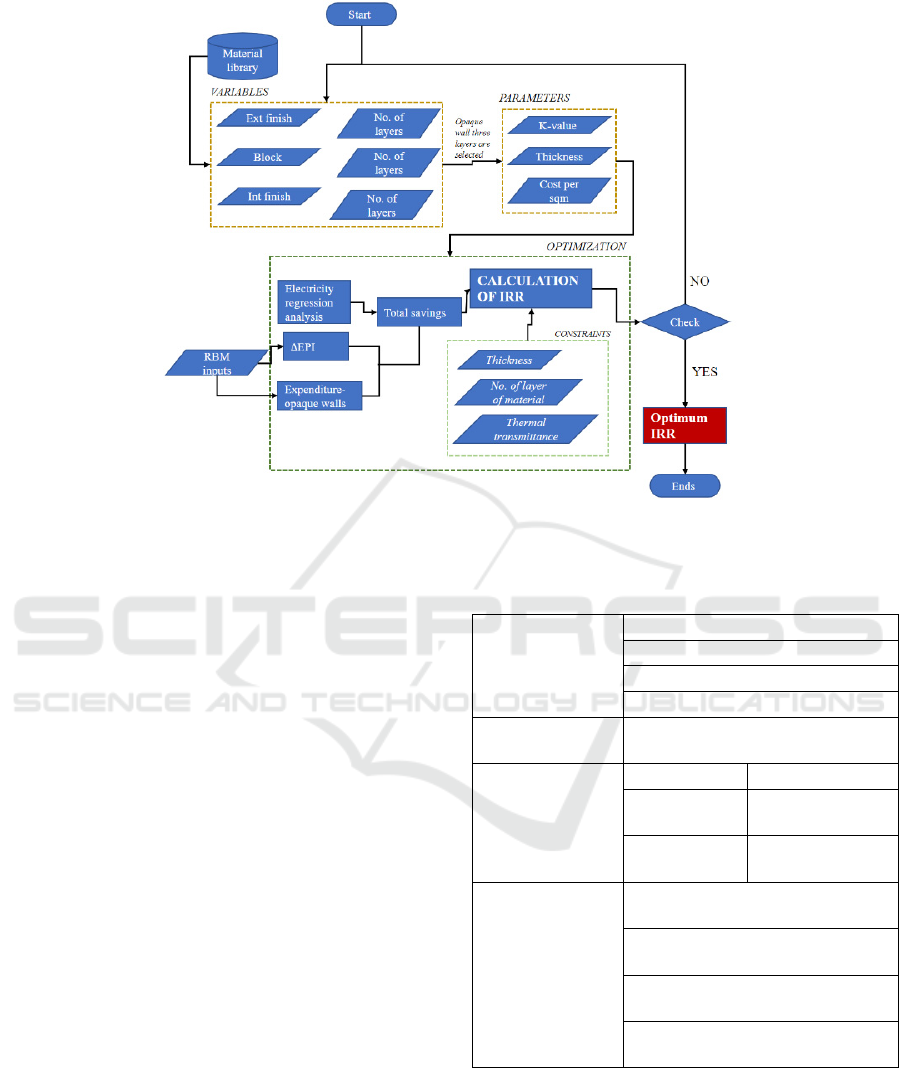
Figure 3: Optimization process flowchart.
3.6 Optimization
The process of obtaining the best solution from a set
of solutions that support the objective is termed
optimization. Optimization starts with selecting an
objective function and determine dependent and
independent variables to make a complete domain of
results and the final solution is obtained from the
domain which gives the best solution to the objective
function satisfying all constraints (Fogel, 1994).
The MS Excel evolutionary solver has been used
for optimization. The objective function is given in
terms of f(x
1
, x
2
, x
3
, … x
n
), where ‘x’ can be the point
of minima or maxima of the function. The objective
function is taken as maximizing the IRR, variables are
block material for wall, exterior wall finish material,
interior wall finish material, and their respective
number of layers along with constraints as their
respective thicknesses which can range from 6 inches
to 12 inches. The maximum thermal transmittance of
the opaque wall section will be determined by the
selected level of ECBC from ECBC 2017 handbook.
The income will be determined from the savings of
EPI by changing the building envelope which leads to
the parameters which affecting the objective i.e. roof,
wall, and fenestrations. After choosing a wall, the
thermal transmittance of the wall changes due to the
materials present in it. Table 4 summarizes the
categories considered within the study to optimize the
data in terms of IRR.
Table 4: Input, objective function, variables, and
constraints.
Input ECBC Compliance
Type of building
Functional hours
Type of finish
Objective
function
Maximizing the IRR
Variables Interior finish Number of layers
Block
material
Number of layers
Exterior
finish
Number of layers
Constraints
thermal transmittance of wall
<=0.40 - ECBC
thermal transmittance of wall
<=0.34 - ECBC+
thermal transmittance of wall
<=0.22- ECBC Super
6 inches < Thickness of wall < 12
inches
The optimization starts with the change of the values
in the variable which is the opaque wall material and
then checks for the optimality which is maximum
IRR and then the solver is run until the iterations are
repeating the same solution and then converged. The
detailed flow of result identification is depicted in
Figure 3.
Financial Feasibility of Opaque Envelopes in ECBC Complaint Energy Efficient Indian Commercial Buildings: An Approach for
Maximising the Internal Rate of Return
135
4 RESULTS AND DISCUSSION
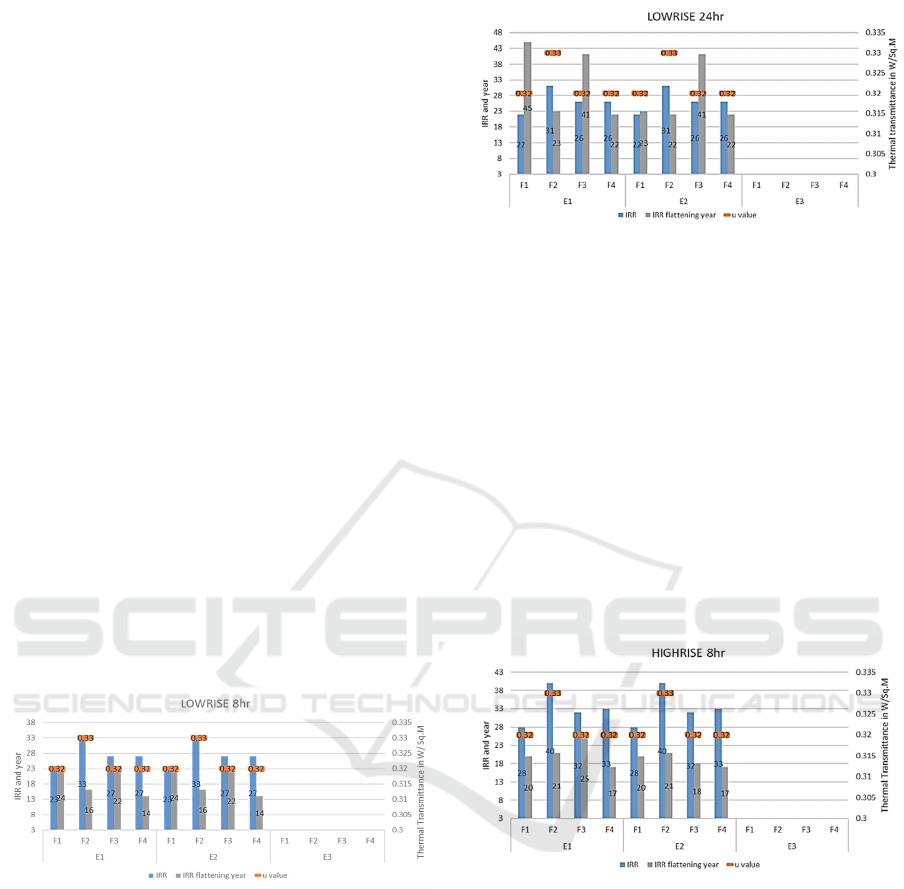
From graph 2 of the results of the evolutionary
optimization of IRR for Low-rise 8hr functional
building, we can say that ECBC and ECBC+ have
shown similar results for all kinds of wall finish
typology. The IRR in both the compliances ranges
from 23% to 33% for finish type F1 and F2. The years
from which the IRR change becomes very minimal
range from 24
th
year to 14
th
year for finish type 1 and
finish type 4 respectively. The achieved thermal
transmittance (u-value) for the highest IRR i.e. 33%
is 0.33 W/Sq.mK. The selected block material for
wall is ECBC rated foam concrete of dimensions
24in x 8in x4in, the exterior finish for all the cases is
Mangalore roof tile (terracotta tile) and interior finish
of ECBC rated hardboard of thickness 6 mm in all the
types of ECBC and types of finishes. All the finishes
are of one layer only to achieve the maximum IRR.
The growth of IRR for every case is increasing for
certain years and the change is becoming negligible
after some years. There is no optimum solution for
ECBC super low-rise 8hr because of the thickness
constraint, which gives the minimum thickness as 6
inches and maximum of 12 inches of thickness for
attaining a thermal transmittance (u-value) value of
0.22 W/Sq.mK. The solution for ECBCSuper can be
achieved only by adding insulation to the wall or by
increasing the thickness of the block material.
Graph 2: Low-rise 8hr building.
From graph 3 of the results of the evolutionary
optimization of IRR for Low-rise 24hr functional
building, the IRR in both the compliances ranges
from 22% to 31% for finish type F1 and F2. The years
from which the IRR change becomes very minimal
range from 22
nd
year to 45
th
year for finish type 4 and
finish type 2 in ECBC and ECBC+ respectively, and
finish type 1 in ECBC.
The achieved thermal transmittance (u-value) for
the highest IRR i.e 31% is 0.33 W/Sq.mK. The
selected block material for wall is ECBC rated foam
concrete of Size- 24in x 8in x4in for results of all
finishes in ECBC and finish type F1 but for the finish
Graph 3: Low-rise 24hr building.
type 2, finish type 3, and finish type 4 the optimum
material for maximizing the IRR is ECBC rated foam
concrete of Size- 24in x 8in x4in of 2 layers, the
exterior finish for all the cases is Mangalore roof tile
(terracotta tiles) and ECBC rated hardboard of
thickness 6 mm in all the types of ECBC and types of
finishes. All the finishes are of one layer only to
achieve the maximum IRR. There is no optimum
solution for ECBCSuper for low rise-24hr building
because of the thickness constraint which gives the
minimum as 6 inches and maximum of 12 inches for
attaining a thermal transmittance (u-value) value of
0.22 w/Sq.mK. The solution for ECBC can be
achieved only by adding insulation to the wall or by
increasing the thickness of the block material.
Graph 4: high-rise 8hr building.
From graph 4 of the results of the evolutionary
optimization of IRR for High-rise 8hr functional
buildings, we can say that ECBC and ECBC+ have
shown similar results for all kinds of finishes in high-
rise 8hr functional buildings. The IRR in both the
compliances ranges from 28% to 40% for finish type
F1 and F2. The years from which the IRR change
becomes very minimal range from 17
th
year to 25
th
year for finish type 4 in ECBC and ECBC+
respectively, and finish type 3 in ECBC. The
achieved thermal transmittance (u-value) for the
highest IRR i.e. 40% is 0.33 W/Sq.mK. The selected
block material is ECBC rated foam concrete of Size-
24in x 8in x4in for finish type 1, finish type 2 in
FEMIB 2022 - 4th International Conference on Finance, Economics, Management and IT Business
136
ECBC, and finish type 1 in ECBC+ but the optimum
material for maximizing the IRR is ECBC rated foam
concrete of Size- 24in x 8in x4in of 2 layers in finish
type 3 and finish type 4 in ECBC and finish type 2,
finish type 3 and finish type 4, the exterior finish for
all the cases is Mangalore roof tile (terracotta tiles)
and ECBC rated hardboard of thickness 6 mm in all
the types of ECBC and types of wall finishes. All the
finishes are of one layer only to achieve the maximum
IRR. There is no optimum solution for ECBCSuper
for high rise-8hr buildings because of the thickness
constraint which gives the minimum as 6 inches and
maximum of 12 inches for attaining a thermal
transmittance (u-value) value of 0.22 w/Sq.mK. The
solution for ECBC can be achieved only by adding
insulation to the wall or by increasing the thickness of
the block material.
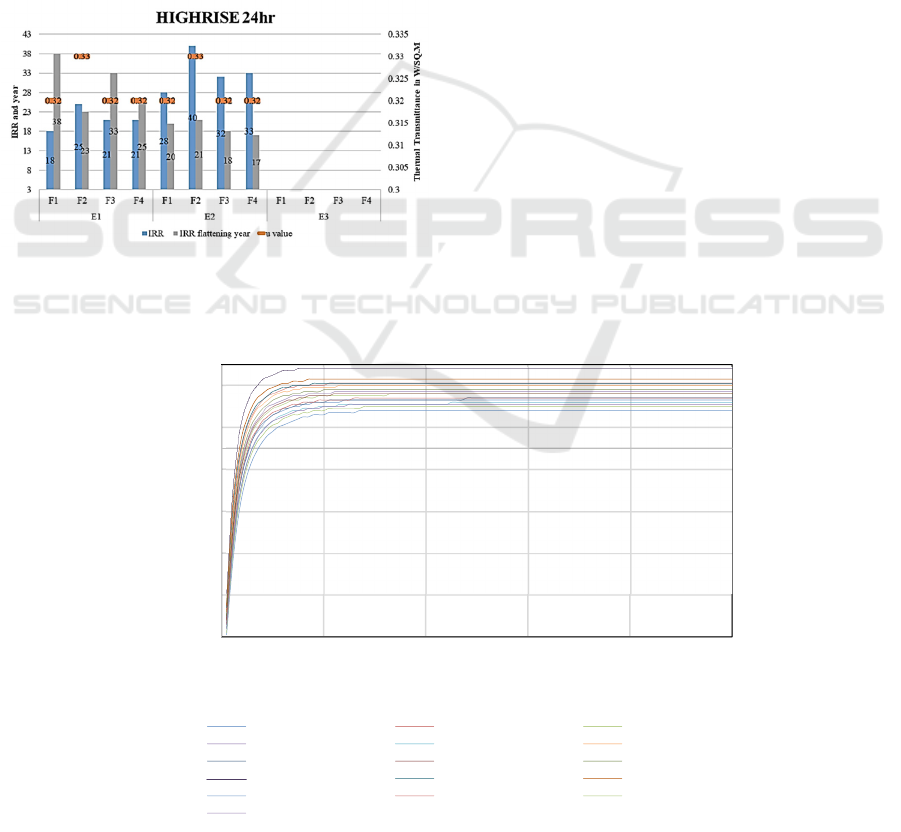
Graph 5: high-rise 24hr building.
From graph 5 of the results of the evolutionary
optimization of IRR for high rise-24hr functional
building, the IRR in both the compliances ranges
from 28% to 40% for finish type F1 in ECBC and F2
in ECBC+. The years from which the IRR change
becomes very minimal range from 17
th
year to 38
th
year for finish type 4 in ECBC+ and finish type 1 in
ECBC. The achieved thermal transmittance (u-value)
for the highest IRR i.e. 40% is 0.33 W/Sq.mK. The
selected block material for the wall is ECBC rated
foam concrete of Size- 24in x 8in x4in in results of all
finishes in ECBC and finish type 3 and finish type 4
in ECBC and all the finishes of ECBC+, the optimum
material for maximizing the IRR is ECBC rated foam
concrete of Size- 24in x 8in x4in of 2 layers, the
exterior finish for all the cases is Mangalore roof tile
(terracotta tiles) and ECBC rated hardboard of
thickness 6 mm in all the types of ECBC and types of
finishes. All the finishes are of one layer only to
achieve the maximum IRR. There is no optimum
solution for ECBC super for high rise-24hr building
because of the thickness constraint which gives the
minimum as 6 inches and maximum of 12 inches for
attaining a thermal transmittance (u-value) value of
0.22 w/Sq.mK. The solution for ECBC can be
achieved only by adding insulation to the wall or by
increasing the thickness of the block material.
Graph 6 is an IRR over a total of 100 years of the
building. It explains how it changes over a period of
time. At the beginning of the time, the IRR is in
negative values as there is only expenditure on the
walls and no income from it and the savings from the
energy-saving starts from the first year and it goes on
as the maintenance for the walls are considered as
Graph 6: Change of IRR over time.
-90
-70
-50
-30
-10
10
30
0 20406080100
INTERNAL RATE OF RETURN (IRR)
YEAR
lowrise 8 hr F1 lowrise 8 hr F2 lowrise 8 hr F3
lowrise 8 hr F4 lowrise 24 hr F1 lowrise 24 hr F2
lowrise 24 hr F3 lowrise 24 hr F4 highrise 8 hr F1
highrise 8 hr F2 highrise 8 hr F3 highrise 8 hr F4
highrise 24 hr F1 highrise 24 hr F2 highrise 24 hr F3
highrise 24 hr F4
Financial Feasibility of Opaque Envelopes in ECBC Complaint Energy Efficient Indian Commercial Buildings: An Approach for
Maximising the Internal Rate of Return
137

negligible. In the initial approximate time duration of
20 years the IRR is increasing in a haste and does not
increase rapidly after the 20 years. The change in IRR
over the time duration is almost constant (as the
change is very minimal). Similarly, it is repeated for
every building and every finish but the year over
which it becomes almost the same with the next year,
changes in every case.
A study conducted by Sau Wai Lee for the
economic evaluation of roof thermal insulation in the
equatorial climate of Malaysia says that the IRR
ranges from 6.33% to 15.83% based on the material
that is used as the insulation for the roof. By
increasing the performance of the building using the
correct composition of the roof, they were able to
achieve the IRR (Lee, Lim, Chan, & Von, 2017).
5 CONCLUSION
This study shows that converting a conventional
building to an energy-efficient building even with
optimization of one component of the building
envelope yield a lot of savings. The savings are
considered as the income with the cost of the wall as
the expenditure and the IRR is calculated. The results
explain that the best block material is foam concrete
with the required thickness and the exterior finish is
Mangalore tiles (terracotta tiles) and the interior
finish is hardboard, which gives us a range of 18% to
40% IRR which is very high. Figure 4 shows the
sections of the optimum exterior wall composition.
Figure 4: Cross-section image of a wall section using the
most recurring material selection after optimization.
Anyhow there was no feasible solution that could
satisfy the constraints of ECBCSuper because an
increase in thickness of the wall will reduce the
thermal transmittance (u-value) but for the thermal
transmittance (u-value) constraint of the ECBCSuper
was 0.22 W/Sq.mK which cannot be attained with the
given constraint of thickness i.e. it lies between 6
inches and 12 inches. For ECBCSuper the solution
can be obtained by adding insulation to the interior
finish so adds high resistance to heat in the walls.
Fund disclaimer: The author(s) received no
financial support for the research, authorship,
and/or publication of this article.
REFERENCES
Aijazi, A., & Brager, G. S. (2018). Understanding Climate
change impacts on building energy use. ASHRAE
Journal, 60(10).
Bhatnagar, M., Mathur, J., & Garg, V. (2019).
Development of reference building models for India.
Journal of building engineering, Elsevier, Journal of
building engineering 21 (2019) 267-277;
https://doi.org/10.1016/j.jobe.2018.10.027.
Filippin, C., Larsen, S. F., & Ricard, F. (2018).
Improvement of energy performance metrics for the
retrofit of the built environment. Adaptation to climate
change and mitigation of energy poverty. Energy and
Buildings, Elsevier, Volume 165, 15 April 2018, Pages
399-415; https://doi.org/10.1016/j.enbuild.2017.12.050.
Garg, N., Kumar, A., Pipralia, S., & Garg, P. (2018).
Initiatives to achieve energy efficiency for residential
buildings in India: A review. Indoor and built
environment, Sage journals, https://doi.org/10.11
77%2F1420326X18797381.
Gercek, M., & Arsan, Z. D. (2019). Energy and
environmental performance based decision support
process for early design stages of residential buildings
under climate change. Sustainable cities and societies,
Volume 48, July 2019, 101580; https://doi.org/10.1016/
j.scs.2019.101580.
Hoxha, V., & Shala, F. (2019). The benefits and challenges
of sustainable buildings in Prishtina, Kosovo.
Facilities, Facilities, Vol. 37 No. 13/14, pp. 1118-1152.
https://doi.org/10.1108/F-08-2018-0097.
IEA, I. E. (2021). India Energy Outlook 2021. World
Energy Outlook Special Report.
IPCC, T. I. (n.d.). Global Warming of 1.5 degrees Celcius.
The Intergovernmental Panel on Climate Change.
Jiang, A., Liu, X., Czarnecki, E., & Zhang, C. (2019).
Hourly weather data projection due to climate change
for impact assessment on building and infrastructure.
Sustainable cities and society, Elsevier, Volume 50,
October 2019, 101688; https://doi.org/10.1016/
j.scs.2019.101688.
Khosla, R., & Janda, K. B. (2019). India’s building stock:
towards energy and climate change solutions. Building
research and information, Taylor and Francis, Volume
47, 2019; https://doi.org/10.1080/09613218.2019.15
22482.
Kishore, N. (2021). Impact of climate change on future
bioclimatic potential and residential building thermal
and energy performance in India. Indoor and built
environment, Sage journals, https://doi.org/10.1177
%2F1420326X21993919.
FEMIB 2022 - 4th International Conference on Finance, Economics, Management and IT Business
138

Kishore, P., Kini, P., & Raj, A. (2020). Optimization-based
feasibility analysis for Energy conservation building
code compliance of opaque wall assemblies in different
climatic zones of India. Procedia Manufacturing,
Elsevier, Volume 44(2020), pages 221-228.
Nations, U. (n.d.). Department of Economic and social
affairs, Sustainable Development. Retrieved from
United Nations: https://sdgs.un.org/goals
Sadath, A., & Acharya, R. H. (2018). Energy Poverty and
Economic Development: Household-level Evidence
from India. Energy and Buildings, Elsevier,183:785-
791; http://dx.doi.org/10.1016/j.enbuild.2018.11.047.
Sharma, M. (2018). Development of a ‘Green building
sustainability model’ for Green buildings in India.
Journal of cleaner production, Elsevier, Volume 190,
20 July 2018, Pages 538-551; https://doi.org/10.1016/
j.jclepro.2018.04.154.
Shetty, S., Kishore, P., Kini, P., Acharya, R. R., & Raj, A.
(2020). Energy Conservation Building Code (ECBC)
based optimum wall composition with respect to
thermal transmittance and thickness for different
commercial pockets of Tier-1 city in temperate climatic
zone of India. Procedia Manufacturing, Elsevier,
Volume 44, 2020, Pages 229-236; https://doi.org/10.10
16/j.promfg.2020.02.226.
Zhang, L., Wu, J., & Liu, H. (2017). Turning green into
gold: A review on the economics of green buildings.
Journal of cleaner productions, doi: 10.1016/j.jcle
pro.2017.11.188.
Zhang, Y., Wang , H., Gao, W., Wang, F., Zhou, N.,
Kammen, D. M., & Ying, X. (2019). A Survey of the
Status and Challenges of Green Building Development
in Various Countries. Sustainability, MDPI,
Sustainability 2019, 11(19), 5385; https://doi.org/10.3
390/su11195385.
Ramesh, T., Prakash, R., & Shukla, K. K. (2010). Life cycle
energy analysis of buildings: An overview. Energy and
Buildings; Elsevier, Energy and Buildings 42 (2010)
1592–1600; doi:10.1016/j.enbuild.2010.05.007.
Lee, S. W., Lim, C. H., Chan, S. A., & Von, K. L. (2017).
Techno-economic evaluation of roof thermal insulation
for a hypermarket in equatorial climate: Malaysia.
Sustainable cities and society, Volume 35, November
2017, Pages 209-223; https://doi.org/10.1016/
j.scs.2017.08.011.
Fogel, D. B. (1994). An Introduction to Simulated
Evolutionary Optimization. IEEE Transactions on
Neural Networks,, Vol. 5, No. 1, January 1994.
Financial Feasibility of Opaque Envelopes in ECBC Complaint Energy Efficient Indian Commercial Buildings: An Approach for
Maximising the Internal Rate of Return
139
