
The Design of a Public Service Cost Model Tool to Evaluate Digital
Transformation in Brazilian Government
Rejane Maria Da Costa Figueiredo
1,2,3 a
, John Lenon Cardoso Gardenghi
1,2,3 b
,
Let
´
ıcia De Souza Santos
1
, Rafael Arruda Furtado
3
, Rafael Fazzolino Pinto Barbosa
1
,
Lucas Ursulino Boaventura
1,3
, Augusto Samuel Clementino Modesto
1
and Laura Barros Martins
1
1
Information Technology Research and Application Center (ITRAC), University of Brasilia (UnB), Brasilia, DF, Brazil
2
Post-Graduate Program in Applied Computing, University of Brasilia (UnB), Brasilia, DF, Brazil
3
University of Brasilia (UnB), Brasilia, DF, Brazil
Keywords:
Digital Transformation, Cost Model, SCM.
Abstract:
Digital transformation plays a central role both in private and public sectors. In addition to increasing ef-
ficiency and practicality in service delivery, digitalization may generate economic savings for the agency
provider and for the citizen user of the service. In this context, a central issue emerges: how to quantify eco-
nomic savings in digitalization? The Brazilian federal government has been implementing many initiatives to
promote digital government, and ways to measure the costs of a service are in constant development. One of
these ways is through the use of a methodology adapted from the European standard cost model. The present
paper aims to provide the design of a tool to estimate the costs of services both for the government and for
the citizen, and for physical and digital delivering of a service, by applying a prototyping technique using the
mentioned adapted methodology. We present the design and implementation of the tool. As future work, an
analysis of the use of the tool in Brazil, how it impacts in the decision of digitalize a service and real economic
savings may take place. Our main contribution is to provide a specification that can serve as a basis for similar
tools, besides the idea of how to systematically apply a cost model using a tool which can be easily applied by
other organizations without advanced knowledge in the area.
1 INTRODUCTION
The Brazilian federal government has been encourag-
ing and investing resources in digital transformation
of the federal public services. Digital transformation
brings benefits such as lowering barriers to entry, re-
ducing the possibility of fraud and reducing the time
spent by users and the costs involved in interactions.
These positive externalities can impact fundamental
human values by the promotion of more sustainable
and inclusive public services. Nevertheless, quanti-
fying the potential cost savings depends on specific
methodologies. In this context, two main initiatives
were designed by the government: a Digital Citi-
zenship Platform (Brasil, Presid
ˆ
encia da Rep
´
ublica,
2016b), which aims to increase the access of Brazil-
ian citizens to digital public services, and the Dig-
a
https://orcid.org/0000-0001-8243-7924
b
https://orcid.org/0000-0003-4443-8090
ital Transformation Program, called Transformation
Kit, which was a set of six phases aiming to encom-
pass the need for agencies and entities to promote
digital transformations by analysing the perspective
of the citizen user, as well as the view of compa-
nies. The Transformation Kit featured, among other
tools and models, a methodology called Public Ser-
vice Cost Model, developed by the Brazilian govern-
ment’s Ministry of Economy, based on an adaptation
of the well-known European Standard Cost Model
(SCM) (Network, 2005), for measuring administra-
tive burdens. The model seeks to assess the impact of
the public services transformation policy, estimating
the costs to users (citizens or companies) and to the
government agencies, both before and after the trans-
formation of the service. Based on these cost anal-
yses, it is possible to study specific impacts of the
digitalization, differences of these impacts by types
of services and to measure them. The task of mea-
suring costs of a provided service is not trivial, but
442
Figueiredo, R., Gardenghi, J., Santos, L., Furtado, R., Barbosa, R., Boaventura, L., Modesto, A. and Martins, L.
The Design of a Public Service Cost Model Tool to Evaluate Digital Transformation in Brazilian Government.
DOI: 10.5220/0011108900003179
In Proceedings of the 24th International Conference on Enterprise Information Systems (ICEIS 2022) - Volume 2, pages 442-452
ISBN: 978-989-758-569-2; ISSN: 2184-4992
Copyright
c
2022 by SCITEPRESS – Science and Technology Publications, Lda. All rights reserved

less trivial is the task of projecting costs of a digital-
ized service. The services that citizens and organi-
zations consume have costs of different types: time,
money, requirements to execute the service, among
others. Therefore, understanding the costs is chal-
lenging, and it is very critical to have a more realistic
view of strategic decision-making for digital transfor-
mation. Such analysis enables a better understanding
of the service itself, through the identification of bar-
riers and possible improvements, delivering a higher
quality and possibly lower cost service to the citizens.
The present work aims to present the design of a tool
to estimate the costs of services before and after dig-
ital transformation by implementing an adaptation of
the SCM. Such a tool is essential to provide informa-
tion in order to support decision on whether to apply
digital transformation to a service. The rest of this
paper is organized as follows: in Section 2, we show
a brief literature review, in Section 3 we present our
methodology of research and development, in Sec-
tion 4 we present the cost measurement model, in Sec-
tion 5 we present the results, in Section 6 some dis-
cussion, and in Section 7, conclusion and future work.
2 LITERATURE REVIEW
2.1 Digital Government
With the new technologies, people create new expec-
tations of how they can interact with institutions, in
particular with governments, since many procedures
and obligations can be fulfilled easily and efficiently
using such technologies (OECD, 2014).
Therefore, the government needs to create new ap-
proaches to public governance, which may involve
digitalization and less red tape and bureaucracy of
services. This phenomenon is called e-government.
E-government is “the simplified handling of infor-
mation, communication and transaction processes
for providing an administrative service through the
use of information and communication technologies
within and between authorities, and between author-
ities and private individuals or companies” (Becker
et al., 2012).
This has three major focuses (Fang, 2002): E-
government, which refers to the internal administra-
tive, organizational and communicative activities of
the government, E-commerce, which interfaces the
government and the market, and E-citizens, which in-
terfaces the government and the citizens, allowing the
practical and efficient availability of services to the
citizens.
Therefore, the concept of digital government
reaches many scopes, which evinces the greatness and
importance of a process of digital transformation in
the government. Brazilian government is increasingly
supporting the implementation of e-government by
applying many initiatives to support digital transfor-
mation of services, which we address in the next sec-
tion.
2.2 Digital Transformation
Digital transformation is “a process that aims to im-
prove an entity by triggering significant changes to its
properties through combinations of information, com-
puting, communication, and connectivity technolo-
gies” (Vial, 2019). Digital transformation in the pub-
lic sector is one of the most trending fields of investi-
gation, in which approximately one third of recently
published works are acting (Kutzner et al., 2018).
To encourage the transformation of public ser-
vices into digital ones, aiming to deliver them through
digital media, the Brazilian government published
some relevant decrees between 2014 and 2016, and
we cite some of them along this section. The decrees
defined the Policy of Digital Governance and the Dig-
ital Citizenship Platform, in the context of the Fed-
eral Public Administration (FPA), both under the re-
sponsibility of the Ministry of Planning, Budget, and
Management (MP) (Brasil, Presid
ˆ
encia da Rep
´
ublica,
2016b; Brasil, Presid
ˆ
encia da Rep
´
ublica, 2016a).
The Digital Citizenship Platform configures a set
of methodologies and solutions that aim to enlarge
and to simplify the citizen access to services and to
support the public agencies in the digital transforma-
tion of services. All the services provided are of-
fered through the federal government services web-
site
1
. Together with this website, a program of au-
tomation of public services was launched in order
to support public agencies to identify, to prioritize,
to digitalize, and to implement the services with im-
proved quality and transparency to citizens.
2.3 The Costs of Services
In recent years, there has been considerable variation
in the efforts of developing countries to reduce ad-
ministrative burden (CA) (Torriti and Ikpe, 2015) and
to estimate gains when transforming services (Char-
alabidis and Askounis, 2010). Government initiatives
to reduce these costs tend to be associated with many
business-related benefits, such as: minimizing direct
and indirect regulation costs; facilitate the initial and
1
https://www.gov.br.
The Design of a Public Service Cost Model Tool to Evaluate Digital Transformation in Brazilian Government
443

operating costs of regulated companies; and track the
impact of regulation after implementation (Matei and
Matei, 2012).
According to Brazilian legislation, a public ser-
vice is the “action of the federal public administration
agencies and entities to meet the needs of the society
related to the exercise of a right or the performance of
a duty, both directly or indirectly”, whereas a digital
public service is a “public service whose deliver oc-
cur through digital medium” (Brasil, Presid
ˆ
encia da
Rep
´
ublica, 2016b).
The challenge of assigning a cost to a service is
a very important task when the government need to
decide if it is worth to transform a physical service to
a digital one. Up to our knowledge, no formal method
for this is available in the literature for the specific
need of computing a cost of a public service.
Nevertheless, the very first strategy to attribute
costs to a service emerged in 1905 and consists in
the sum of the cost of three factors (Kaplan and An-
derson, 2007): (i) labour, which includes the cost of
employee and machines per unit of time, (ii) mate-
rial, which includes all the cost to provide the nec-
essary material to produce a product or to deliver
a service, and (iii) overhead, which are all the sec-
ondary costs, such as energy, rent, transportation,
among others. From this approach, three classical
cost models to general public services arose: the Ac-
tivity Based Costing (ABC), the Time-Driven Activ-
ity Based Costing (TDABC), and the Standard Cost
Model (SCM), which we briefly describe in the next
sections.
2.3.1 The ABC and TDABC Models
With the evolution of service provision, the sum
of labour, material, and overhead as an estimation
of a service cost became infeasible since a service
provider does not provide a unique service or product
anymore. In 1980s, a new pricing model arose: ABC
(Activity Based Costing). To implement ABC, it is
necessary to identify: (i) which activities are involved
to provide a service or to produce a product, (ii) how
many times each activity is performed, (iii) the ser-
vice or product total cost by a unit of time, and (iv)
the total time spent in each activity. With the service
total cost and the total time spent in each activity, it
is possible to compute the cost per activity. Nonethe-
less, this model was not well accepted, since it is not
an easy task to build such a model (for example, to
estimate the total time spent in each activity is a very
difficult task when the process of production of ser-
vice delivering is very complex).
To solve this complexity, the TDABC (Time-
Driven Activity Based Costing) was proposed. This
model consists in estimating a capacity cost rating,
which is an estimate of how much an activity costs
per unit of time given the total budget of a department
(or company, or agency, among others) and the total
time (in the same unit of time) that people in the de-
partment really work.
2.3.2 The Standard Cost Model
The Standard Cost Model (SCM) was created in the
nineties in the Netherlands aiming to measure the re-
duction of administrative burdens for businesses. It
uses a high level of details to measure administrative
costs. By administrative costs, the SCM refers to two
types of costs: (i) the costs of regulation, which refers
to costs imposed by regulation on businesses (differ-
ent types of regulation costs are depicted at Figure 1)
and (ii) administrative burdens, that are part of admin-
istrative costs which comprises the activities that are
conducted only because regulation requires it.
Figure 1: Different costs of regulation for businesses,
adapted from (Network, 2005).
From the SCM it is possible to decompose regula-
tions into measurable manageable components. The
SCM has four main components: (i) the information
obligations (IO) are the obligations to make informa-
tion available to public sector or third parties due to
regulation, (ii) the data requirements are the elements
of information that must be provided, (iii) the admin-
istrative activities, which are the necessary activities
to provide information of each data requirement, and
(iv) the cost parameters, that are parameters to mea-
sure the costs of each administrative activity and con-
sists of price, time, and quantity.
Each IO consists of one or more data require-
ments, which in turn are informational elements in
agreement with the requesting IO. Is possible to pro-
vide information for each data requirement, and a se-
ries of administrative activities must be performed.
These activities can be performed internally or out-
sourced. Putting all these elements together, we can
state the main SCM formula: the cost per administra-
tive activity is the product between price, time, and
quantity. To compute the final cost, overhead costs
must be also considered (such as acquisitions, energy,
and other means that may be used).
The Brazilian government developed a model
adapted from the SCM. The adapted model calculates
ICEIS 2022 - 24th International Conference on Enterprise Information Systems
444

the potential impact of public service digital transfor-
mation projects. It provides an understanding of the
costs of users (citizens or companies) generated by
interactions (user journey) with the public administra-
tion and the internal costs of the public entity respon-
sible for providing the services. It also incorporates
the estimated investment required for digital transfor-
mation. Details on this model are given in Section 4.
3 RESEARCH DESIGN AND
METHODS
The techniques used for the design of the proposed es-
timating cost tool involves prototyping and the diag-
nostic phase of action research (Petersen et al., 2014).
The diagnostic phase was used to selection of the
study object and its characterization, identifying the
main problems and needs of the organization that lead
to the construction of a service pricing tool.
The diagnostic stage involved the collaborative
analysis between the research team and project stake-
holders, which aimed to understand the organization’s
needs in relation to automated support to measure ser-
vice costs.
With the Diagnosis phase, it was possible to de-
fine a set of modules that the tool will encompass and,
with that, define the interaction cycles for eliciting re-
quirements. The identified modules were:
• Cost for service users;
• Cost to the agency;
• Investment cost;
• Indicators and Dashboards; and
• Service management.
After the diagnosis, prototyping steps were per-
formed (Functional selection, Construction and Eval-
uation, in cycles.) The Prototyping was the main
technique as a well-defined phase in the process of
production of a model that can show all the essential
characteristics of a final product (Floyd, 1984). This
model can be used both as a sample or a guide for
future production. The idea is that the developed pro-
totype in this work may give room to produce the tool
itself in a future work.
The prototyping strategy consists of “[...] elic-
itation of requirements in which user needs are
extracted, presented and refined successively, con-
structing a functional model of the final system
quickly and in its working context” (Bischofberger
and Pomberger, 2012).
We adopted an exploratory prototyping, which en-
courages improvements to the initial phases of re-
quirements and functional analysis (Floyd, 1984),
while the steps followed were functional selection,
construction, and evaluation, employing the use of
horizontal prototyping.
The steps were executed in interactive cycles in-
volving the prototyping team and the interested part.
In these cycles, a prototype was built, evaluated and
refined, producing an initial version in the beginning
of the process, until one that satisfied the needs of
the interested part. Figure 2 represents the described
prototyping strategy that we are considering in the
present paper.
Figure 2: Exploratory Prototyping Steps for The Data Col-
lection.
The requirements elicitation is divided into
phases, in which we consider prototyping cycles that
enable a feedback communication tool and that show
the technical feasibility of a software. For this, we
employ an applied, qualitative, and descriptive re-
search, and making use of informal interviews and
meetings.
In 12 meetings with the interested part, it was pos-
sible to complete 11 prototyping cycles. Functional
selection was performed at the first meeting of the
cycle, while construction took place in the space re-
served until the next meeting, when the validation for
the closure of the cycle and functional selection for
the opening of the next cycle occurred.
The first prototype elaborated was non-functional,
containing the explicit functionalities to align the
overall view of the involved ones. In the second cycle,
the prototype evolved into functional.
The first interview was carried out in order to
accomplish the Functional Selection so that, after-
wards, a cycle per interview was carried out. From
the second interview, the prototype built so far was
presented, then evaluated, and new features were se-
lected.
The prototype was built and validated in an in-
terview, then the necessary changes were made to be
taken to the next meeting. From the analyzes made,
questions and identification of new needs arose, the
analysis emerged questions and identification of new
needs, which led to the need for changes and new
The Design of a Public Service Cost Model Tool to Evaluate Digital Transformation in Brazilian Government
445

functional selections. From the construction and anal-
ysis of a new prototype, a cycle was closed and a new
one started.
In the first cycle, an overview of the system and
the first in-depth module was established: Cost for
service users. About 4 other cycles focused on the
Cost module for service users, and 2 cycles for Cost
for the agency. The investment cost required 1 cycle,
the same amount as Indicators and Dashboards and
Service Management. Finally, the remaining cycle
was dedicated to the refinement of parts of the sys-
tems not provided for in the modules, such as login
and usability.
The number of cycles for each module is not ac-
curate due to the partner’s reflections after the inter-
view, which led to suggestions for changing to mod-
ules considered completed. Therefore, two or more
modules were specified in parallel during some cy-
cles, something already expected according to the ap-
plied technique. The greater the number of inconsis-
tencies or problems identified during prototyping, the
less effort will be expended in maintaining the system
after its development.
At the end of the interactions, schemes and equa-
tions of the tool were elaborated. Along with the pro-
totype, the generated artifacts enabled the definition
of business rules, functional requirements and the use
case diagram of the proposed system.
4 THE PUBLIC SERVICE COST
MODEL
In order to measure the cost of a service, the Brazil-
ian government employed an adaptation of the SCM,
called Public Service Cost Model, which consists in
estimating three expenses: (i) the cost for the citizen
to use the service, before and after the digital transfor-
mation (ii) the cost for the service manager to deliver
the service, before and after the digital transformation
and (iii) the investment to carry out the digital trans-
formation.
Bearing in mind that the transformation of ser-
vices is focused on the citizen, it’s essential to mea-
sure the cost of the service to the citizen. This implies
discovering all the activities that a citizen must per-
form to complete a given service, the target audience
of the service, the time spent to perform each activ-
ity necessary to conclude the service and the annual
number of requests for the service.
To estimate the costs to the citizen, it is consid-
ered that each service is composed of activities that
must be performed. Then, the estimation consists in
evaluating two costs:
• The time cost (TC), which is T × Q × R
m
, where
– T is the time required to perform each activity
of the service,
– Q is the total amount of users that need to use
the service along a period (a year, for example).
This is just the product of the average frequency
that one user demands the service during the
considered period, and the total amount of users
that require the service, and
– R
m
is the value given for each unity of time.
In the model, it is considered the average wage
income of a citizen per hour.
• The monetary cost (MC), which is C × Q, where
Q stands for the same in time cost and C is the
estimated cost of an activity of the service.
A remark on the activity cost estimation of a ser-
vice is in order. Although this is a subjective issue and
depends on the interpretation of the service manager
on how a service is performed, to define a minimum
scope, a service might be composed by four major
steps: (i) to search for service information, the step in
which the citizen understand how to use the service
and which are the mandatory documents or require-
ments, (ii) to collect and prepare the documents, the
step in which the citizen search for, prepare and orga-
nize all the requirements to apply to the service, (iii)
to require the service and deliver the documents, the
step in which the citizen formally require the service
and delivers all the documents and requirements to
achieve the goal aimed when performing the service,
and (iv) to receive the service, the step in which the
results of the service are delivered to the citizen.
For example, suppose a citizen applying to obtain
a driver’s license. In step (i), the citizen first searches
for all the requirements to obtain the license. For this,
the citizen may search on the web and even go to a
driving school to obtain further information. In step
(ii), the citizen try to meet all the requirements he
or she discovered in step (i), collecting all the doc-
uments generated when meeting the requirements. In
step (iii), the citizen formally requests the service and
delivers all of the documents to the agency responsi-
ble to issue the driver’s license. Finally, in step (iv),
the citizen receive the driver’s license or, if some re-
quirements are still missing, receives a communica-
tion of the fact. For this, the citizen may need to go to
the agency that issues the driver license, or the license
will be delivered by post.
The journey of the service user, as exemplified
above, generates a series of interaction costs that can
have quite different values if face-to-face activities are
required or if it is possible to perform them digitally.
To measure the difference between the two ways of
ICEIS 2022 - 24th International Conference on Enterprise Information Systems
446

obtaining the service, the Brazilian government uses
an Excel spreadsheet as a support tool where, once the
necessary parameters have been raised, the total cost
of the service for the citizen is calculated. A view on
this spreadsheet is depicted in Figure 3. As the tool
is not specific to this context, a spreadsheet is used
for each federal public agency, and the cost in time
of gathering information and making comparisons is
high. The correlation with ABC and SCM is clear
on this point: the models require interviews whose
analysis is complex due to the high number of data
collected.
Raising the necessary parameters involved in the
measurement is one of the biggest challenges. Cur-
rently, the service manager is not the responsible for
this task, but it’s recommended for them to be able to
do this, understanding all the necessary information
required and that verification of errors are not sup-
ported when computing costs from the given parame-
ters.
The other part of the measurement consists in
measuring the costs to the service provider, in two
senses: (i) the cost to deliver the service before and
after the digital transformation and (ii) the cost to per-
form the digital transformation of the service.
To measure the cost to deliver a service, some
points are essential to be analyzed.
• the personnel cost, considering all the labor cost
necessary to deliver the service,
• the physical space cost.
• the supplies cost, measuring all the spent supplies
during the service delivery process, such as paper,
• the infrastructure and information technology
cost, that every segment nowadays demands in-
vestments with computers, enterprise resource
planning systems, and websites,
• the training cost, employed to empower the staff,
and
• the maintenance cost.
Notice that all these costs may be potentially re-
duced with digital transformation. On the other hand,
the investment necessary to perform the digital trans-
formation consists in the total cost with analysis, tech-
nology and specialized team to transform the service.
Measuring services cost has two main purposes:
comparison and prioritization.
• Comparison: the cost for the citizen to carry out
a non-digitized service can be compared with the
cost of the same service when it is digital, bring-
ing savings information that assists in strategic de-
cision making.
• Prioritization: with the cost analysis of several
services in the same federal unit, it will be able
to prioritize which service to type first.
The following are the activities that are taken into
account when the service is priced.
• Identification and understanding of requirements
and changes; supplier identification
• Generation, preparation (calculation) and verifica-
tion information according to the procedure
• Internal meetings between employees involved in
the compliance process
• Preparation and presentation of reports; filling and
sending forms
• Meetings, tests, inspections, external agents, pub-
lic or private, waiting times and time dedicated to
making payments
• Mobilization of virtual applications for public or
private offices, waiting times and time dedicated
to making payments
• Copy, distribute and report files
• Receiving and understanding information, re-
quests and responses
• Meetings, tests, inspections, external agents, pub-
lic or private (lawyers, auditors, inspectors, etc.)
• Copy and distribute file information
• Receive and understand information, requests,
and information answers
• Fees
• Other costs
• Substantive costs
• The costs of waiting for responses (opportunity
cost)
To better understand the proposed strategy of cost
estimation, let us consider as example a service of re-
ceiving a research grant at a public Brazilian univer-
sity. We consider that 2,500 users require this service
per year. Recalling that we intend to estimate costs
for the user, costs for the service manager and invest-
ment costs, let us start from the costs estimation for
the user. We first identify the activities into the four
steps previously cited. We consider
1. to search for service information through (a) the
web, (b) the university campus, and (c) telephone;
2. to collect and prepare documents we consider (a)
collecting documents and (b) filling out forms;
3. to require the service and deliver documents
through (a) the university campus, (b) internet,
and (c) telephone/fax;
The Design of a Public Service Cost Model Tool to Evaluate Digital Transformation in Brazilian Government
447
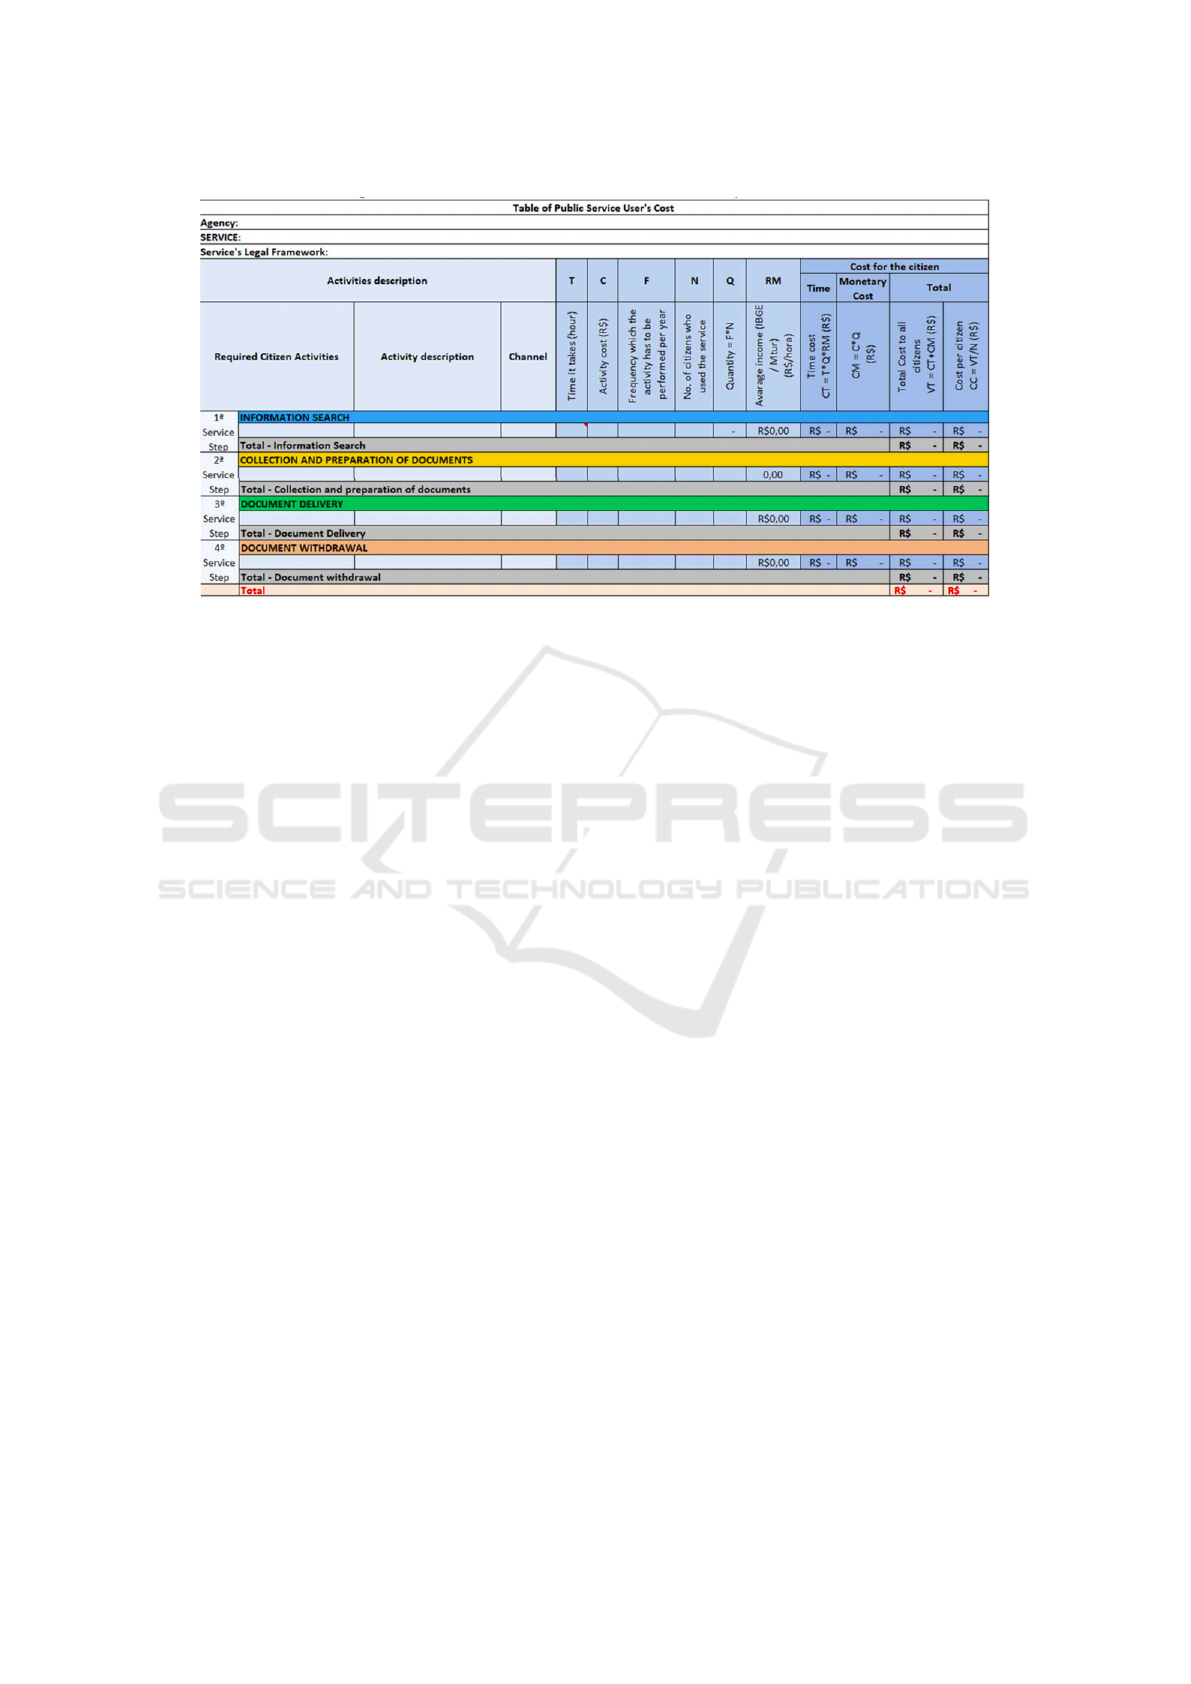
Figure 3: A view of the currently in use spreadsheet to estimate the costs to the citizen.
4. to receive the service (a) in the university campus,
(b) through e-mail, and (c) through telephone/fax.
For each activity, we estimate: (i) how much time
(in hours) an activity requires (T), (ii) the cost (in
BRL, C), and (iii) the amount of users that perform
the step using the activity (Q). The value for each
unity of time considered is 18.75 BRL, that in our
case represents the hourly wage of the professional
allocated to perform the task for the user. The estima-
tion of pre and post-transformation costs, according to
the Brazilian Ministry of Economy, are detailed in Ta-
bles 1 and 2. The total cost for the user is 479,155.31
BRL before and 381,943.28 BRL after digital trans-
formation. Therefore, in this case, digital transforma-
tion may cause a savings of 97,212.03 BRL, approx-
imately 20%. As can be seen from tables 1 and 2,
the costs of the second step have hardly changed. For
this particular transformation, it would be necessary
to discuss whether the service itself could offer sim-
plification of the amount of documents required. But
this is something that service managers must do. The
cost model also helps in the perception of the possi-
bilities for improving the service.
The other two estimations are simple and we will
omit the examples. Nonetheless, values adopted are
always obtained from reliable databases that compute
average values in Brazil.
5 RESULTS
The requirements elicitation led to a set of modules
that compose the tool. The modules identified were
(i) costs to users, (ii) costs to agency, (iii) investment
costs, (iv) dashboards and indicators, and (v) services
management.
Besides the modules, we identified three impor-
tant groups for the tool concept: the service, the users
and the government agency. The service concerns
data, steps, and activities. Data characterizes the ser-
vice, and is composed by information such as name,
responsible agency, coverage, goals, target audience,
average demand, and legal information). Steps and
activities are closely related and refer to the steps and
activities the citizen may execute to complete the ser-
vice. The users may be citizens, the service manager,
and the administrator, who manages all the tool and
information. Finally, the government agency is the
responsible to deliver the service.
To predict costs, we consider that a service has
three classes of costs: the costs for the citizen, the
costs for the agency and the investment costs. The
costs for the citizen are composed by the sum of the
costs of the steps, which in turn is composed by the
costs of their activities. To compute the cost of one
activity, we consider the number of users that request
the service in one year, the average time for the exe-
cution of the activity, the average income of the users
of the service per hour and the monetary cost of the
activity.
The costs for the agency take into account the hu-
man resources cost, the real estate cost, and the infras-
tructure and technology cost. The investment cost,
in turn, considers the people allocated to digitalize
the service and their average wage, and the average
time expected to complete the digitalization. An ad-
ditional cost may also be considered to cover unex-
pected costs. An scheme summary is depicted in Fig-
ICEIS 2022 - 24th International Conference on Enterprise Information Systems
448
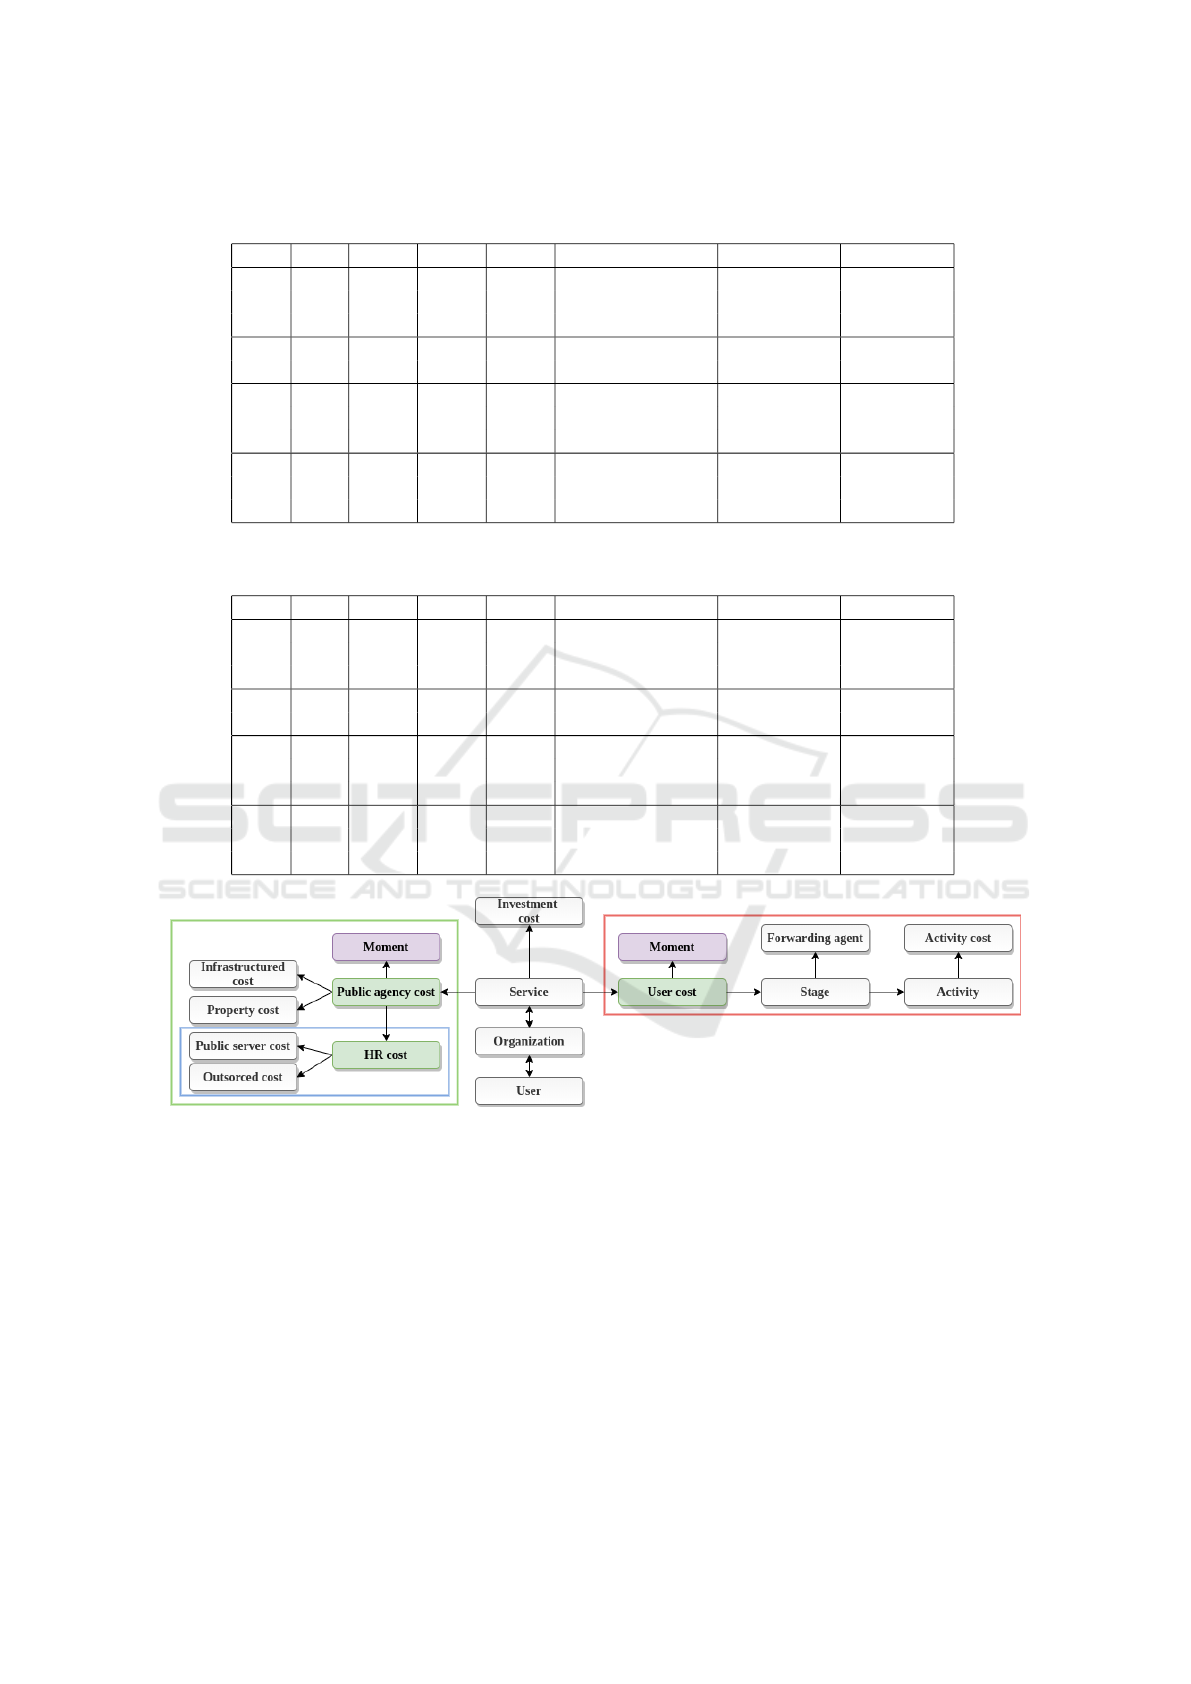
Table 1: Costs to user before digital transformation. The steps as well as the meaning of each column are in accordance with
the model presented in Section 4.
Step Act. T C Q TC (T × C × R
m
) MC (C × Q) Total
1
a 0.25 0.00 750 3,515.63 0.00 3,515.63
b 1.925 12.64 1,000 36,093.75 12,640.00 48,733.75
c 0.25 0.00 750 3,515.63 0.00 3,515.63
2
a 6 4.00 2,500 281,250.00 10,000.00 291,250.00
b 1.925 0.00 2,500 30,937.50 0.00 30,937.50
3
a 1.925 12.64 1,250 45,117.19 15,800.00 60,917.19
b 0.75 0.00 500 7,031.25 0.00 7,031.25
c 0.191 0.00 750 2,685.94 0.00 2,685.94
4
a 1.925 12.64 500 18,046.88 6,320.00 24,366.88
b 0.15 0.00 1,250 3,515.63 0.00 3,515.63
c 0.191 0.00 750 2,685.94 0.00 2,685.94
Table 2: Costs to user after digital transformation. The steps as well as the meaning of each column are in accordance with
the model presented in Section 4.
Step Act. T C Q TC (T × C × R
m
) MC (C × Q) Total
1
a 0.15 0.00 1,750 4,921.88 0.00 4,921.88
b 1.925 12.64 250 9,023.44 3,160.00 12,183.44
c 0.191 0.00 500 1,790.63 0.00 1,790.63
2
a 6 4.00 2,500 281,250.00 10,000.00 291,250.00
b 0.5 0.00 2,500 23,437.50 0.00 23,437.50
3
a 1.925 12.64 250 9,023.44 3,160.00 12,183.44
b 0.5 0.00 1,625 15,234.38 0.00 15,234.38
c 0.191 0.00 625 2,238.28 0.00 2,238.28
4
a 1.925 12.64 250 9,023.44 3,160.00 12,183.44
b 0.15 0.00 2,000 5,625.00 0.00 5,625.00
c 0.191 0.00 250 895.31 0.00 895.31
Figure 4: Scheme that represents the relevant structures for the application of the investment cost.
ure 4.
Figure 5 shows the service relationships to
the investment cost. Pre-transformation and post-
transformation have the same structure, with their re-
spective services that have data, stages and activities.
Each service can have n stages, which, in turn, may
contain m activities that represent the steps that must
be followed to perform a stage.
After digital transformation, these stages and ac-
tivities may potentially change itself in form and num-
ber. Each activity considers citizen’s actions that
involve time or monetary costs, such as displace-
ment, waiting (queues, response time), searching for
information about a service, payments, among oth-
ers, and therefore, costs are attributed to activities.
With these costs at hand, pre-transformation and post-
transformation costs are given as the sum of the activ-
ities’ costs that compose each stage of the service.
The tool was implemented using a client-server
architecture. With such architecture, all the services
the tool offers can be accessed easily by any other in-
terested and authorized part via application program-
ming interfaces (APIs). The architecture, as well as
technologies used in implementation, are shown in
The Design of a Public Service Cost Model Tool to Evaluate Digital Transformation in Brazilian Government
449
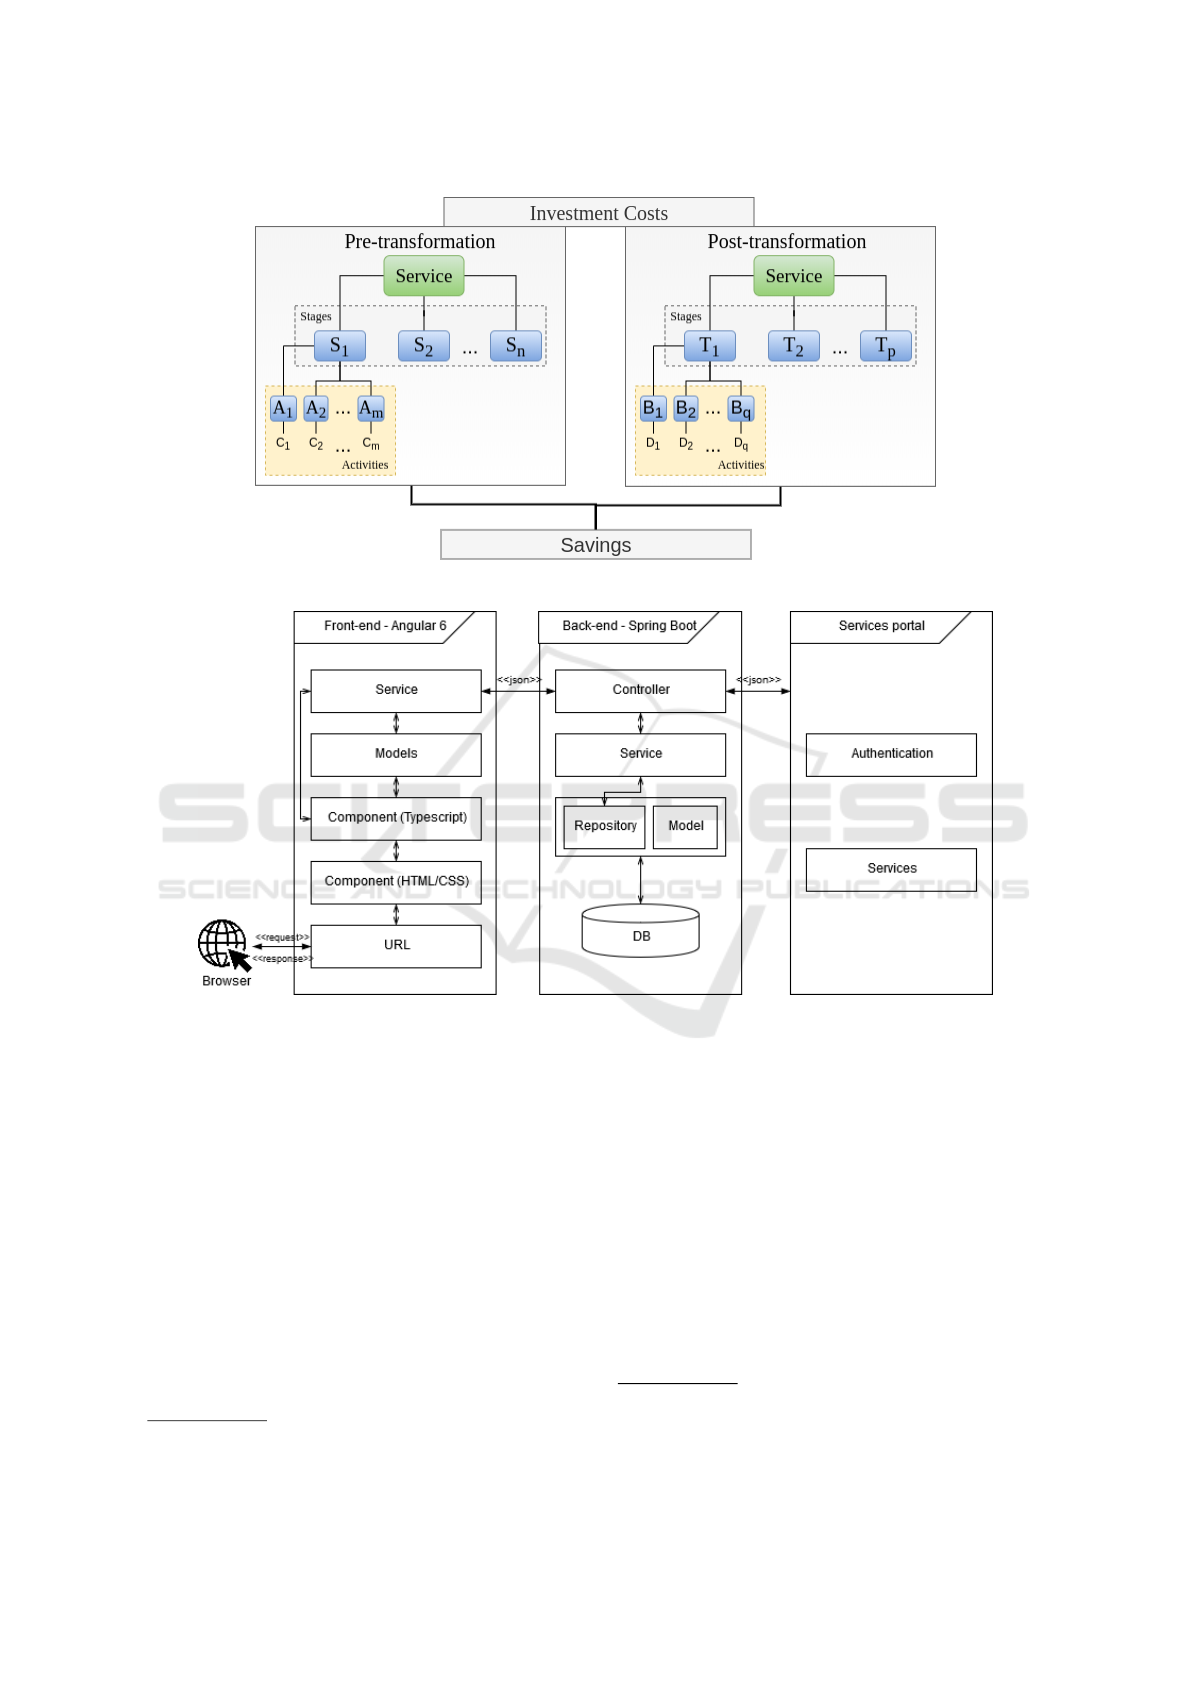
Figure 5: Scheme of pre- and post-transformation of service.
Figure 6: Client-server architecture of the cost model tool.
Figure 6. The interface of the tool consists in register-
ing the services, their execution stages and respective
activities of each stage.
Preliminary analysis by the government shows
that there are more than 2,000 potential services for
digital transformation in the Brazilian government
currently. The Ministry of Economy observed, in
the first half of 2019, in a set of 316 digital ser-
vices, which for each BRL 1 invested in the process
of digital transformation of services, an annual finan-
cial feedback of about BRL 12.19 is obtained by the
government, with 30 days return on investment. Fur-
thermore, bureaucracy was reduced by a time saving
of 59,891 hours annually.
Currently, the tool is being connected to LimeSur-
vey
2
to compute costs based on answers provided in
2
LimeSurvey (https://www.limesurvey.org) is a free and
the surveys. Such connection makes the tool more
accessible and easier-to-use. Furthermore, available
data on these surveys will enable the automated com-
putation of costs of more than 1,000 services.
6 DISCUSSION AND
IMPLICATIONS
In order to decide if a service may be digitalized or
not, many factors may be considered, but there is no
doubt that cost analysis is one of the most important
steps in the digital transformation process. Therefore,
open software to publish on-line surveys and, from these,
collect responses, generate statistics, and export data to
other applications.
ICEIS 2022 - 24th International Conference on Enterprise Information Systems
450

a tool to predict costs of a service is extremely rele-
vant in this context.
Some cost models can be found in the literature,
such as ABC, TDABC, and SCM. But these are the-
oretical frameworks that have no easy and systematic
application in practice but requires a deep study of
each service to develop a cost model. In the present
paper, we propose a tool that, although based on an
adaptation of the SCM, provide a systematic applica-
tion of a cost model, by which one can predict the
cost of a service without major difficulties and even
without previous knowledge of a cost model such as
the SCM. The connection with LimeSurvey, that is
being developed, represents a higher level of abstrac-
tion, which makes it even easier to apply the tool.
There are many public services offered by the
Brazilian government and coordinated by several ser-
vice managers in various locations in Brazil. Man-
agers are the ones who know about the service re-
quirements, and who are able to provide the informa-
tion needed to fulfill a cost model. However, complet-
ing a cost model demands some effort. In order to fa-
cilitate the cost measurement of a service, a form was
created in LimeSurvey. This form is able to abstract
the model to simple questions that, through treatments
and calculations, are able to fill the cost model, so
that managers can answer the form without a previous
study about the model used. These calculations take
into account the responses of the form and the con-
stant terms that have been studied and created through
valid references in Brazil.
With the automation of cost prediction, service
managers can focus in providing the service itself and
afterwards be aware of the economic savings digital-
ization may bring to the citizens and to their organi-
zations.
The impacts of these savings for both the govern-
ment and the population are very relevant. On the
one hand, the government can better reallocate its re-
sources and apply them to other areas, such as educa-
tion and health, which may improve a lot the popula-
tion’s quality of life. On the other hand, the ease of
access to execute essential services by the population
changes the commonly bureaucratic relation between
the citizen and the government. This means that, be-
sides the economic and time savings, the citizen sat-
isfaction may change positively with such actions.
Regarding the tool proposed in this work, it is im-
portant to note that it seeks to adapt to different con-
texts of digital transformation, but defining a scope
proposing steps and activities. Over the years, it is
known that the way the population interacts with its
government can change a lot, requiring the inclusion
of new stages and/or activities, in addition to modify-
ing some constants used for the calculations. Updat-
ing the constants is also supported by the tool, ensur-
ing the tool’s survival and usefulness over the years of
use, in one or more application contexts.
7 CONCLUSION AND FUTURE
WORK
In this paper, we provide the design of a tool to es-
timate the cost of public services both for govern-
ment and citizens. The aim of this tool, in the con-
text of digital transformation, to support the decision
on whether the transformation of a service is worth-
while. Using a prototyping strategy strongly sup-
ported by a requirements elicitation process, we pro-
pose the development of a tool that is based on the
classical SCM.
Our main contribution consists in providing a tool
that can estimate costs just based on predefined in-
formation that any service manager can supply, such
as personnel cost, physical space cost, supply cost,
among others (see Section 4), while classic cost mea-
suring models may require knowledge in specific
techniques of measuring costs itself. The Ministry of
Economy seeks to facilitate data collection to measure
the costs of services to be digitally transformed by the
Brazilian Government.
The tool presented in this article has brought this
facility and may generate measurable results in the
coming years. As future research, analysis of these
results is in order, besides further investigations of
ways that may facilitate the use of the cost model tool
as well as comparison with state-of-the-art tools and
prototypes used in costs evaluation presented in the
literature.
REFERENCES
Becker, J., Algermissen, L., and Falk, T. (2012). Moderniz-
ing processes in public administrations. Springer.
Bischofberger, W. R. and Pomberger, G. (2012).
Prototyping-oriented software development: Con-
cepts and tools. Springer Science & Business
Media.
Brasil, Presid
ˆ
encia da Rep
´
ublica (2016a). Decreto n. 8,638,
de 15 de janeiro de 2016: Pol
´
ıtica de governanc¸a dig-
ital.
Brasil, Presid
ˆ
encia da Rep
´
ublica (2016b). Decreto n. 8.936,
de 19 de dezembro de 2016: Plataforma de cidadania
digital.
Charalabidis, Y. and Askounis, D. (2010). eGOVSIM: A
Model for Calculating the Financial Gains of Govern-
mental Services Transformation, for Administration
The Design of a Public Service Cost Model Tool to Evaluate Digital Transformation in Brazilian Government
451

and Citizens. In Proceedings of the 43rd Hawaii In-
ternational Conference on System Sciences.
Fang, Z. (2002). E-government in digital era: concept, prac-
tice, and development. International journal of the
Computer, the Internet and management, 10(2):1–22.
Floyd, C. (1984). A systematic look at prototyping. In
Approaches to prototyping, pages 1–18. Springer.
Kaplan, R. S. and Anderson, S. R. (2007). Time-driven
activity-based costing: a simpler and more powerful
path to higher profits. Harvard business press.
Kutzner, K., Schoormann, T., and Knackstedt, R. (2018).
Digital transformation in information systems re-
search: a taxonomy-based approach to structure the
field.
Matei, A. I. and Matei, L. (2012). Reducing the admin-
istrative expenditures as source for increasing the ef-
ficiency of local governance under conditions of the
financial crisis. Proceedings” Century-long Efforts at
Improving Government Performance and Fighting the
Fiscal Crisis”, The American Society for Public Ad-
ministration, Eds.: Dong, K., Holzer, M., Zang, M,
pages 528–559.
Network, S. (2005). International standard costs manual:
Measuring and reducing administrative burdens for
businesses.
OECD (2014). Recommendation of the Council on Digital
Government Strategies. OECD.
Petersen, K., Gencel, C., Asghari, N., Baca, D., and Betz,
S. (2014). Action research as a model for industry-
academia collaboration in the software engineering
context. In Proceedings of the 2014 international
workshop on Long-term industrial collaboration on
software engineering, pages 55–62.
Torriti, J. and Ikpe, E. (2015). Administrative costs of regu-
lation and foreign direct investment: the standard cost
model in non-oecd countries. Review of World Eco-
nomics, 151(1):127–144.
Vial, G. (2019). Understanding digital transformation: A
review and a research agenda. The Journal of Strategic
Information Systems, 28(2):118–144.
ICEIS 2022 - 24th International Conference on Enterprise Information Systems
452
