
Relighting Backlight and Spotlight Images using the von Kries Model
Michela Lecca
a
Fondazione Bruno Kessler, Digital Industry Center, via Sommarive 18, 38123 Trento, Italy
Keywords:
Image Relighting, Image Enhancement, Backlight/Spotlight, von Kries Model.
Abstract:
Improving the quality of backlight and spotlight images is a challenging task. Indeed, these pictures include
both very bright and very dark regions with unreadable content and details. Restoring the visibility in these
regions has to be performed without over-enhancing the bright regions, thus without generating unpleasant
artifacts. To this end, some algorithms segment the image in bright and dark regions, re-work them separately
by different enhancing functions. Other algorithms process the input image at multiple scales or with different
enhancement techniques. All these methods merge the results together paying attention to the edge areas. The
present work proposes a novel approach, called REK and implementing a relighting technique based on the
von Kries model. REK linearly increases the channel intensities of the input image, obtaining a new brighter
image, which is then summed up to the input one with weights computed from the input image and taking
high values on the dark regions while low values on the bright ones. In this way, REK improves the quality
of backlight and spotlight pictures without needing for segmentation and multiple analysis, while granting
satisfactory performance at a computational complexity proportional to the number of image pixels.
1 INTRODUCTION
Good lighting is essential for capturing clear pictures.
Unfortunately, in some contexts, such important con-
dition is hard to meet. This is the case of environ-
ments with low light, backlight and spotlight. Under
low light, the acquired scene appears entirely dark,
while under backlight and spotlight the scene contains
both very bright and very dark regions. Precisely, in
the images with backlight, a foreground object is dis-
played against a very brilliant background, while in
the images with spotlight, the light source, which is
intense but not diffuse, is inside the acquired scene
and produces a very bright region, while the rest is
nearby black. In all these pictures, the content and the
details of the scene are unreadable and algorithms for
improving the quality of the dark areas are needed.
While several algorithms exist for low-light images,
e.g. (Lee et al., 2015), (Guo et al., 2017), (Lv et al.,
2018), (Kwok et al., 2018), (Wang et al., 2020), (Li
et al., 2020), (Wei et al., 2018), (Jiang et al., 2021),
(Guo et al., 2022), there are only few works on the
enhancement of backlight and spotlight images. The
main issue with these images is that the dark areas
must be reworked to increase their visual quality with-
out over-enhancing the bright ones. Some algorithms,
a
https://orcid.org/0000-0001-7961-0212
specifically designed for this task, segment the input
image in dark and bright region and enhance them
independently by different functions, e.g. (Ramirez
Rivera et al., 2012), (Li and Wu, 2018). The enhanced
regions are then merged together and the edge areas
are usually post-processed to prevent the formation
of undesired halos or artifacts. The use of different
enhancement functions for dark and bright areas en-
sures in general good results, that however strongly
depend on the segmentation. Multiscale Retinex ap-
proaches propose a different solution, not needing for
segmentation, e.g. (Petro et al., 2014), (Morel et al.,
2010), (Jobson et al., 1997). These algorithms pro-
cess the input image at multiple resolutions. At each
scale, the intensity of each pixel x is mapped onto a
new value based on the spatial distribution of a set
of colors sampled around x. The results obtained at
the various scales are averaged together, returning an
image where the details are preserved in the bright
regions and magnified in the dark ones. Neverthe-
less, the output image often presents halos around the
edges and the computational time of such algorithms
is usually high. A recent Retinex inspired bilateral fil-
ter for backlight and spotlight image enhancement has
been presented in (Lecca, 2021). This filter rescales
the color intensity of each pixel by a value depend-
ing both on spatial and intensity features of some pix-
226
Lecca, M.
Relighting Backlight and Spotlight Images using the von Kries Model.
DOI: 10.5220/0011107800003209
In Proceedings of the 2nd International Conference on Image Processing and Vision Engineering (IMPROVE 2022), pages 226-233
ISBN: 978-989-758-563-0; ISSN: 2795-4943
Copyright
c
2022 by SCITEPRESS – Science and Technology Publications, Lda. All rights reserved

els regularly sampled over the image. The algorithm
performs well, but in some cases the output images
appear washed out. Another approach is proposed in
(Wang et al., 2016), where three different enhanced
images are computed from the input one: in the first
image, the dark areas are over-enhanced, in the sec-
ond one the dynamic range of the bright regions is
compressed, while in the third one the contrast is im-
proved. The three images are smoothed by a Lapla-
cian operator to remove noise and halos, then they are
averaged together with weights controlling the over-
all brightness of the images. The results are generally
satisfactory, but in some cases the dark regions are
still quite dark.
The present work proposes a new algorithm,
which relights the dark areas of backlight and spot-
light regions without over-enhancing the bright ones
and without needing for segmentation and/or multi-
ple scale analysis. Relighting is performed based on
the von Kries model (Finlayson et al., 1994), (Lecca,
2014), i.e. by rescaling the channel intensities of the
input image by a factor α greater than 1, so that the
brightness of the dark areas increases. This relighted
image is summed up to the input one with weights de-
pending on the input brightness and having high (low,
resp.) values on the dark (bright, resp.) regions. This
combination of images increases the visibility of con-
tent and details of the dark areas, while preserves the
appearance of the bright areas. The parameter α is
tunable by the user, but here an unsupervised estima-
tion of α is also presented. The proposed algorithm,
called REK from the keywords RElight and von Kries,
has been tested on different backlight and spotlight
images, showing good performance also in compari-
son with other state-of-the-art methods.
2 THE PROPOSED METHOD
The original von Kries model, presented in (Kries,
1905), provides a description of the human chromatic
adaptation, which is the mechanism regulating the re-
sponses of the human vision system to varying view-
ing conditions, such as illumination. This adaptation
is strictly related to the color constancy, i.e. to the hu-
man capability to discount light effects from the ob-
served scene (Hirakawa and Parks, 2005). In com-
puter vision, the von Kries model has been adapted
to describe how the colors of a digital image changes
when the illumination under which the image is ac-
quired changes. Specifically, this model approximates
such a change by a linear diagonal transform of the
RGB triplets (Finlayson et al., 1993). In image pro-
cessing, this transform has been widely employed
for correcting color shifts of an image with respect
to a reference one, showing very good performance
(Berens and Finlayson, 2000), (Lecca and Messelodi,
2011), (Lecca, 2014).
Mathematically, let I be a color image and let I
0
, I
1
, I
2
be its color channels. Let x denote a pixel of I, and
let B be the brightness of I, i.e. the gray-level im-
age computed from I by averaging pixel-wise its three
color channels, i.e.:
B(x) =
1
3
2
∑
i=0
I
i
(x). (1)
The von Kries model states that any change of light
determines a rescaling of the values I
0
(x), I
1
(x), I
2
(x),
i.e. for any i = 0, 1, 2:
I
i
(x) → α
i
I
i
(x) (2)
where the coefficients α
0
, α
1
, α
2
are real values
strictly greater than zero. This model was origi-
nally devised for narrow band sensors, but it has been
proved to be a good approximation also for standard
sensors (Finlayson et al., 1994).
When α
0
= α
1
= α
2
:= α, the equation (2) de-
scribes a change of the image brightness, like that
caused by shadows. In particular, when α is greater
than 1, the image becomes brighter (i.e. the values of
B increase), while when α is smaller than 1, the image
becomes darker (i.e. the values of B decrease).
In agreement with this model, the algorithm REK
rescales the channel intensities of any input image I
by a parameter α > 1. This operation, which is per-
formed on the whole image I, enables improving the
visibility of content and details of the dark regions,
but at the same time it also increases the brightness
of the bright area, with the risk of saturating the col-
ors, removing edges and introducing unpleasant ar-
tifacts. To overcome this problem, REK combines
the relighted image I
α
with the input one through a
summation whose addends are weighted by values de-
pending on the brightness B of I and taking high val-
ues on the dark regions, while low values on the bright
ones. Thanks to these operations, REK improves the
visual quality of the dark regions, while preserves that
of the bright regions.
Operatively, REK works as follows. First, REK
maps I on a new image I
α
, obtained by relighting I
according to the von Kries model. Precisely, for each
pixel x, the color channels of I
α
are defined pixel by
pixel as follows:
I
α
i
(x) = αI
i
(x) (3)
with α > 1 and i = 0, 1, 2.
Second, REK combines the input image I with I
α
and
Relighting Backlight and Spotlight Images using the von Kries Model
227
(a) Image Enhancement by REK and other algorithms:
(b) Enlargement of the Top Left Corner:
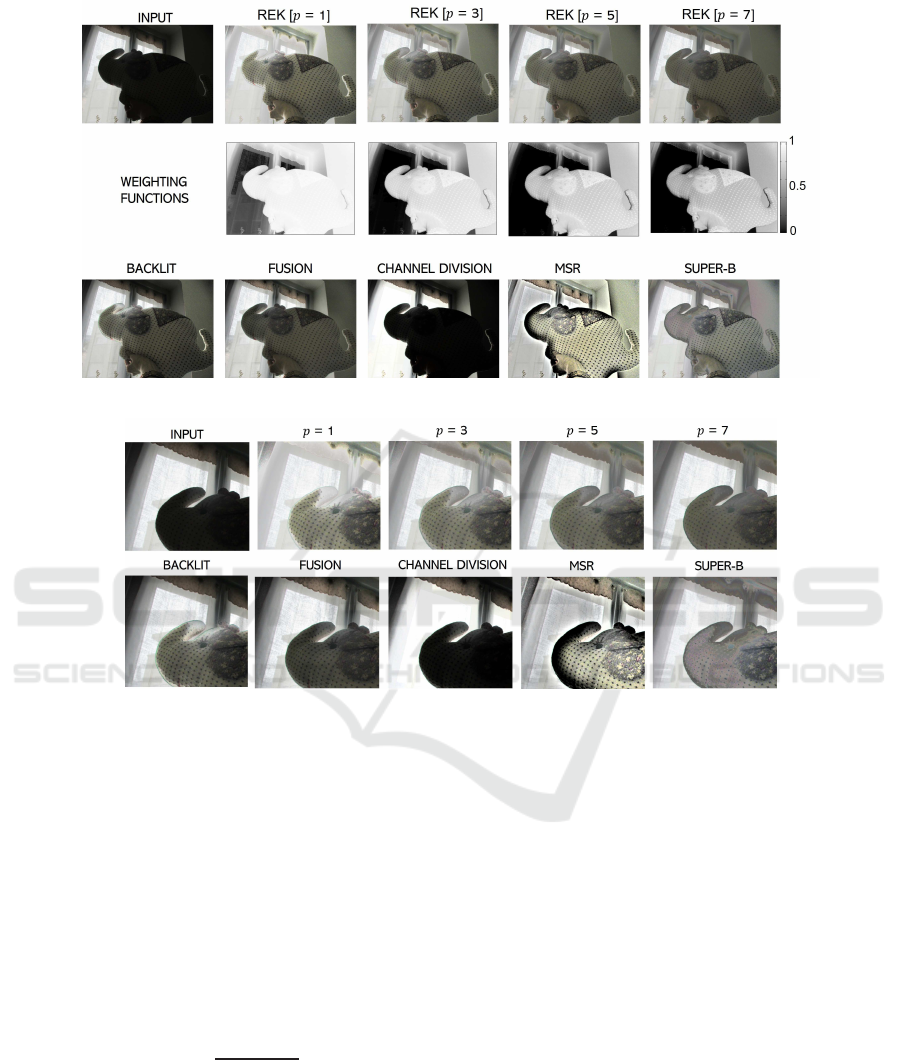
Figure 1: (a) On top, an image and its versions relighted by REK for p = 1, 3, 5, 7. In the middle: the weights corresponding
to the different values of p. On bottom: image enhancement by other algorithms (see text for more explanation). (b) An
enlargement of the top left corner of the input image and of its enhanced versions.
outputs a new, color image J, whose components J
i
(i
= 0, 1, 2) are computed pixel-by-pixel as follows:
J
i
(x) = (1− w(x))I
i
(x) + w(x)I
α
i
(x), (4)
where w is a weighting function, defined over the pix-
els of I, ranging over [0, 1], and taking high values on
the dark regions, while low values on the bright ones.
There exist different equations for w. In the cur-
rent implementation of REK, w is defined from B, pre-
cisely, for each pixel x:
w(x) =
1−
B(x) − m
B
M
B
− m
B
p
(5)
where m
b
and M
B
are respectively the minimum and
the maximum values of B and p is an integer number
greater or equal than 1. The value p = 0, that is not
considered here, is a special case, in which w is iden-
tically equal to the constant function 1. Therefore,
for p = 0, the input image does not contribute to the
computation of J and the output image is completely
defined by the von Kries transform.
Figure 1(a) shows in the first row an input image
and four versions of it improved by REK with p =
1, 3, 5, 7. The second row of the figure displays the
corresponding weighting functions: it is possible to
observe that the gap between the values of w on the
dark and bright regions increases with p. This means
that the contribution of the bright regions from I
α
de-
creases when p increases, so that the bright regions in
the output image J are very similar to those in the in-
put image, while the dark regions in the output image
are brighter than their counterpart in the input image.
3 EVALUATION
The performance of REK has been evaluated on two
datasets, called respectivelyPDB and SDB. PDB con-
IMPROVE 2022 - 2nd International Conference on Image Processing and Vision Engineering
228

sists of 20 real-world color images, that have been se-
lected from a personal collection of the author (’P’
stands for personal) and whose size range from 1580
× 1882 to 4160 × 3120 pixels. SDB contains 60 real
world color images with a lower resolution than those
of PDB (’S’ stands here for small): their size vary
from 102 ×76 to 432 × 576 pixels. SDB includes pic-
tures from Pixabay (https://pixabay.com), from some
datasets used to test image enhancement algorithms,
e.g. (Wang et al., 2016), (Li and Wu, 2018), (Ramirez
Rivera et al., 2012), and some images from PDB at
a low resolution. SDB was also employed to test
the backlight/spotlight image enhancer described in
(Lecca, 2021). In both the datasets, the images depict
indoor and outdoor environments, acquired under nat-
ural or artificial backlight and spotlight (see e.g. Fig-
ures 1 and 2).
The performance of REK has been evaluated by
analyzing three numerical features that are strongly
related to the human perception of the image quality
and are usually changed by enhancement. These fea-
tures are described here using the notation introduced
in Section 2:
The entropy of the color distribution (f
0
), which is de-
fined as the L
1
distance between the probability den-
sity function (pdf) of B and the uniform probability
density function over [0, 255];
The mean value of the image brightness (f
1
), i.e. the
mean value of B;
The standard deviation of the image brightness (f
2
),
i.e. the departure of the image brightness from f
1
.
The features f
0
, f
1
and f
2
measure respectively
the colorfulness, the brightness level and the contrast
of the image I. These features usually change after
enhancement, but their behaviour is expected to be
different when they are computed on the bright re-
gions, on the dark regions and on the whole image.
Precisely, on the bright regions, where the visibility
of details and content are generally already good, f
0
,
f
1
and f
2
are expected to remain stable or change
slightly. In general, it may happen that the value of
f
1
increases slightly, consequently the histogram of B
on these regions becomes more peaked while the con-
trast diminishes because of saturation effects, i.e. f
0
increases and f
1
decreases. On the contrary, on the
dark regions, f
1
and f
2
are both expected to increase,
meaning that the areas become brighter and more con-
trasted, while f
0
is expected to decrease, since the en-
hancement tends to stretch the color distribution. Fi-
nally, on the whole image, f
1
is expected to increase,
because the dark regions are brighter, while f
2
is ex-
pected to remain unchanged or to decrease slightly. In
fact, brightening the dark regions decreases the con-
trast between the dark and the bright regions of the
original backlight/spotlightimage, that is usually very
high. Consequently, the mean value of f
2
over the
whole image generally decreases. Nevertheless, the
exact behaviour of f
2
depends on the content of the
dark regions: in fact, in case the dark regions contain
very high color variations, the global value of f
2
may
even increase. Moreover, it is to note that in the back-
light and spotlight images, the pdf of B is bimodal,
with the left and the right peaks correspondingrespec-
tively to the dark and bright regions. Brightening the
dark areas stretches the left peak toward the right one
and this diminishes the value of f
0
over the whole im-
age.
To capture these different trends, the values of the
measures listed above are here computed separately
on the whole image and on their bright and dark ar-
eas and indicated respectively with f
i
s, f
b
i
s and f
d
i
s.
To this purpose, the dark regions P
d
and the bright
regions P
b
of the input image I are detected by a seg-
mentation procedure that partitions B using a thresh-
old τ. Specifically:
P
d
= {y ∈ D(I) : B(x) ≤ τ} (6)
P
b
= {y ∈ D(I) : B(x) > τ} (7)
where D(I) is the set of pixels of I and
τ =
M
B
− m
B
2
. (8)
Finally, it is to note that, for a fair assessment of
the performance of an enhancement algorithm, a sin-
gle measure does not suffice. In fact, for example,
a very high value of brightness may correspond to a
saturated image, and thus to a loss of details and to
a peaked distribution. Therefore, all the features de-
scribed above, computed on the whole image or on its
parts, must be considered simultaneously in the eval-
uation process.
The performance of REK has been evaluated also
in comparison with the methods FUSION (Wang
et al., 2016), BACKLIT (Li and Wu, 2018) CD
(Ramirez Rivera et al., 2012), SuPeR-B (Lecca, 2021)
and MSR (Petro et al., 2014), briefly described in
Section 1. For the comparative analysis, the codes
provided by the authors and/or available on the net
on GiThub (FUSION and BACKLIT) and MatLab
(MSR) repositories have been employed, within the
parameters set as per default. For SuPeR-B, the num-
ber of pixels sampled over the images and the other
three parameters, have been fixed respectively to 100
and zero (see (Lecca, 2021) for more details).
Regarding REK, the experiments have been re-
peated for different values of p, i.e. p = 1, 3, 5, 7.
It is to note that, the parameter α must be chosen to
prevent the intersection of the brightness distribution
curves around the peaks correspondingto the dark and
Relighting Backlight and Spotlight Images using the von Kries Model
229
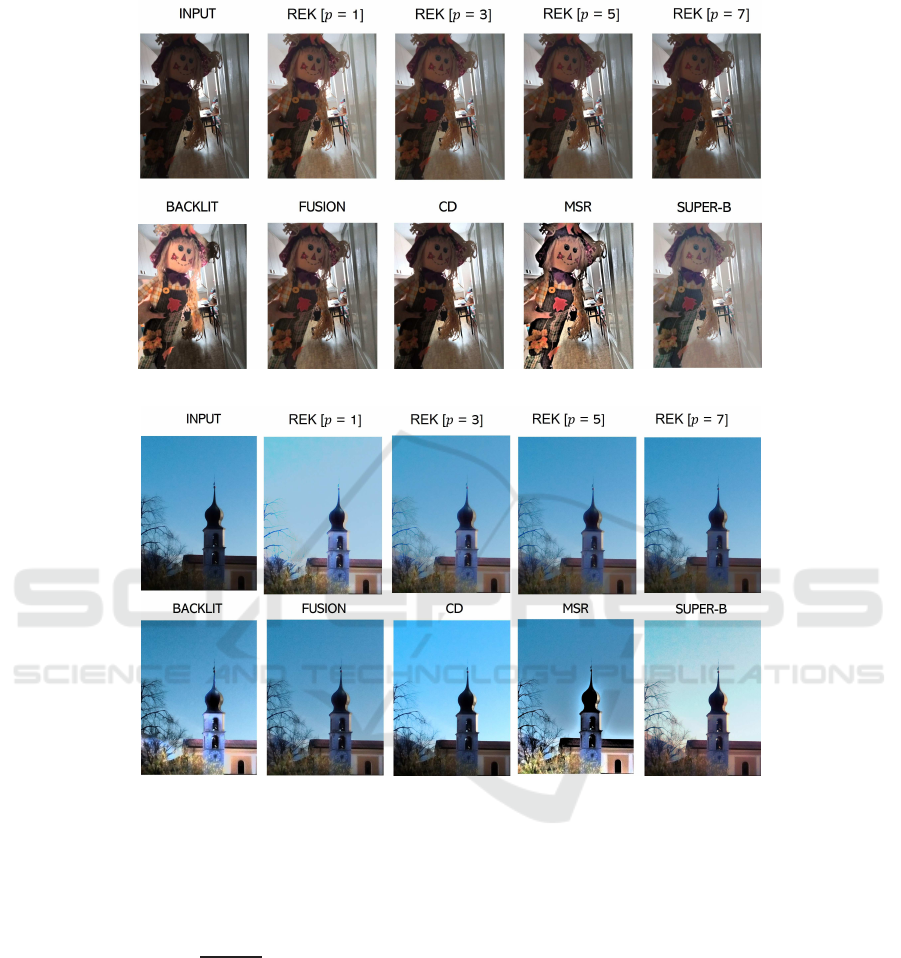
(a) Enhancement of an Indoor Backlight Image.
(b) Enhancement of an Outdoor Backlight Image.
Figure 2: Examples of backlight/spotlight image restoring by REK with different values of p and by other enhancers.
to the bright areas: violating this prescription may
cause the loss of the boundaries between the dark and
bright areas, worsing the global quality of the image.
To avoid this undesired effect, here α has been set as:
α =
µ
B
− δ
B
µ
D
, (9)
where µ
B
and δ
B
are respectively the mean value and
the standard deviation of B over P
b
, and µ
D
is the
mean value of B over P
d
. Of course, it is supposed that
µ
D
> 0, i.e. the dark region is not uniformly black.
4 RESULTS
Tables 1 and 2 report the mean values of the objec-
tive measures f
i
s, f
b
i
and f
d
i
computed on the datasets
PDB and SDB. On both the datasets and for any value
of p, REK effectivelyimproves the quality of the dark
images, but the best results are obtained for p = 3
and p = 5. In fact, for these values the bright re-
gions are slightly modified, while the dark ones are re-
markably improved, reporting a much higher bright-
ness and contrast, while a lower entropy of the bright-
ness distribution. Globally, the input image is bright-
ened, while its contrast decreases because, as dis-
cussed in Section 3, after the enhancement, the dif-
ference between the dark and the bright regions di-
minishes. Consequently, the entropy of the brightness
distribution is lower and the pdf is more uniform: usu-
ally, this means that the range of colors in the image
has been widened and the image appears more pleas-
ant. On the contrary, for p = 1, the bright regions are
over-enhanced. their brightness increases very much,
IMPROVE 2022 - 2nd International Conference on Image Processing and Vision Engineering
230

Table 1: Evaluation of REK in comparison with other enhancers on the dataset PDB.
Algorithm f
0
f
1
f
2
f
b
0
f
b
1
f
b
2
f
d
0
f
d
1
f
d
2
[×10
−3
] [×10
−3
] [×10
−3
]
INPUT 4.16 71.00 65.89 4.93 197.76 31.45 5.12 33.86 25.88
BACKLIT 2.40 109.96 63.91 4.73 199.33 29.55 2.70 86.50 52.10
MSR 2.54 126.87 58.98 4.65 183.57 29.83 2.51 108.93 57.26
CD 4.07 89.46 79.97 6.13 235.28 17.29 4.34 45.00 40.87
FUSION 3.33 95.77 58.76 4.84 203.06 29.19 4.21 64.82 30.46
SuPeR-B 3.06 127.62 58.69 5.47 217.29 24.19 3.78 97.32 38.11
REK [p = 1] 3.54 134.21 63.81 6.11 214.63 18.14 3.48 110.89 57.16
REK [p = 3] 3.48 114.95 55.87 5.18 199.94 28.89 4.31 90.22 39.35
REK [p = 5] 3.72 105.23 55.12 4.98 198.02 31.04 4.77 77.79 30.79
REK [p = 7] 3.94 98.97 55.79 4.94 197.76 31.44 4.99 69.50 26.44
Table 2: Evaluation of REK in comparison with other enhancers on the dataset SDB.
Algorithm f
0
f
1
f
2
f
b
0
f
b
1
f
b
2
f
d
0
f
d
1
f
d
2
[×10
−3
] [×10
−3
] [×10
−3
]
INPUT 4.17 67.79 64.13 4.92 179.33 28.56 5.26 29.74 28.00
BACKLIT 2.78 100.65 65.67 4.68 189.30 29.14 3.47 73.26 51.58
MSR 2.21 118.12 61.97 4.69 185.23 27.82 2.35 97.24 58.55
CD 4.04 89.45 83.03 5.86 228.30 18.82 4.53 41.49 44.58
FUSION 3.23 89.54 60.81 4.84 189.51 26.62 4.22 56.82 34.50
SuPeR-B 3.17 119.31 64.77 5.51 213.03 21.25 3.95 84.12 41.38
REK [p = 1] 3.80 122.76 68.53 6.24 204.04 14.21 3.76 97.15 63.13
REK [p = 3] 3.51 103.75 57.55 5.23 182.86 25.44 4.35 78.60 44.68
REK [p = 5] 3.61 95.29 55.36 4.98 179.80 28.03 4.72 67.98 35.80
REK [p = 7] 3.76 90.21 55.18 4.92 179.34 28.54 4.90 61.10 31.13
their brightness histogram become more peaked, and
their contrast decreases, meaning that some edges are
lost. An example of these effects is shown in Fig-
ure 1, where the elephant’s trunk becomes almost
white and its final part tends to disappear (see Fig-
ure 1(b)), getting worse the quality of the entire im-
age. It is to note that an excessive brightening may
introduce artifacts also in the dark areas, as illustrated
in Figure 2(b). Here, the image obtained for p = 1
presents some bluish halos on the bell tower, while
the branches of the tree are poorly visible. For p = 7,
the bright regions after enhancement are highly simi-
lar to the input one, while the dark regions have still
a low contrast, very close to that of the input images.
This means that the enhancement poorly improved the
visibility of the details in the dark areas. As already
observed in Section 2, these results are due to the dif-
ferent shape of the function w.
From the comparative analysis of REK with other
methods, it results that CD often returns images where
the dark regions are still quite dark, while the contrast
of the bright regions is significantly reduced. MSR
returns very good values of the f
i
s, f
b
i
s and f
d
i
, but
a qualitative inspection of the images showed that
the MSR images are poorly natural and look as car-
toonized, with strong, thick edges between the dark
and the bright regions. BACKLIT performs quite
well, but sometimes generates undesired artifacts, like
the halos visible on the bell tower of Figure 2(b)
and the greenish, thin boundary around the elephant’s
trunk in Figure 1(b). SuPeR-B works generally well,
but on average the edges in the bright regions are
quite attenuated and, despite the visibility of the con-
tent and details is generally good, the global image
appears often washed out. FUSION provides satis-
factory results, but the improvement of the dark re-
gions is less than that performed by REK. From the
theoretical point of view, REK behaves similarly to
FUSION, because both these methods merge images
with different enhancement levels. Nevertheless, FU-
SION has an higher computational complexity since
it computes three different enhancement versions of
the input image and requires smoothing operations,
while REK computes only one new image, i.e. that
relighted by the von Kries model, and does not need
for further processing.
Relighting Backlight and Spotlight Images using the von Kries Model
231

5 CONCLUSIONS
The experiments described in Section 4 show that al-
gorithm REK is a new, computational efficient back-
light/spotlight image enhancer, outperforming other
algorithms in the state-of-the-art. This result is ob-
tained by up-scaling the channel intensities of the in-
put image by the von Kries transform and blending
the relighted image with the input one. In this op-
eration the choice of the up-scaling factor α and of
the weighting function w is crucial. In particular, the
value of α must prevent over-enhancement effects as
well as the removal of important edges, while w must
grant simultaneously the improvement of the visibil-
ity of the dark regions and the fidelity of the bright
regions to the original versions. The unsupervised es-
timate of α and the choice of an exponential function
of the image brightness for w proposed here havebeen
demonstrated to work well, especially when the expo-
nent of w is equal to 3 and 5. In particular, for p = 3,
after enhancement, the appearance of the bright re-
gions is preserved, while on average, the values of the
brightness and the contrast of the dark regions are in-
creased by 165% and 56% with respect to their origi-
nal values, while the color distribution entropy is de-
creased by 16.6%. Although these results are good,
future research will investigate alternativechoices, es-
pecially for the value of α. This latter currently re-
lies on the analysis of the bimodal density function of
the input brightness, but other possible choices could
be considered also the weight w. Moreover, it is to
note that the level of enhancement could be also made
dependent on the application scenario, e.g. making
the pictures more pleasant for entertainment, enabling
visual inspection or computer vision tasks requiring
high detail visibility, as for instance unsupervised im-
age description and matching.
REFERENCES
Berens, J. and Finlayson, G. (2000). Log-opponent chro-
maticity coding of colour space. In 15th Int. Confer-
ence on Pattern Recognition, volume 1, pages 206–
211 vol.1, Barcelona, Spain.
Finlayson, G. D., Drew, M. S., and Funt, B. V. (1993). Di-
agonal transforms suffice for color constancy. In 4th
Int. Conference on Computer Vision, pages 164–171,
Berlin, Germany. IEEE.
Finlayson, G. D., Drew, M. S., and Funt, B. V. (1994).
Color constancy: generalized diagonal transforms suf-
fice. JOSA A, 11(11):3011–3019.
Guo, S., Wang, W., Wang, X., and Xu, X. (2022). Low-light
image enhancement with joint illumination and noise
data distribution transformation. The Visual Com-
puter, pages 1–12.
Guo, X., Li, Y., and Ling, H. (2017). LIME: Low-light
image enhancement via illumination map estimation.
IEEE Transactions on Image Processing, 26(2):982–
993.
Hirakawa, K. and Parks, T. W. (2005). Chromatic adapta-
tion and white-balance problem. In IEEE Int. Confer-
ence on Image Processing, volume 3, pages III–984,
Genova, Italy. IEEE.
Jiang, Z., Li, H., Liu, L., Men, A., and Wang, H. (2021). A
switched view of Retinex: Deep self-regularized low-
light image enhancement. Neurocomputing, 454:361–
372.
Jobson, D. J., Rahman, Z.-u., and Woodell, G. A. (1997). A
multiscale Retinex for bridging the gap between color
images and the human observation of scenes. IEEE
Transactions on Image processing, 6(7):965–976.
Kries, J. (1905). Die Gesichtsempfindungen. Nagel’s Hand-
buch der Physiologie des Menschen, 3:109.
Kwok, N., Shi, H., Peng, Y., Wu, H., Li, R., Liu, S., and
Rahman, M. A. (2018). Single-scale center-surround
Retinex based restoration of low-illumination images
with edge enhancement. In 9th Int. Conference on
Graphic and Image Processing, volume 10615, page
106152R, Mandi, India. Int. Society for Optics and
Photonics.
Lecca, M. (2014). On the von Kries model: Estimation,
dependence on light and device, and applications. In
Celebi, M. E. and Smolka, B., editors, Advances in
Low-Level Color Image Processing, pages 95–135.
Springer Netherlands, Dordrecht.
Lecca, M. (2021). A Retinex inspired bilateral filter for
enhancing images under difficult light conditions. In
VISIGRAPP (4: VISAPP), pages 76–86, Virtual Con-
ference.
Lecca, M. and Messelodi, S. (2011). Von Kries model un-
der Planckian illuminants. In International Confer-
ence on Image Analysis and Processing, pages 296–
305, Ravenna, Italy. Springer.
Lee, S., Kim, N., and Paik, J. (2015). Adaptively partitioned
block-based contrast enhancement and its application
to low light-level video surveillance. SpringerPlus,
4(1):1–11.
Li, S., Cheng, Q. S., and Zhang, J. (2020). Deep multi-path
low-light image enhancement. In IEEE Conf. on Mul-
timedia Information Processing and Retrieval, pages
91–96, Shenzhen, Guangdong, China.
Li, Z. and Wu, X. (2018). Learning-based restoration of
backlit images. IEEE Transactions on Image Process-
ing, 27(2):976–986.
Lv, F., Lu, F., Wu, J., and Lim, C. (2018). MBLLEN:
Low-light image/video enhancement using cnns. In
British Machine Vision Conference, page 220, New-
castel, UK.
Morel, J. M., Petro, A. B., and Sbert, C. (2010). A PDE
formalization of Retinex theory. IEEE Transactions
on Image Processing, 19(11):2825–2837.
Petro, A. B., Sbert, C., and Morel, J.-M. (2014). Multiscale
Retinex. Image Processing On Line, pages 71–88.
Ramirez Rivera, A., Byungyong Ryu, and Chae, O.
(2012). Content-aware dark image enhancement
IMPROVE 2022 - 2nd International Conference on Image Processing and Vision Engineering
232

through channel division. IEEE Transactions on Im-
age Processing, 21(9):3967–3980.
Wang, Q., Fu, X., Zhang, X., and Ding, X. (2016). A fusion-
based method for single backlit image enhancement.
In IEEE Int. Conference on Image Processing (ICIP),
pages 4077–4081, Phoenix, Arizona, USA.
Wang, W., Wu, X., Yuan, X., and Gao, Z. (2020). An
experiment-based review of low-light image enhance-
ment methods. IEEE Access, 8:87884–87917.
Wei, C., Wang, W., Yang, W., and Liu, J. (2018). Deep
Retinex decomposition for low-light enhancement. In
British Machine Vision Conference, Newcastle, UK.
Relighting Backlight and Spotlight Images using the von Kries Model
233
