
Low-emission Commuting with Micro Public Transport: Investigation of
Travel Times and CO
2
Emissions
Marcel Ciesla
1
, Victoria Oberascher
1
, Sven Eder
1
, Stefan Kirchweger
2
, Wolfgang E. Baaske
2
and Gerald Ostermayer
1
1
Research Group Networks and Mobility, University of Applied Sciences Upper Austria, Austria
2
Studienzentrum f
¨
ur internationale Analysen (STUDIA), Schlierbach, Austria
https:// nemo.f h-hagenberg.at/ ,
https:// www.studia-austria.com/
Keywords:
Micro Public Transport System, Microscopic Traffic Simulation, Sustainable Mobility.
Abstract:
The omnipresent trend towards sustainable mobility is a major challenge, especially for commuters in rural
areas. The use of micro public transport systems is expected to significantly reduce pollutant emissions, as
several commuters travel the first mile together with a single pick-up bus instead of their own car. In this paper,
different aspects of such a micro public transport system are analyzed. The main findings of the investigations
should be how the travel times of commuters change and how many CO
2
emissions can be saved if some of
the commuters use public transport instead of their own vehicle.
1 INTRODUCTION
Mobility in rural areas is strongly influenced by indi-
vidual traffic. Public transport is usually insufficient
to meet commuter demands. The disadvantages for
commuters are that public transport is mostly based
on fixed stops, which means that they have to cover
a way to a bus stop first. In addition, schedules of
buses and trains are usually predefined, which means
that individual commuters’ needs may not be met.
There are two different options for commuters to get
to work. On the one hand, they can cover the en-
tire route by public transport. Since stops such as bus
stops are in many cases too far away to be reached on
foot or by bike, the first distance to a train station can
be covered with an own vehicle. This creates the so-
called first-and-last-mile problem. However, since
this is still too much of a hassle for many commuters,
they drive the entire distance to work with their own
vehicle. For the region, this means very heavy traffic
at peak times on the commuter routes. This ultimately
leads to traffic jams, time delays and increased carbon
dioxide emissions. These problems can be counter-
acted by using a suitable micro public transport sys-
tem for the commuters’ first mile. People who want to
get to work are collected by one or multiple buses and
brought to a train station. Afterwards, they can use a
train to get to their place of work. It is expected that
with such a micro public transport system emissions
can be reduced and fewer traffic jams occur due to the
reduced commuter routes.
This paper deals with an approach to investigate
the travel times and carbon dioxide emissions of a mi-
cro public transport system mentioned before. The re-
mainder of this paper is organized as follows. At the
beginning it is explained how the examinations were
carried out. Afterwards, existing literature is reviewed
which serves as the basis for our work. The next sec-
tion describes the simulation setup which was used to
perform simulations for different scenarios. The re-
sults of these simulations are presented in the follow-
ing section. This section points out whether a micro
public transport system is suitable for sparsely pop-
ulated areas. In addition, a comparison between in-
dividual transport and micro public transport is made,
which shows how much CO
2
can be saved when com-
muters use a micro public transport system.
2 METHODS
Existing micro public transport systems cannot sat-
isfy the dynamic requirements of commuters and are
therefore only hardly accepted. Therefore, the main
objective of the project EBIM-
¨
OV (”Low-emission
commuting with intelligent micro public transport”)
was to investigate a micro public transport system for
Ciesla, M., Oberascher, V., Eder, S., Kirchweger, S., Baaske, W. and Ostermayer, G.
Low-emission Commuting with Micro Public Transport: Investigation of Travel Times and CO2 Emissions.
DOI: 10.5220/0011103500003191
In Proceedings of the 8th International Conference on Vehicle Technology and Intelligent Transport Systems (VEHITS 2022), pages 143-151
ISBN: 978-989-758-573-9; ISSN: 2184-495X
Copyright
c
2022 by SCITEPRESS – Science and Technology Publications, Lda. All rights reserved
143

a sparsely populated area. An important aspect of this
project was to figure out the benefits of micro pub-
lic transport, where commuters share a bus with other
commuters to overcome the first mile to a train sta-
tion. Another focus was to find out to what extent
commuters’ travel times change using micro public
transport, which has a strong influence on user accep-
tance. The base goals of the project can be divided
into following sub-goals:
• Mathematical Modelling of the Optimization
Problem: A sub-goal of the project was the real-
istic mathematical modelling of the optimization
problem for the control of a ride service. The
problem is to pick up customers from any loca-
tion and bring them to a given destination, which
is a train station. The optimization task consists
in falling below a travel time that is acceptable for
the user under very dynamic conditions. These
conditions include different traffic situations and a
varying number of customers with different pick-
up points who are to be served by the system. The
departure times of the desired train line play a par-
ticularly important role, as these times are deci-
sive for when the commuters should arrive at the
station.
• Route Control: With the help of mathematical
modelling of the problem, an algorithm was de-
veloped that dynamically controls a vehicle fleet.
This vehicle fleet consists of several buses with
predefined capacities that are intended to satisfy
the various pick-up requests. The task of the al-
gorithm is to choose optimal routes and departure
times of the buses so that the optimization criteria
are met as good as possible.
• Traffic Simulation: Microscopic traffic simula-
tions are used to validate the developed control
algorithm. The focus is on determining the poten-
tial for saving carbon dioxide emissions and com-
paring travel times between individual transport
and a micro public transport system for different
scenarios.
Through the above-mentioned sub-goals, a system
was created with the goal of simulating an intelligent
micro public transport system. With the help of mi-
croscopic traffic simulations, scenarios were exam-
ined in which commuters get to their workplaces in-
dividually with their own vehicle and with the micro
public transport system. The mathematical modelling
of the optimization problem ensures that the routes of
the pick-up buses are optimally chosen so that their
total travel time is minimized and commuters’ indi-
vidual time constraints are satisfied. This has the ef-
fect of increasing commuter acceptance of a micro
public transport system. When designing the simu-
lations, the focus was placed on one train line per sce-
nario. This means that only those commuters who
want to catch the same train will be considered. It
is not possible for a pick-up bus to serve commuters
with different preferred train lines, as the different
train lines are usually quite far apart in relation to
the departure times and the commuters’ travel times
would therefore suffer as a result.
3 RELATED WORK
The ideal chemical reaction of fuel combustion cham-
ber produces carbon dioxide and water and, as a result
of the transient combustion process, additional com-
bustion products. Consequently, fuel design holds a
big potential for further improvements in reduction of
unwanted combustion products (
¨
Uberall et al., 2015).
However, as long as one is not willing to completely
change the method of transportation using internal
combustion engines, carbon dioxide (CO
2
) emission
is always unavoidable. As a consequence CO
2
takes
about 65% of the total greenhouse gas emissions,
where the transportation sector currently contributes
20 -25% of global CO
2
emissions with its global share
estimated to rise to 30-50% by 2050 (Yang et al.,
2019).
At first sight one might think that alternative fuel
vehicles such as all-electric and fuel cell vehicles will
be the best solution to reduce CO
2
emissions. These
fall into the category of cleaner vehicle strategies re-
ducing emission rates per vehicle-kilometre. How-
ever, according to (Litman, 2017), efficient and alter-
native fuel vehicles only provide a few benefits, and
by increasing total vehicle travel tend to exacerbate
problems such as congestion, accidents and sprawl.
Moreover one should be aware of the fact that for such
vehicles one has always to take into account the full
life time cycle (manufacturing, use of the vehicle, end
of life, and recycling) (Mar
´
ın and De Miguel Perales,
2021). Mobility management, i.e. strategies which
reduce total vehicle travel, provides far more benefits.
Eco-driving, a term used for driving assistance
techniques that support the driver in optimizing route
choice and driving behavior, is a cleaner vehicle strat-
egy which is suggested in (Engelmann et al., 2020). In
their study they incorporate a vehicle dynamic based
CO
2
emission model and a Pareto-optimal based rout-
ing approach and discuss the benefit trade-off be-
tween travel time and emission in a simulation study.
Similarly (Engelmann et al., 2020) discusses emission
optimized routes in terms of NO
x
using the Graph-
Hopper API and OpenStreetMap. In all evaluated
VEHITS 2022 - 8th International Conference on Vehicle Technology and Intelligent Transport Systems
144
cases (Engelmann et al., 2020) there was no NO
x
-
optimized route found for which the estimated travel
time is less than with a speed-optimized route calcu-
lation and this is a general observation in eco-driving.
Shifting travelers’ travel mode from the private car
to public transport is another effective method of re-
ducing CO
2
emissions and easing traffic congestion
(Yoshida and Harata, 1996) belonging to the category
of mobility management. This was investigated in
(Yang et al., 2019) (Li and Tamura, 2003) for CO
2
emissions produced by commuters. To avoid an in-
crease in commuting CO
2
emissions in Chinese cities,
car use restrictions and transit priorities are the most
important traffic demand management measures to be
considered (Yang et al., 2019). Moreover (Li and
Tamura, 2003) describes a CO
2
emission forecasting
model for estimating the amount of CO
2
emissions
due to urban commute travel and analyses the effect of
two policy changes, cutting down public transport fee
and decreasing in-vehicle time, to shift commuters’
travel mode from private car to public transport.
Another way as is done in this work is to provide
additional service feeder buses which operate on de-
mand and try to address as many commuters as pos-
sible by using time optimal routes under real traffic
conditions respecting the individual in-vehicle time
restrictions of the commuters since commuters tend
to take time optimal routes and not emission optimal
ones from eco-driving.
4 SIMULATION SETUP
The whole simulation process is based on the inter-
action between two independent simulation entities.
On the one hand, a traffic simulator called TraffSim
(Backfrieder et al., 2013) (Backfrieder et al., 2014)
has been extended and adjusted to the requirements of
this project. This traffic simulator is a powerful tool
which is able to integrate road networks from Open-
StreetMap data and to perform traffic simulations in a
microscopic way. For this project, TraffSim has been
used to analyze a micro public transport system in a
certain region under real traffic conditions.
On the other hand, a linear optimizer has been
developed, which deals with a Dynamic Dial-a-Ride
Problem. This optimizer receives current state infor-
mation from TraffSim about routing costs and pick-up
requests. The problem solver computes the optimal
amount of pick-up buses and their starting times from
the bus depot. Furthermore, the order of the pick-up
requests is determined in which the requests are to
be processed by the respective bus. These results are
then used by TraffSim to simulate realistic scenarios
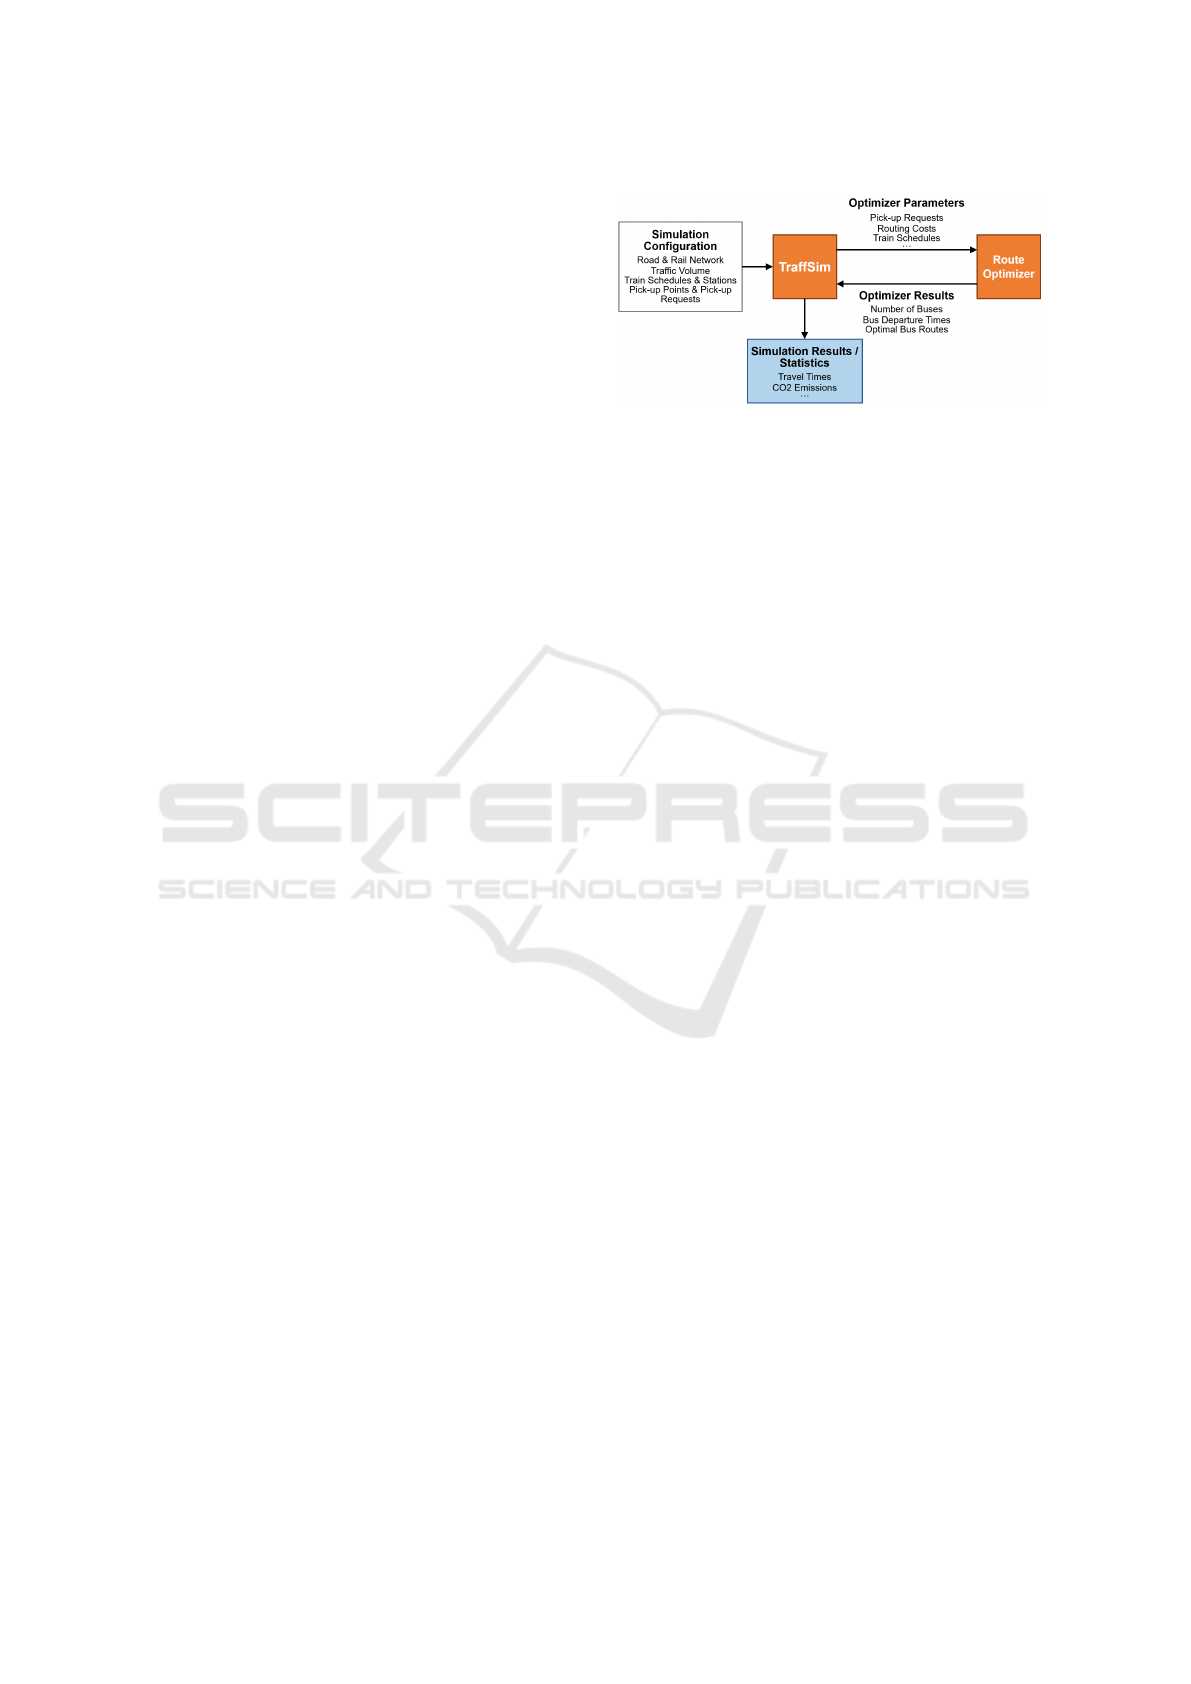
Figure 1: Interaction between TraffSim and Route Opti-
mizer.
for the micro public transport system.
As illustrated in Figure 1, these simulation entities
interact with each other so that the results of the opti-
mizer are applied to a scenario in the traffic simulator.
Data regarding traffic volumes and commuters have
been provided by the project partner STUDIA. How
this data was collected and processed for TraffSim
scenarios is described in the next sections.
4.1 TraffSim
The microscopic traffic simulator project TraffSim
has been enhanced to simulate the micro public trans-
port system described in this paper. The following
sections show how the different input types of the
simulator have been configured.
4.1.1 Study Region
The study region consists of the municipalities Kirch-
dorf, Micheldorf, Schlierbach and Inzersdorf in the
South of Upper Austria. There is one main train line
going toward the Upper Austrian capital Linz and a
motorway where you can head to Salzburg, Passau
and also Linz. The region is rather rural, with the
provincial town of Kirchdorf. A lot of people find
work within the region but a big punch of people must
commute out, in particular to Linz and between. In or-
der to do our analyses we split the region in a raster
grid with 250 by 250 meter grid cells. The used data
and the analyses of the spatial distribution of roads
and railway as well as traffic and commuters is de-
scribed in the following sections.
4.1.2 Road and Rail Network
To build up a road network which can be used by
TraffSim, data from OpenStreetMap (OSM) has been
processed. OSM data contains information about
roads and rails including their geometries, speed lim-
its and lanes as well as junctions between the road
segments. The traffic simulator uses a library called
osm2po to create a routable directed graph from this
Low-emission Commuting with Micro Public Transport: Investigation of Travel Times and CO2 Emissions
145
Figure 2: Road and rail network.
data, which can be used afterwards to determine
routes and travel costs. Figure 2 shows the processed
road and rail network in TraffSim which represents
the mentioned study region. In the left part of the fig-
ure, the whole region including the commuter routes
on the motorway and train rails can be seen. The blue
box shows a more detailed section of the road net-
work, where the blue icon represents a pick-up point.
From such a point, customers are picked up by a pick-
up bus and are delivered to a train station. Further-
more, the blue box contains a train station visualised
by a yellow icon on the train tracks and the corre-
sponding bus stop also represented by a yellow icon
on the road.
4.1.3 Traffic Situation
In order to obtain meaningful results in terms of travel
times and emissions, a realistic mapping of the traf-
fic was an important aspect of the project. Especially
in the morning, when commuter routes are heavily
used, there can be traffic jams and delays. In order
to be able to simulate this morning traffic we iden-
tified all geographical points where vehicles can en-
ter (starting or entering point) or leave (stopping or
leaving point) the simulation area in TraffSim. For
each of these points the number of cars are calculated
using rasterized data of principal residence within
the study region, provided by Statistik Austria (Aus-
tria, 2016), the Upper Austrian traffic census, pro-
vided by the provincial government of Upper Aus-
trian (Amt der OOe. Landesregierung, 2012) as well
as a rasterized freely accessible land use plan of Up-
per Austria. Whereas the traffic census data gives us
the municipality of origin and destination, the hour
of departure as well as the used means of transport,
the raster data and a randomization algorithm allows
us to distribute the traffic spatially explicit within the
region. Afterwards, this data is diluted with the coor-
dinates of the enter and leave points. This results in a
source-destination matrices for every departure hour
consisting of each enter and leave point. These ma-
trices were then mapped onto vehicles and routes in
TraffSim.
With regard to the microscopic modelling of each
individual car, the following assumptions were made.
The Intelligent Driver Model was used as the longitu-
dinal model. More detailed descriptions of the model
and its mathematical basis can be found in (Treiber
et al., 2000). In order to calculate the fuel consump-
tion and, as a result, the CO
2
emissions of vehicles,
the physics-based consumption model from Treiber
and Kesting was used. When using this model, it was
assumed that each vehicle has a mass of 1500 kg and
is powered by a diesel engine with a power of 90 kW.
More detailed information on the consumption model
can be found in (Treiber and Kesting, 2013) .
4.1.4 Commuters
We use a rasterized dataset of commuters, provided
by Statistik Austria (Austria, 2016) and the Upper
Austrian traffic census, provided by the provincial
government of Upper Austrian (Amt der OOe. Lan-
desregierung, 2012) in order to identify commuters
place of origin (grid cell), their chosen train number
and their destination train station. Our investigations
focus on commuters who travel by car or train to-
wards the Upper Austrian capital Linz between 4:00
and 10:00 in the morning. A randomization algorithm
is used to select those commuters who possibly use
a micro public transport. As this information is so
far only available on grid cells level, realistic pick-
up points are achieved by distributing the commuters
uniformly within the grid cells. Then, a set of multiple
pick-up points was defined for the entire area, which
the bus will use to pick up the commuters. The entire
commuter locations were then assigned to the closest
pick-up point. The Euclidean distance was used as the
metric for the assignment. After the data was grouped
according to the desired train line, the result was a set
of pick-up points with assigned commuters, which
are also called pick-up requests. If a pick-up point
has not any requests assigned, it is simply ignored for
this train line and will not be approached by the pick-
up bus.
4.1.5 Train Schedule
For the implementation of the EBIM-
¨
OV scenarios,
trains and timetables also had to be implemented.
Therefore, we used real timetables from the Austrian
Federal Railways (
¨
OBB) (
¨
OBB, n.d.). From this train
schedule, all relevant train stations from Micheldorf
to Linz Central Station have been included in the
TraffSim scenarios. By inserting the real train sched-
ule, it is guaranteed that the commuter train times cor-
respond to reality.
VEHITS 2022 - 8th International Conference on Vehicle Technology and Intelligent Transport Systems
146
4.1.6 Pick-up Buses
The route optimizer (see 4.2) provides the start time
for each pick-up bus and the order in which the pick-
up requests are to be picked up. All buses start at a
bus depot near the train stop in Kirchdorf. As soon
as the bus leaves the depot, the micro public trans-
port system calculates expected arrival times at the
pick-up points and train stations where the requests
are delivered. These times are based on the routing
costs of the current bus route, which originate from
the graph. These times are updated at regular intervals
(e.g. 60 seconds) and communicated to the users. The
first promised pick-up time for the requests plays an
important role. Since the users of the EBIM-
¨
OV ori-
ent themselves at this point in time, the first promised
pick-up time is also used to calculate the travel times.
This means that the travel time with the micro public
transport system results from the difference between
the first promised pick-up time and the arrival time
with the train at the respective destination train sta-
tion. In addition, the first promised pick-up time is
also important for the pick-up process itself. If the
bus arrives at a pick-up point before the first promised
pick-up time has passed, it must wait until then before
it is allowed to continue. With the pick-up buses it
should be noted that the standing times at a pick-up
point or a train station depends on the number of pas-
sengers who want to get on or off at this stop. The
standing time results from the sum of a constant value
(12 seconds) and a factor of 6 seconds per passenger
who gets on or off. For example, if 3 people want
to board at a pick-up point, the bus will stop for 30
seconds.
As with normal traffic (see 4.1.3), the Intelligent
Driver Model was used as a longitudinal model for the
buses. As far as fuel consumption is concerned, the
physics-based consumption model from Driver and
Kesting was chosen again, but with different parame-
ters. A Mercedes-Benz Sprinter Transfer 45 with 22
passenger seats and an engine of 105 kW served as
the basis for selecting the parameters (Mercedes-benz
Sprinter Transfe, 2022).
4.1.7 Comparison between Micro Public
Transport and Individual Traffic
One of the main aims of the project was to find out
how much CO
2
emissions can be saved with a micro
public transport system and how travel times change
compared to individual transport. To achieve this,
several simulation scenarios were created in which
every commuter drives with his own car to his or
her desired destination train station. For this purpose,
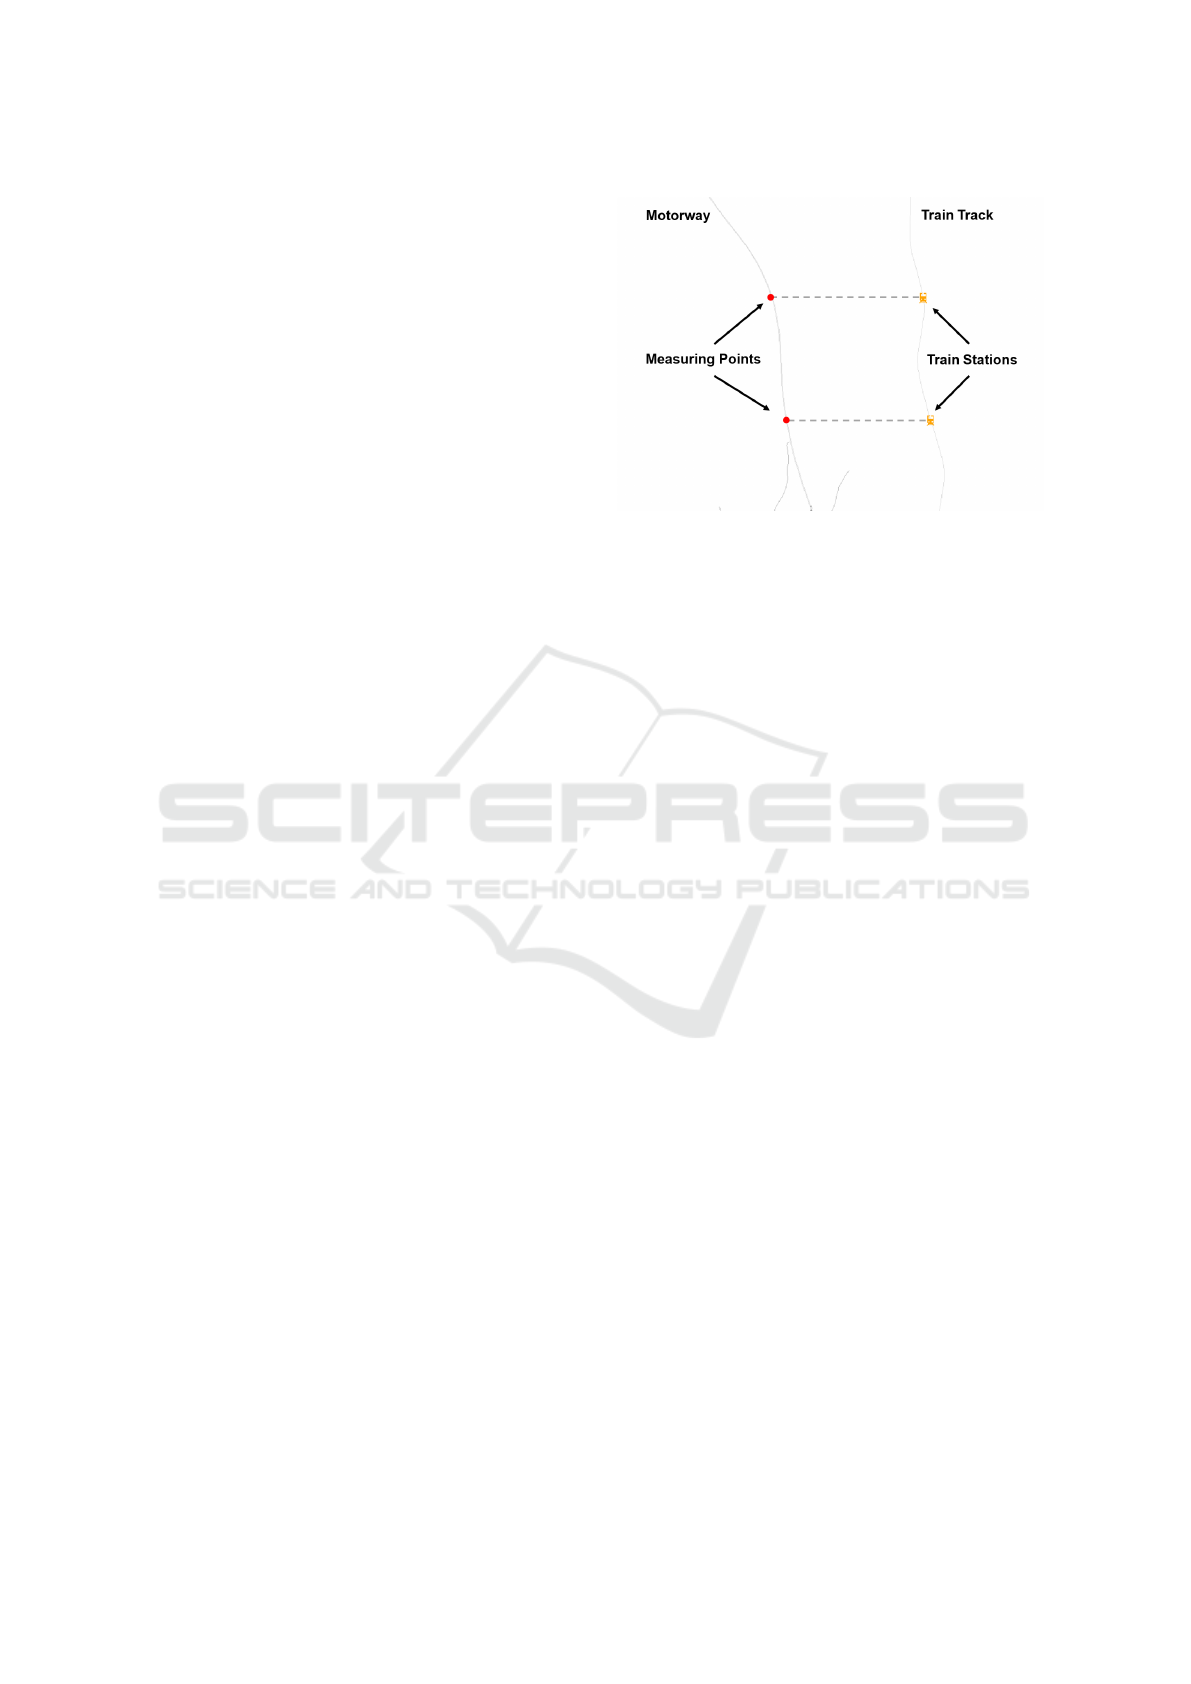
the places of origin and destination stations from the
Figure 3: Measuring points for CO
2
evaluation.
commuter data (see 4.1.4) were used again to generate
an individual vehicle for each commuter.
In order to make a meaningful comparison be-
tween micro public transport and individual transport,
certain measures had to be taken. On the one hand,
the departure times of the commuters had to be cho-
sen so that they arrive at the desired destination sta-
tion at around the same time as the train of the re-
spective train line itself. This ensures that the high
traffic volume on the commuter routes is realistically
reproduced and that the same traffic conditions for the
comparison are given. Another aspect was that there
was not always a corresponding motorway exit on the
tracks for each destination train station. The com-
muter routes in the road network only consist of the
motorway and the train tracks (see 4.1.2). As illus-
trated in Figure 3, a suitable measuring point on the
motorway was defined for each destination train sta-
tion on the rails. As soon as a commuter who would
like to reach a specific station by train crosses this
point with his car, the vehicle’s statistics are saved at
this point in time. These statistics include the time
of arrival at the measuring point and vehicle-relevant
values such as CO
2
emissions and consumed fuel.
4.2 Route Optimizer
A customer request is defined by a number of persons
who want to reach a certain train line in time. Thus
the target train station is not fixed at the outset. More-
over, in time means that a person is not only able to
reach the train but also his travel time should not dif-
fer too much from the travel time experienced with
his own car. The task is to find bus routes for a fleet
of buses with given capacity which minimize the total
travel time of the buses where each bus picks up the
customers from predefined locations such that at the
end the customers are satisfied. Since the departure
Low-emission Commuting with Micro Public Transport: Investigation of Travel Times and CO2 Emissions
147

times of the busses is determined by the optimizer,
the time window for the emergence of the pick-up re-
quests ends with the execution of the optimization.
To solve this problem we mapped it to the Dial
a Ride problem (DaRP) using its 2-index formula-
tion as given in (Ropke et al., 2007). Since this is
not straightforward to solve by general purpose op-
timization software we developed a modification of
it which used only a subset of the precedence con-
straints. The route optimizer itself is a Python module
able to communicate with TraffSim which solves the
DaRP in its mixed integer linear programming prob-
lem (MIP) formulation using the Python-MIP Pack-
age (Python-MIP, n.d.) together with the MIP solver
Gurobi (Gurobi, n.d).
We applied several heuristics to simplify and solve
the MIP problem. First we define the train station
which can be reached in the shortest time from the
pickup location as the target train station, to avoid the
solution of several DaRP problems. Only in the case
of a small deviation in travel time to another train
station, which was about 1.5 minutes in our setting,
we checked if better results are obtained by using this
train station as target. Here small has to be seen in re-
lation to the acceptance times of the customers. These
were modeled by the shortest time needed to reach the
target train station plus some customer specific delay,
which is at least as large as the time needed to walk
from the bus station to the target train station to en-
ter the train. Then the acceptance time constraint is
not satisfied if the difference of train arrival time and
promised pick-up time is greater than the acceptance
time. Observe that this delay has to be increased until
the fleet size of the solution is equal to the required
fleet size.
Secondly, pick-up requests having the same
pickup point and the same target train station are
mapped to a virtual customer request where the num-
ber of persons equals the sum of persons from each
request and the acceptance time is the minimum of
acceptance times for each request.
Thirdly, we applied a clustering of requests with
respect to the train line and their target train station,
because simulations without clustering showed that
the solutions get clustered in exactly this way. The
main reason for this seems to be the fact that the dif-
ference in train arrival times at the train stations are
so small that the buses are not able to visit more than
one train station without violating some of the con-
straints. This in turn allows us to use only a subset
of precedence constraints as long as the pickup nodes
are uniquely mapped to one bus. This was always the
case in our simulations. Though it can happen that the
delivery train station of the request is mapped to the
wrong bus we can correct this by exchanging requests
since in the cluster the target train station remains the
same.
5 SIMULATION RESULTS
For this project, only outbound trips were consid-
ered, i.e. those where commuters travel to their work-
place with the micro public transport system. The
return trip was not considered in the course of this
project. For the comparison between individual trans-
port and EBIM-
¨
OV, different scenarios were simu-
lated in which the number of requests varied. Sev-
eral scenarios were taken into account, which con-
sisted of 35, 50, 65 and 80 pick-up requests. Some
of these requests could not achieve the desired accep-
tance due to unacceptable travel times. This is be-
cause these requests could not be optimally integrated
into the route of a bus because of their geographi-
cal location. Pick-up requests with an unacceptable
travel time were therefore filtered out from the results
of these simulations. For this purpose, two threshold
values were defined for the ratio of travel time with
micro public transport to travel time with individual
transport. The threshold values selected were 1.7 and
1.85, which means that with these limits all pick-up
requests are selected for which the travel time with
micro public transport is 70% or 85% longer than with
one’s own car. After the filtering process, further sim-
ulations were carried out in which only these pick-up
requests were taken into account.
It was found out that the scenario with 80 pick
up requests included 50 within the 85% threshold,
whereas 37 requests were within the 70% threshold
concerning the additional travel time with the micro
public transport system. For these two subsets of re-
quests, simulations were performed again and the re-
sults of these two simulation scenarios are presented
in the next sections. Although the scenario with the
50 requests builds on the other, it should be noted
that both are viewed as separate simulations. This
means that, despite similar requirements for the pick-
up buses, there can be differences in the calculated
routes. Due to a random factor in the geographical
distribution of commuters, it cannot be guaranteed
that the same commuter will be picked up from the
same pick-up point in both scenarios.
5.1 Travel Time Differences
The following two histograms in fig. 4 show the dif-
ference between commuter travel time with the micro
public transport and with the commuter’s own vehi-
VEHITS 2022 - 8th International Conference on Vehicle Technology and Intelligent Transport Systems
148
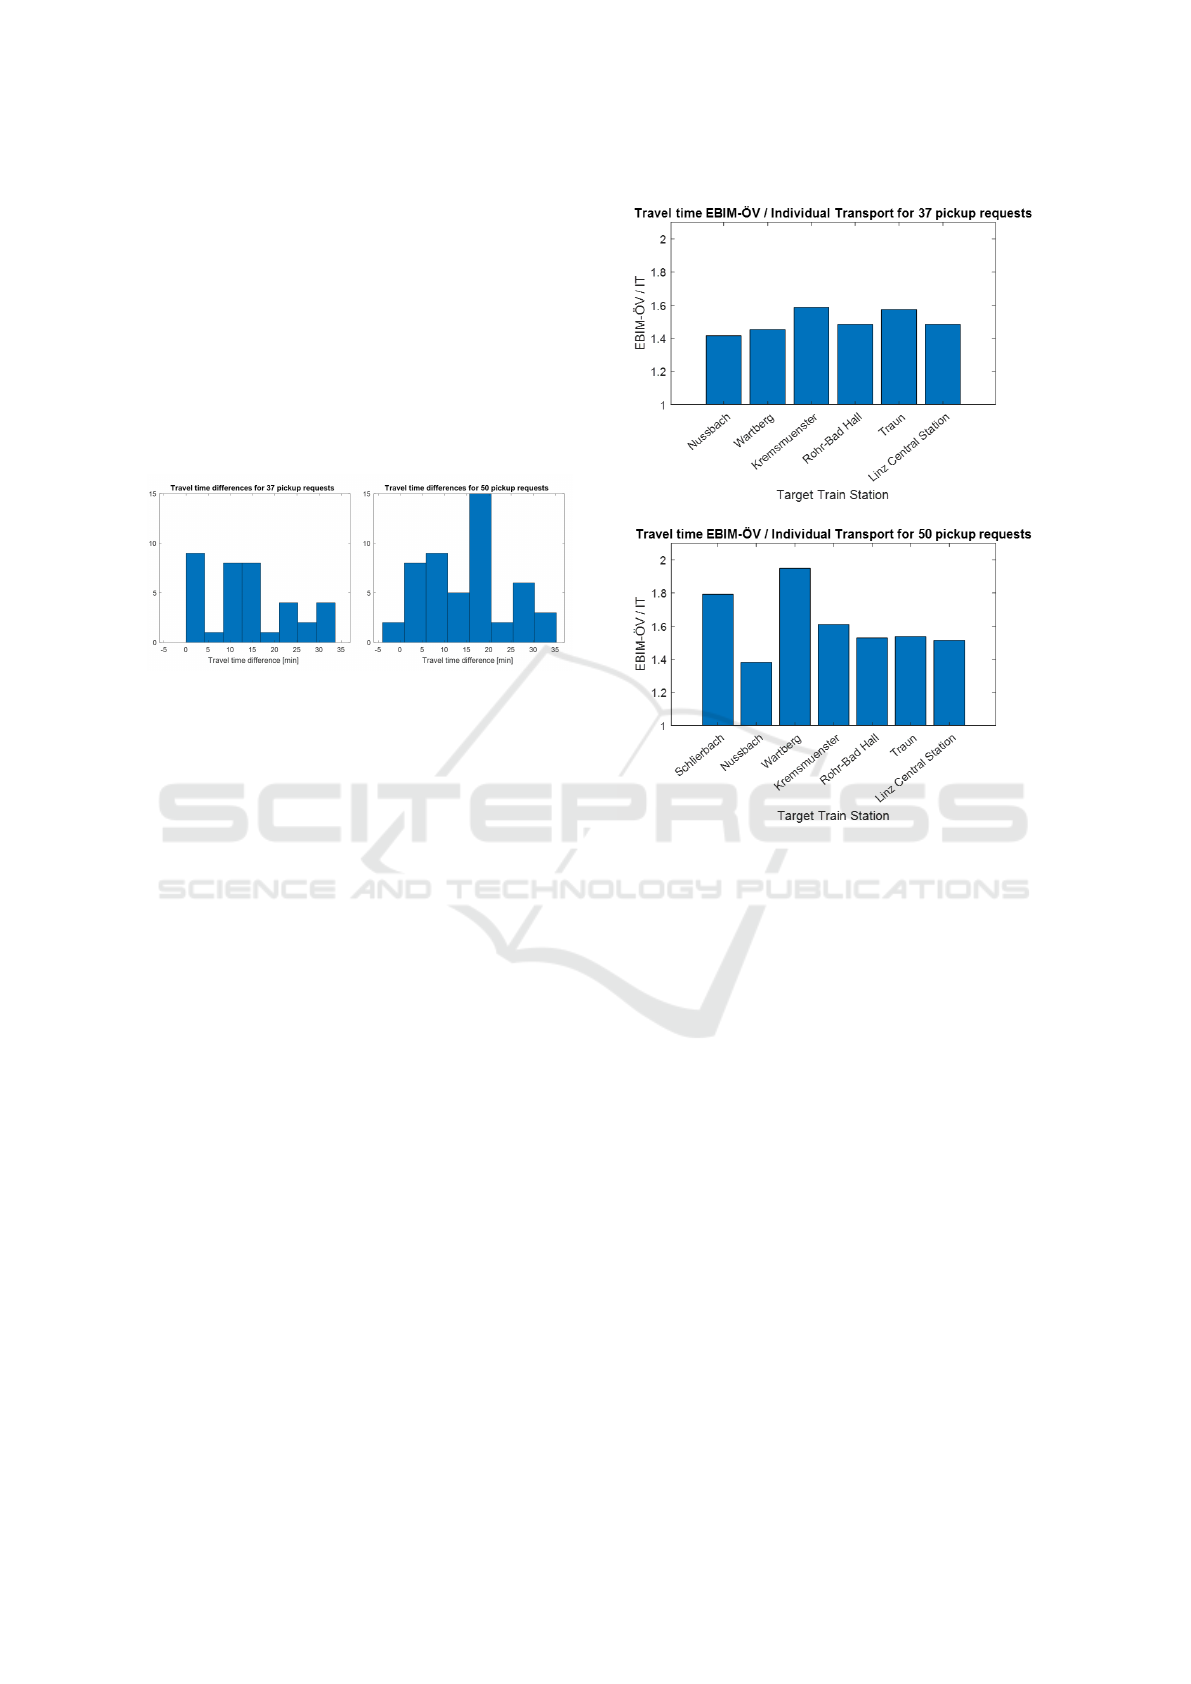
cle. The illustration on the right shows that 2 of the 50
requests with the micro public transport system were
able to reach their destination station faster or almost
as quickly as compared to their own car. This is be-
cause these two requests were quite a short distance
from the train station to which the bus brought them.
In addition, the bus picked them up at the end, which
brought them straight to the train station without any
detours. However, the commuters with the micro pub-
lic transport system needed on average 14.1 minutes
longer for the 37 requests and 14.6 minutes longer for
the 50 requests than with the individual vehicle.
Figure 4: Travel time differences.
Since there is a connection between the travel
time differences and the destination train stations, the
travel time ratio of micro public transport to individ-
ual traffic grouped by the different destination sta-
tions is shown in fig. 5. The destination stations that
are close to the source region (Schlierbach, Nuss-
bach, Wartberg, Kremsmuenster and Rohr-Bad Hall)
are subject to greater fluctuations in a direct compari-
son. The spatial distribution of commuters within the
source region shows a high impact at these destina-
tion stations. Since the commuter travel time in their
own car is usually very short at these train stations,
even small time deviations due to the micro public
transport system have a strong impact on the result.
At stations that are further away from the source re-
gion (Traun and Linz), the spatial distribution of the
pick-up requests plays a lesser role. Since the travel
time ratios are almost identical for the 37 and 50 re-
quests, it can be concluded that, due to the long total
travel time, it does not matter where the commuters
come from. Furthermore, it can be assumed that in
the case of destination stations near the source area,
the comparison is characterized by the longer travel
time of the pick-up buses and in the case of more dis-
tant stations by the longer travel time of the trains. For
the 50 pick-up requests, of which 12 had the destina-
tion station Linz, the figure shows a ratio of 1.5. This
means that these 12 commuters took an average of
50% longer to get to their work place with the micro
public transport system than with their own vehicle.
Figure 5: Travel time differences grouped by target train
stations.
5.2 Carbon Dioxide Emissions
With the help of the fuel consumption models imple-
mented in TraffSim, it was possible to measure the
CO
2
footprint of every commuter when they commute
to their workplace in their own vehicle. These values
were required in order to be able to set up a CO
2
com-
parison between individual transport and the micro
public transport system. The CO
2
emissions caused
by the micro public transport system are made up of
the emissions from the pick-up buses and those of the
respective train. The CO
2
consumption of the pick-
up buses was taken from the statistics of the traffic
simulations. However, no model is implemented in
TraffSim that can determine the CO
2
consumption of
trains. The source for the CO
2
footprint of passen-
ger trains was the sustainability report of the Austrian
Federal Railways (
¨
OBB) from 2019, which defines an
emission of 8.2 grams of CO
2
per person and kilome-
tre. This information was used to determine the re-
spective CO
2
emissions by train for each commuter,
depending on the source and destination station. As
a result, the entire CO
2
footprint of the micro pub-
Low-emission Commuting with Micro Public Transport: Investigation of Travel Times and CO2 Emissions
149
lic transport system could be calculated. In the sim-
ulation scenario with 37 requests, individual traffic
resulted in CO
2
emissions of 154.7 kg. The micro
public transport system, which serves the same com-
muters, causes a total of 18.1 kg of emissions, which
results in a saving of 88.3%. In the second scenario
with 50 commuters, 219.6 kg of CO
2
were emitted by
one’s own car and 20.8 kg of CO
2
by the micro public
transport system. Here the savings potential is 90.5%.
Table 1: Detailed CO
2
footprint micro public transport sys-
tem.
37 Requests 50 Requests
Carbon footprint buses 12.3 kg 12.1 kg
Carbon footprint train 5.8 kg 8.7 kg
Total carbon footprint 18.1 kg 20.8 kg
5.3 Further Findings
5.3.1 Number of Buses and Their Occupancies
In the scenario with 37 requests and also in the sce-
nario with 50 requests, three pick-up buses were
needed. Each of these pick-up buses had a maximum
capacity of 22 seats and the occupancies of the indi-
vidual buses are shown in the following illustration in
fig. 6.
Figure 6: Bus occupancies.
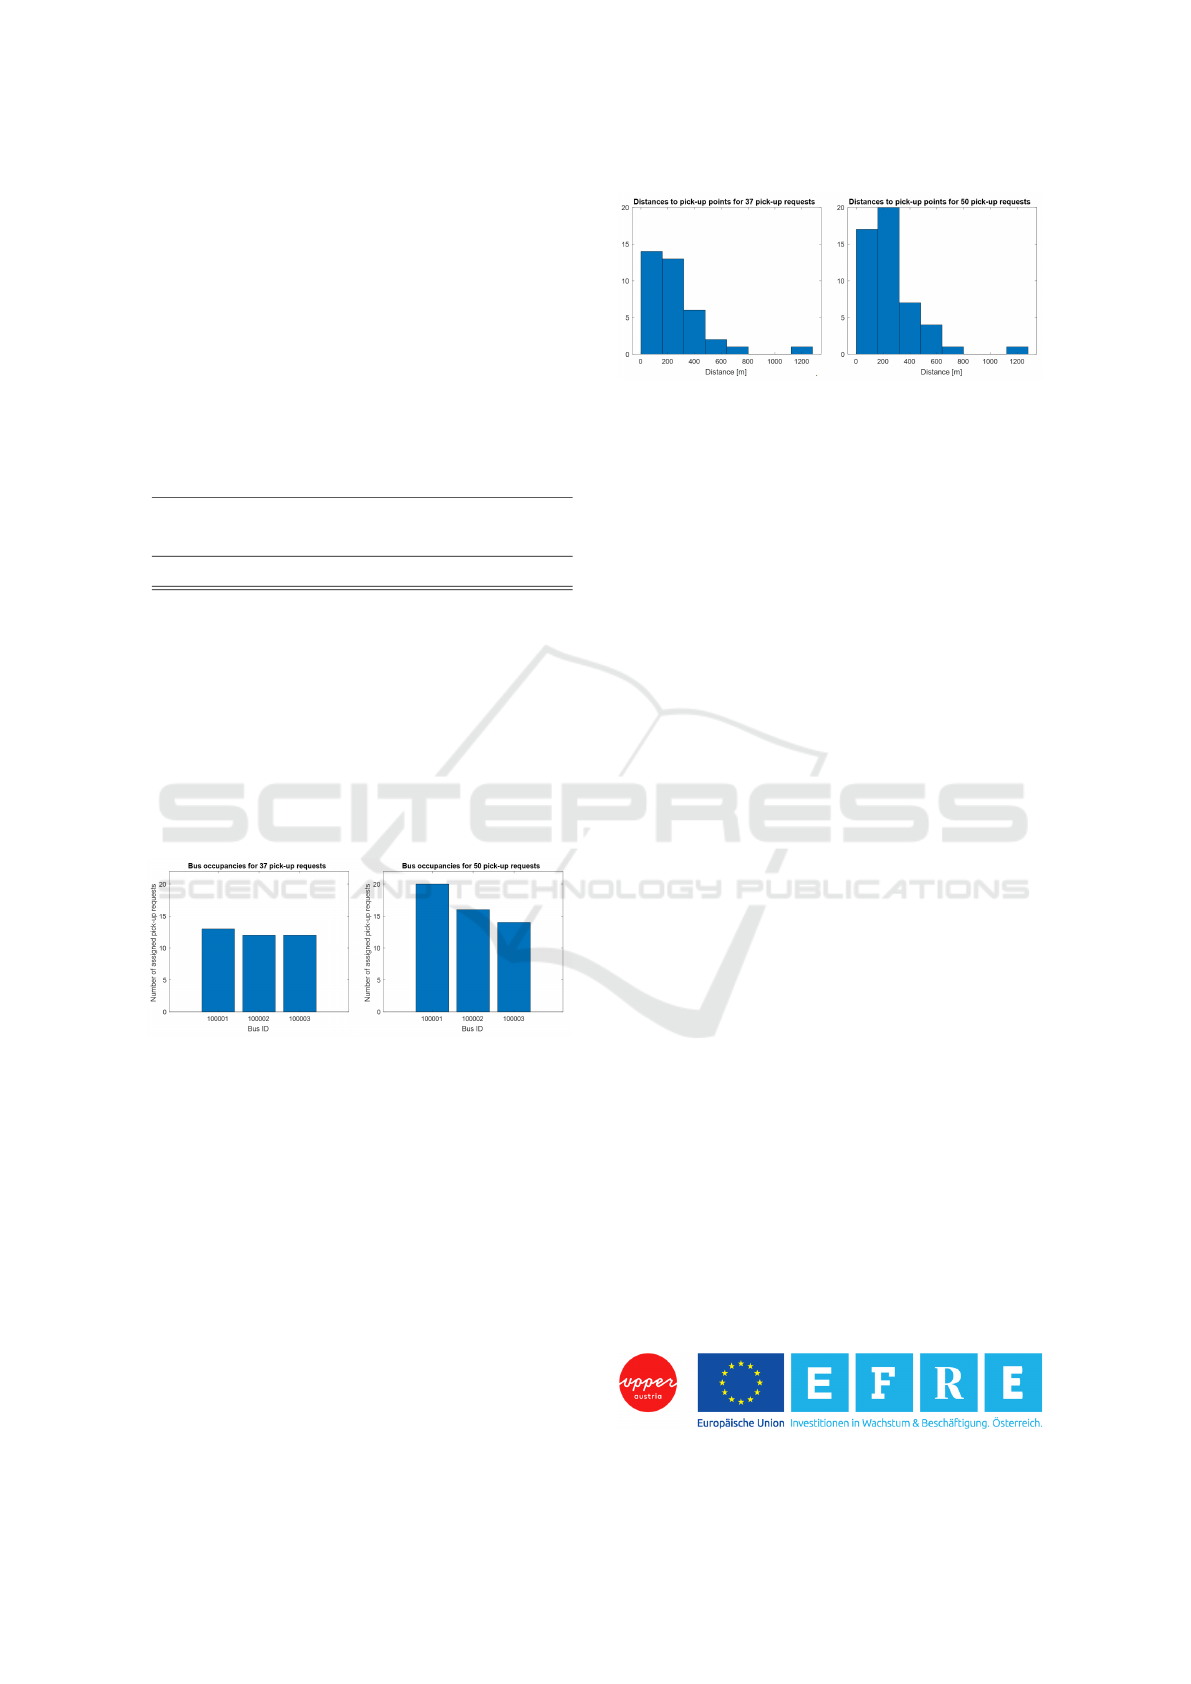
5.3.2 Distances to Pick-up Points
The following histograms in fig. 7 show the distances
that commuters have to cover from their place of ori-
gin to the assigned pick-up point. On average, the
distance in the scenario with 37 requests is 258.4 me-
ters and in the scenario with 50 requests 255.9 meters.
As can be seen in both histograms, the commuters
contain an outlier with a distance of 1259.9 meters,
for whom there was no suitable pick-up point in his
vicinity.
Figure 7: Distances to pick-up points.
6 CONCLUSION
In the course of the ”EBIM-
¨
OV” project, different as-
pects of a micro public transport system were ana-
lyzed using a microscopic traffic simulator. By simu-
lating commuter scenarios, in which commuters com-
mute to work on the one hand with their own vehi-
cle and on the other hand with a micro public trans-
port system consisting of pick-up buses and trains, a
comparison between the two types of mobility could
be drawn. In summary, it can be said that a micro
public transport system consisting of 3 pick-up buses
with 22 seats each could find acceptance for the sim-
ulated test area. According to the simulations carried
out, commuters have to accept that they have to walk
about 257 meters to a pick-up point. Depending on
the destination train station of the commuter, there is
an increase in commuter travel time of 38% to 95%
compared to the travel time with one’s own car. It
should be noted that the comparison for nearby desti-
nation stations depends heavily on the places of origin
of the commuters. At the destination train station in
Linz, which is furthest away from the source area, the
travel time increased by 48% to 51%. The geographi-
cal distribution of the places of origin is less important
here, as the travel time is much longer and is largely
determined by the train. Provided that out of 50 com-
muters all commute with the micro public transport
system instead of their own car, it can be said that
over 90% of CO
2
emissions can be saved.
ACKNOWLEDGMENT
This project has been co-financed by the European
Union using financial means of the European Re-
gional Development Fund (EFRE). Further informa-
tion to IWB/EFRE is available at www.efre.gv.at.
VEHITS 2022 - 8th International Conference on Vehicle Technology and Intelligent Transport Systems
150

REFERENCES
Amt der OOe. Landesregierung, Direktion Strassenbau
und Verkehr, A. G. u. o. V. (2012). Daten zur
ober
¨
osterreichischen Verkehrserhebung 2012.
Austria, S. (2016). Daten auf Basis der Regionalstatistis-
chen Rastereinheiten: Zahl der Personen mit Haupt-
wohnsitz und Paket Pendler.
Backfrieder, C., Mecklenbr
¨
auker, C., and Ostermayer, G.
(2013). Traffsim – a traffic simulator for investigating
benefits ensuing from intelligent traffic management.
pages 451–456.
Backfrieder, C., Ostermayer, G., and Mecklenbr
¨
auker, C.
(2014). Traffsim - a traffic simulator for investigations
of congestion minimization through dynamic vehicle
rerouting. International Journal of Simulation Sys-
tems Science & Technology, 15:38–47.
¨
Uberall, A., Otte, R., Eilts, P., and Krahl, J. (2015). A liter-
ature research about particle emissions from engines
with direct gasoline injection and the potential to re-
duce these emissions. Fuel, 147:203–207.
Engelmann, M., Schulze, P., and Wittmann, J. (2020).
Emission-based routing using the graphhopper api
and openstreetmap. In Schaldach, R., Simon, K.-
H., Weism
¨
uller, J., and Wohlgemuth, V., editors, Ad-
vances and New Trends in Environmental Informatics,
pages 91–104, Cham. Springer International Publish-
ing.
Li, B. and Tamura, H. (2003). Estimation of a reduction
in co2 emissions by shifting commuters’ travel mode
from the private car to public transport. International
Journal of Systems Science, 34(3):159–165.
Litman, T. (2017). Smart transportation emission reduction
strategies. Technical report, Victoria Transport Policy
Institute.
Mar
´
ın, P. F. and De Miguel Perales, C. (2021). Environ-
mental Aspects of the Electric Vehicle, pages 93–108.
Springer International Publishing, Cham.
Mercedes-benz Sprinter Transfer 45. [Online]. Available:
https://www.mercedes-benz-bus.com/enDE/brand/n
ews/2019/minibus-offspring-sprinter-transfer-45-and
-sprinter-city-45.html
Ropke, S., Cordeau, J.-F., and Laporte, G. (2007). Models
and branch-and-cut algorithms for pickup and delivery
problems with time windows. Networks, 49(4):258–
272.
Treiber, M., Hennecke, A., and Helbing, D. (2000). Con-
gested traffic states in empirical observations and mi-
croscopic simulations. Physical Review E, 62:1805–
1824.
Treiber, M. and Kesting, A. (2013). Traffic Flow Dynamics.
Yang, L., Wang, Y., Han, S., and Liu, Y. (2019). Ur-
ban transport carbon dioxide (co2) emissions by com-
muters in rapidly developing cities: The comparative
study of beijing and xi’an in china. Transportation
Research Part D: Transport and Environment, 68:65–
83. Urbanization, Transportation and Air Quality in
Developing Countries.
Yoshida, A. and Harata, N. (1996). A mixed-mode choice
model including railway route, stations, and its access
and egress modes choice. Doboku Gakkai Ronbunshu,
1996(542):19–31.
Obb train schedule pyhrnbahn 140. [Online]. Available:
https://www.oebb.at/de/dam/jcr:0b159f98-8e3b-
4b03-b4a9-007212675433/kif140.pdf
Python-mip package. [Online]. Available:
https://www.python-mip.com
Gurobi. [Online]. Available: https://www.gurobi.com
Low-emission Commuting with Micro Public Transport: Investigation of Travel Times and CO2 Emissions
151
