Factors Influencing LoRa Communication in IoT Deployment: Overview
and Experience Analysis
Thierry Antoine-Santoni
1 a
, Bastien Poggi
1 b
, David Araujo
1
and Chabi Babatounde
2
1
UMR CNRS SPE 6134, Universit
`
a di Corsica, Corte, France
2
UMS CNRS STELLA MARE 3514, Universit
`
a di Corsica, Biguglia, France
Keywords:
Lora, RSSI, PCA, Performance.
Abstract:
LoRa communication offers wireless sensor networks deployment for system or environmental monitoring
over long distances and with low energy consumption. However, this radio communication technology is
subject to environmental disturbances. In this paper, we propose an overview of the studies carried out on
LoRa signal disturbances, taking the RSSI as a comparison parameter. Secondly, we extract the main influ-
ences to compare them with the data collected on the experimental platform of the Smart Village of Cozzano
(Mediterranean area, Southern of Corsica island), a scientific program aiming to develop digital tools for the
monitoring and the preservation of the environment. We use one of the most popular techniques in multivariate
statistics, especially when analyzing large datasets, the principal component analysis (PCA). The results show
the impact of some environmental parameters on communication quality.
1 INTRODUCTION
Environmental monitoring is a crucial issue in the
scientific field. The smart village, a scientific
project, proposes to develop a set of technologies
for the environment observation and preservation
and its inhabitants in a rural, mountainous and iso-
lated area. (Antoine-Santoni et al., 2019b),(Antoine-
Santoni et al., 2019a). In this context, it is essential to
think about a correct deployment of the devices to en-
sure the transmissions quality from the deployed sen-
sors.
With a view to sustainable development, the scien-
tific program has set up an information system based
on a wireless sensor network using LoRa communi-
cation technology with a LoRaWAN protocol. This
technological choice aligns with a desire for energy
efficiency to limit the impact of technologies on the
environment and human maintenance over time. In-
deed, we can find many works using LoRa technol-
ogy for telemetry purposes (Haxhibeqiri et al., 2018):
smart cities, industry, transport, agriculture, etc. We
see many results presenting the various applications
of LoRa, but in (Shanmuga Sundaram et al., 2020),
the authors specify the axes of reflection around the
a
https://orcid.org/0000-0002-6645-9311
b
https://orcid.org/0000-0002-3253-6868
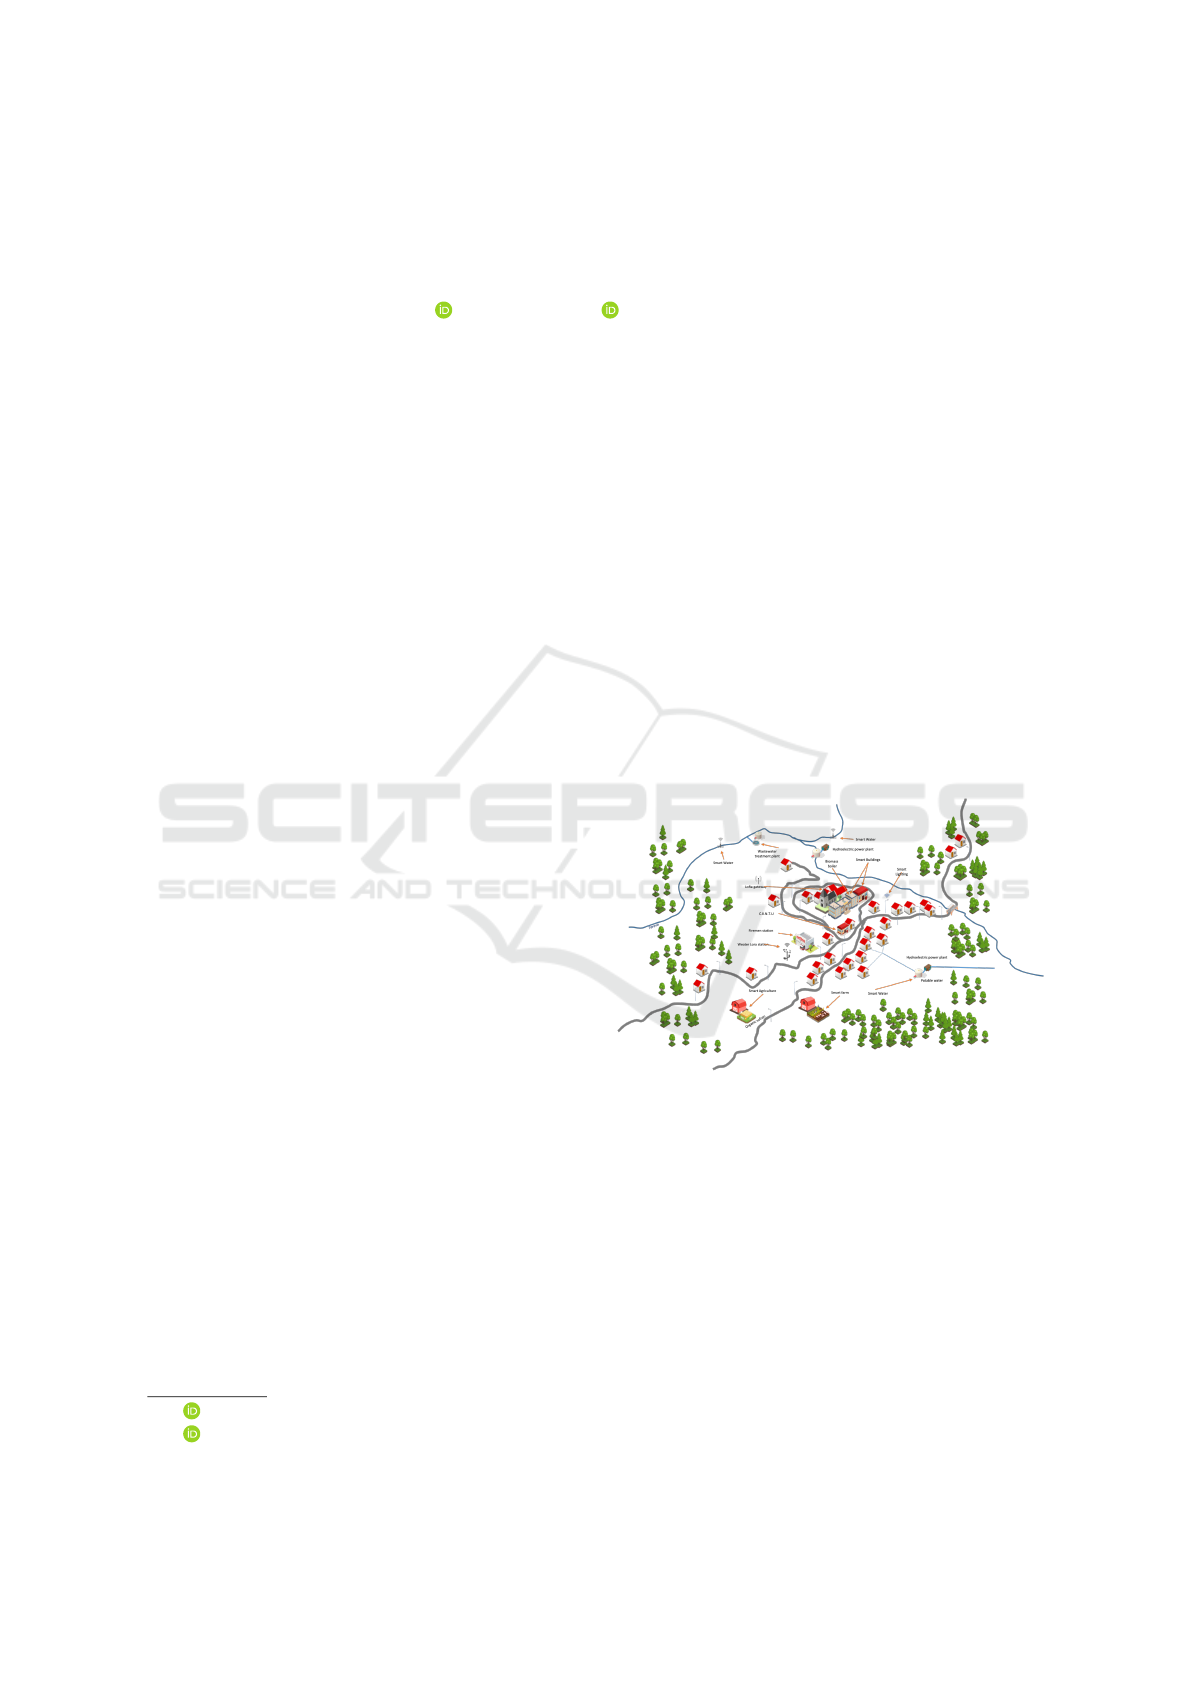
Figure 1: Smart Village of Cozzano (South of Corsica) -
Deployment of Lora devices.
scientific challenges around LoRa/LoraWAN. Within
the Smart Village, illustrated by Figure 1, in the vari-
ous applications deployed, we can find weather sta-
tions on different points of the village and in alti-
tude and GPS trackers to locate animals raised in the
wild. However, despite the relative system stability,
we have noticed variations in the signal quality per-
formance, impacting the data transmission quality of
the information feedback. These failures create gaps
in the database. In this paper, we propose to make
a statistical analysis of the collected environmental
data to evaluate the impact of the environment on the
signal and determine the environmental factors influ-
274
Antoine-Santoni, T., Poggi, B., Araujo, D. and Babatounde, C.
Factors Influencing LoRa Communication in IoT Deployment: Overview and Experience Analysis.
DOI: 10.5220/0011102600003194
In Proceedings of the 7th International Conference on Internet of Things, Big Data and Security (IoTBDS 2022), pages 274-280
ISBN: 978-989-758-564-7; ISSN: 2184-4976
Copyright
c
2022 by SCITEPRESS – Science and Technology Publications, Lda. All rights reserved

encing long-range communication. In a first step, we
will make a literature review on the studies conducted
around the influence of the environment on the LoRa
signal, taking the RSSI as a parameter. We confront
them with a statistical analysis on the devices de-
ployed in the Smart Village since 2018. We will then
conclude on the areas of improvement of these dif-
ferent parameters and improve communications and
network coverage.
2 STATE OF ART
LoRa, for “Long Range”, is a long-range wireless
communications system promoted by the LoRa Al-
liance (Alliance, 2015). This system aims at being us-
able in long-lived battery-powered devices, where the
energy consumption is of paramount importance (Au-
gustin et al., 2016). Lora distinguishes two main lay-
ers: a physical layer using the Chirp Spread Spectrum
(CSS) radio modulation technique and a MAC layer
protocol (LoRaWAN). LoRa is a technology that op-
erates in the ISM, Industrial, Scientific and Medical
(ISM) frequencies bands, 868 and 433 MHz in Europe
and 915 MHz in the USA. These different frequencies
can, however, have a performance impact on the net-
work as studied in (Alset et al., 2020) where the au-
thors determined with simulations that the lifespan of
the batteries can be affected by the carrier frequency
in use. With long-range and low power capacities,
LoRa belongs to the LPWAN category. Semtech, an
owner of the technology, claims an effective range
of thirty miles (sem, ), or approximately forty-eight
kilometres, in urban areas. However, with the ade-
quate material, it is possible with LoRa, to transmit
over a hundred kilometres (Jovalekic et al., 2018).
Thanks to the low consumption of LoRa devices, a
connected device can run for several years on a bat-
tery. LoRa technology is at the heart of many aca-
demic and industrial works, and many scientific ques-
tions are still open, as revealed by (Shanmuga Sun-
daram et al., 2020). The principal value in use when
studying a LoRaWAN, and generally signals, is prob-
ably the Received Signal Strength Indication (RSSI).
The RSSI is a measure of the power at the recep-
tion of a signal. It formulates in decibel-milliwatts
(dBm). In general, the RSSI usually spans between
-60 and -130 dBm; the closer value is to 0, the better
the RSSI and, on the contrary, a signal relative to -130
dBm means a weak reception. The network architec-
ture of LoRaWAN uses a star topology where the data
from all the devices gather to a gateway. LoRaWAN
is a data link layer protocol to provide a low power
connectivity system to battery-powered devices. The
current LoRaWAN specification is 1.1 (the most used
specification is 1.0.3). The gateway can then trans-
mit these data to a server. Through the Adaptive Data
Rate, a LoRaWAN gateway can change the data rate
by changing its spreading factor (SF). The CSS mod-
ulation uses a Spreading Factor (SF) to spread the in-
formation over the frequency (from 7 to 12), deter-
mining the number of bits necessary to transmit the
same amount of data. A higher number of bits per
symbol increases the capability of the receiver to de-
modulate the message. Higher SF means that more
bits are necessary to send the same information. By
increasing the SF, the range can be increased at the
cost of data throughput (Zhu et al., 2019), through-
put varying from 0.3 kilobits per second to 50 kilo-
bits per second. As with every means of commu-
nication, LoRa can suffer from external factors that
would diminish the signal quality, starting with the ur-
ban environment where IoT networks can use the LP-
WANs. This kind of impact has been studied in (Vil-
larim et al., 2019; Dambal et al., 2019; Inagaki et al.,
2019; Villarim et al., 2019; Yousuf et al., 2018). In
(Dambal et al., 2019) the authors study the impact of
a rural environment over a LoRa message. Thus, in an
urban situation, positioning the antennas is extremely
important. By increasing the antenna height, the cov-
erage will increase too, as the height of the buildings
can be an obstacle for the signal. As buildings oc-
cupy the Fresnel zone, the signal can be heavily im-
pacted. In a village like Cozzano, the buildings tend
to have fewer floors, thus less height, potentially re-
ducing the mentioned interference. However, in (Vil-
larim et al., 2019), the authors estimate that vegeta-
tion might be even more of an obstacle to the propa-
gation of Lora signal than buildings. It is important
to consider that Cozzano is located in the mountains
with much Mediterranean vegetation. This vegetation
needs to be taken into account when measuring the
values of the RSSI, according to (Iova et al., 2017).
By comparing the measures made in an airport and
a forest, the authors observed that while 95% of the
received data in an open field, only 80% are received
when vegetation obscures the path.
Furthermore, it appears from their experimenta-
tions that vegetation could reduce the range at which
a message can be transmitted: from 500 meters in an
open field, the signal reached about 90 meters in a for-
est, this kind of impact needs to be taken into account
as it could severely damage the reception of the data.
These results are comforted by other works such as
(Wiyadi et al., 2020; Ali et al., 2019; Ansah et al.,
2020; Hidayat et al., 2019; Elijah et al., 2019) where
we can observe an impact of the vegetation on signal
propagation. In (Ali et al., 2019) the authors men-
Factors Influencing LoRa Communication in IoT Deployment: Overview and Experience Analysis
275
Table 1: Comparison of works surrounding LoRa.
Publication Impacted parameters Distance Temperature Snow Vegetation Mobility Buildings
(Souza Bezerra et al.,
2019)
RSSI - - -
(Dambal et al., 2019) RSSI - -
(Boano et al., 2021) RSSI, PDR -
(Pet
¨
aj
¨
aj
¨
arvi et al., 2017) RSSI, PDR - -
(Iova et al., 2017) RSSI - -
(Ali et al., 2019) RSSI, SNR, PDR -
(Alset et al., 2020) RSSI, PDR -
(Ansah et al., 2020) RSSI, SNR, PDR -
(Avila-Campos et al.,
2019)
RSSI, SNR -
(Qaraqe et al., 2020) RSSI - x
(Inagaki et al., 2019) RSSI - -
(Hidayat et al., 2019) RSSI, PDR - - -
(Wiyadi et al., 2020) RSSI, PDR - -
(Elijah et al., 2019) RSSI, PDR - - -
(Villarim et al., 2019) RSSI, PDR - - -
(Doroshkin et al., 2019) RSSI, SNR - x
(Yousuf et al., 2018) RSSI, PDR - x -
tion the vegetation occupying the Fresnel zone and
that this is the reason why the vegetation impact the
signal. Thanks to the equations surrounding the Fres-
nel zone, it is possible to estimate more precisely the
impact vegetation could have on a LoRaWAN. SF is
an adjustable parameter to increase the range of the
LoRa signal at the cost of throughput, representing
a solution inside dense vegetation. A signal emitted
with a higher SF tends to be more robust than one cast
with a lower SF, further increasing the signal capacity
to pass through vegetation.
Mobility is already been studied in (Pet
¨
aj
¨
aj
¨
arvi
et al., 2017; Doroshkin et al., 2019; Qaraqe et al.,
2020). According to these studies, speed is a pa-
rameter that can negatively impact the RSSI. For
example, with an SF 12, an approximate speed of
40 km/h is enough to impact the RSSI value nega-
tively(Pet
¨
aj
¨
aj
¨
arvi et al., 2017). However, according
to (Doroshkin et al., 2019), the impact of the speed
already observed in (Pet
¨
aj
¨
aj
¨
arvi et al., 2017) cannot
be applied in Line of Sight (LOS) scenarios as the
multipath phenomenon can amplify the impact of the
Doppler effect.
Furthermore some works studied the impact of
temperature on a LoRa signal, such as (Souza Bezerra
et al., 2019) or (Boano et al., 2021). In (Souza Bezerra
et al., 2019) the authors studied the impact of tem-
perature on a LoRaWAN device in a Swedish town,
while in (Boano et al., 2021) the authors studied the
impact of temperature on a heated bed. From the re-
sults, relatively high temperature can hurt the qual-
ity of a LoRa network as it could decrease the RSSI.
Even if heat has a negative impact, too cold weather
associated with snow seems equally harmful. Indeed
in (Souza Bezerra et al., 2019), the authors precise
that snow hinders signal propagation.
The references analysing the impacts on the sig-
nal have been summarised in Table 1 where the sig-
nificant effects mentioned have been noted as un-
favourable (-) or neutral (x). The LoRa parameters
that are studied are generally a combination of the
RSSI, the Signal to Noise Ratio (SNR) and the per-
centage of packet lost or received. To make the anal-
ysis more understandable, we consider that studying
the data portion of received packets (PDR) versus
transmitted packets is identical to the packet loss rate
(PL) because they are opposite.
3 COZZANO’S RSSI MAPPING
The data pass through an information system devel-
oped specifically for the Smart Village to collect the
information, as illustrated in Figure 2.
The central communication technology of the
Smart Village being LoRa, we felt a need for a bet-
ter understanding of how the signal spread around
the village of Cozzano. For this purpose, we devel-
oped LoRa devices allowing us to transmit a location
through a message to the LoRaWAN gateway on the
church bell tower. The used LoRa gateway is a ker-
link device (Kerlink, 2022). All the used devices on
IoTBDS 2022 - 7th International Conference on Internet of Things, Big Data and Security
276
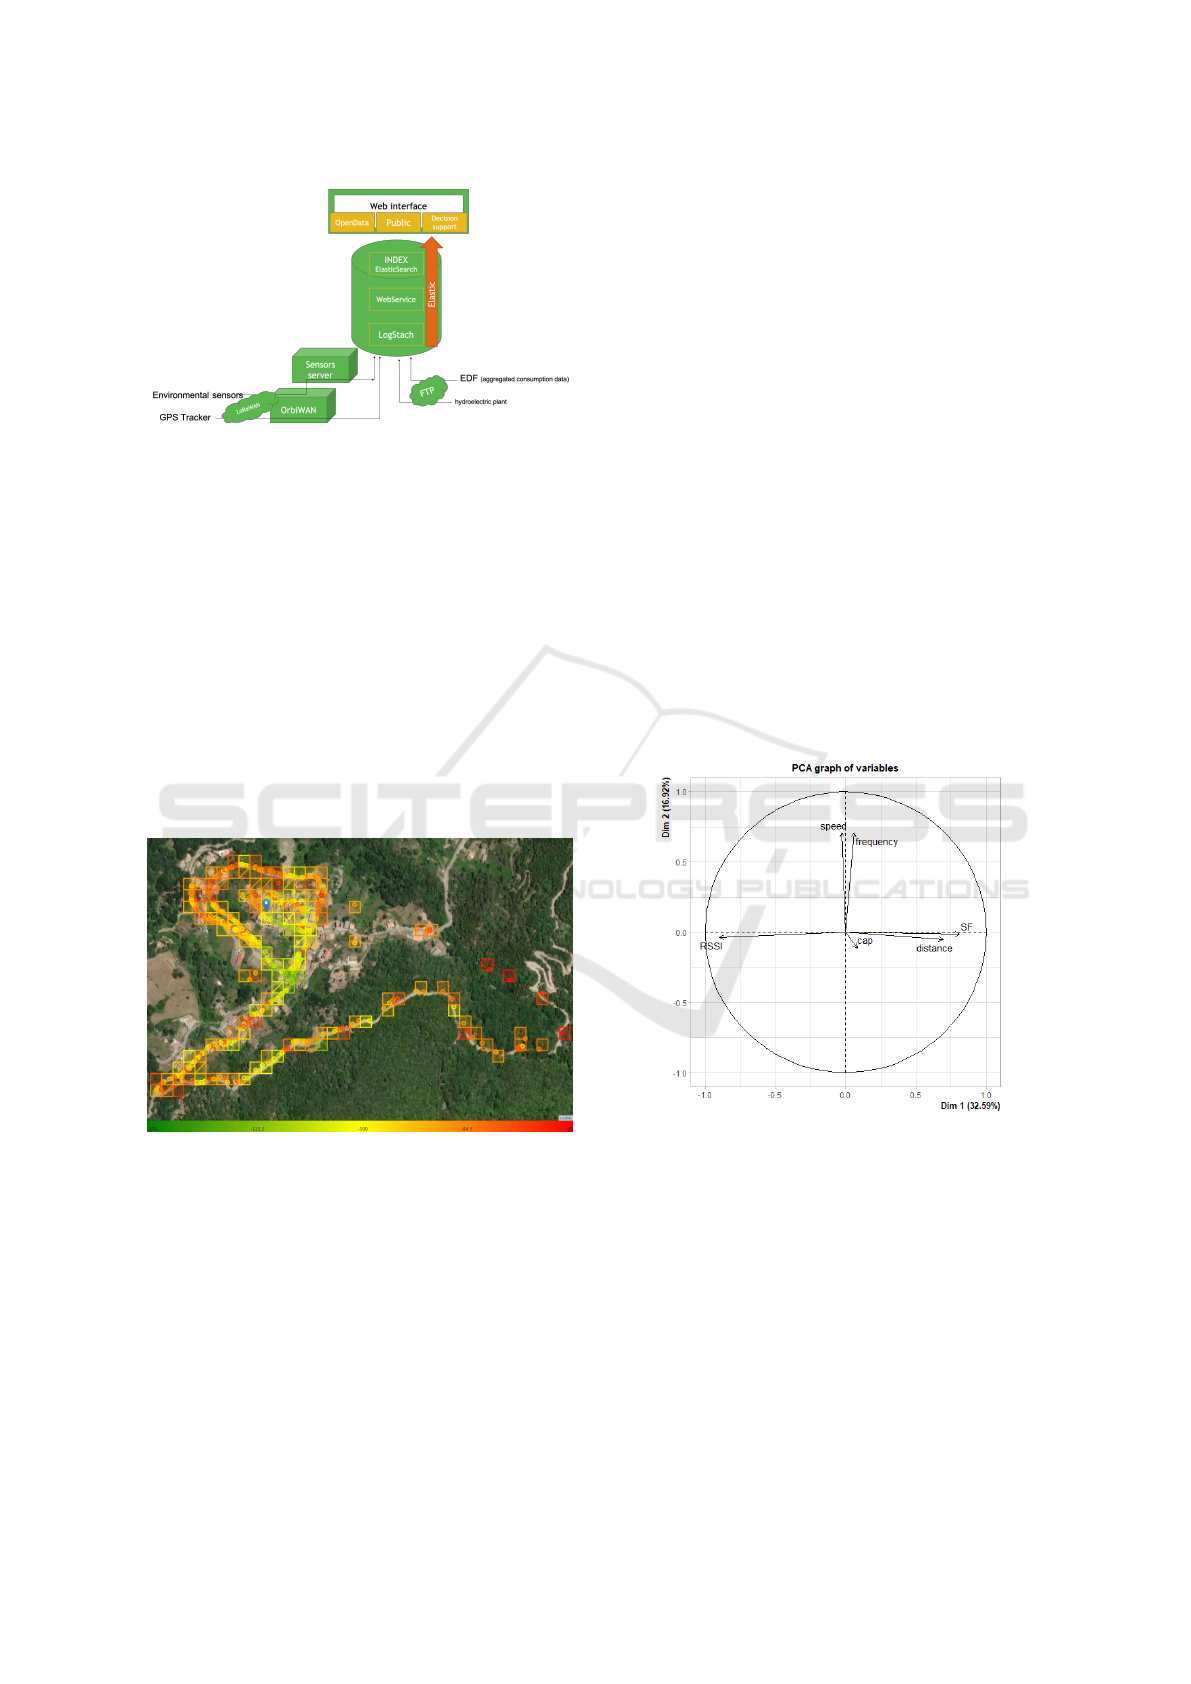
Figure 2: Information system architecture.
the Smart Village are Class C of Lora.
We walked around the village with the devices and
regularly sent our position to the gateway to take these
measures. The transmissions used a spreading factor
of 7 and a bandwidth of 125 kHz. Using the data col-
lected in the Smart Village, we were able to produce
the map presented in Figure 3. We can see coloured
circles representing the RSSI on a location. In Fig-
ure 3, the gradient from green to red represents an in-
crease in the quality of the RSSI. However, these cir-
cles are numerous and difficult to observe separately.
The rings regroup 30 square meters wide. By calcu-
lating the circle’s mean value, we attributed a colour
to each one, following the already used colour scale.
Furthermore, we can see there is more than one square
Figure 3: Map of RSSI distribution in Cozzano.
type. The standard squares are measured from our re-
sults, while the barred ones are estimated from the
neighbouring measured squares. For simplicity, we
assumed that the propagation of the signal would be
regular on really short distances such as 30 meters
and estimated the value of the barred squares as the
mean of the surrounding squares (in the case where
there are at least five neighbours). We attributed a
colour to these estimated squares according to the
previous colours gradient. As presented on 3, there
is a substantial evolution of the RSSI within the vil-
lage. Thus, RSSI varies from strong values (around
-80 dBm) to fragile ones (down to -131 dBm). The
village’s topography can explain this range of val-
ues; granite stone buildings strongly impact a signal
and cause rebound through the alleys, deteriorating
the signal. Thus, the more open fielded areas can
transmit a message with high RSSI. While taking our
measures, we could also retrieve the RSSI on a trail
above the village. It cannot be seen, but the trail alti-
tude gives a clear viewpoint gateway’s position on the
bell tower. Without any obstacles, the message can
be transmitted to the gateway in the best condition;
thus, the high values of the RSSI we can find on this
trail despite the gateway distance. From these results,
we can see that buildings significantly impact mes-
sage transmitting. The presence of buildings can lead
to RSSI lower than -100 dBm for a distance approx-
imating 150 meters, while in an open field situation,
messages are received with higher RSSI for greater
distances.
4 STATISTICAL ANALYSIS
Figure 4: PCA of the trackers datas.
From the analysis of the RSSI values, the ques-
tion is to know which parameters influence the LoRa
signal strength. We, therefore, relied on the pop-
ular statistical method, Principal components analy-
sis (PCA) (Jolliffe, 2013). The principal component
analysis allows extraction and visualising informa-
tion from a multivariate data table. PCA synthesises
this information into just a few new variables called
principal components. These new variables are a lin-
ear combination of the original variables. The num-
ber of principal components is less than or equal to
the number of original variables. The information
Factors Influencing LoRa Communication in IoT Deployment: Overview and Experience Analysis
277
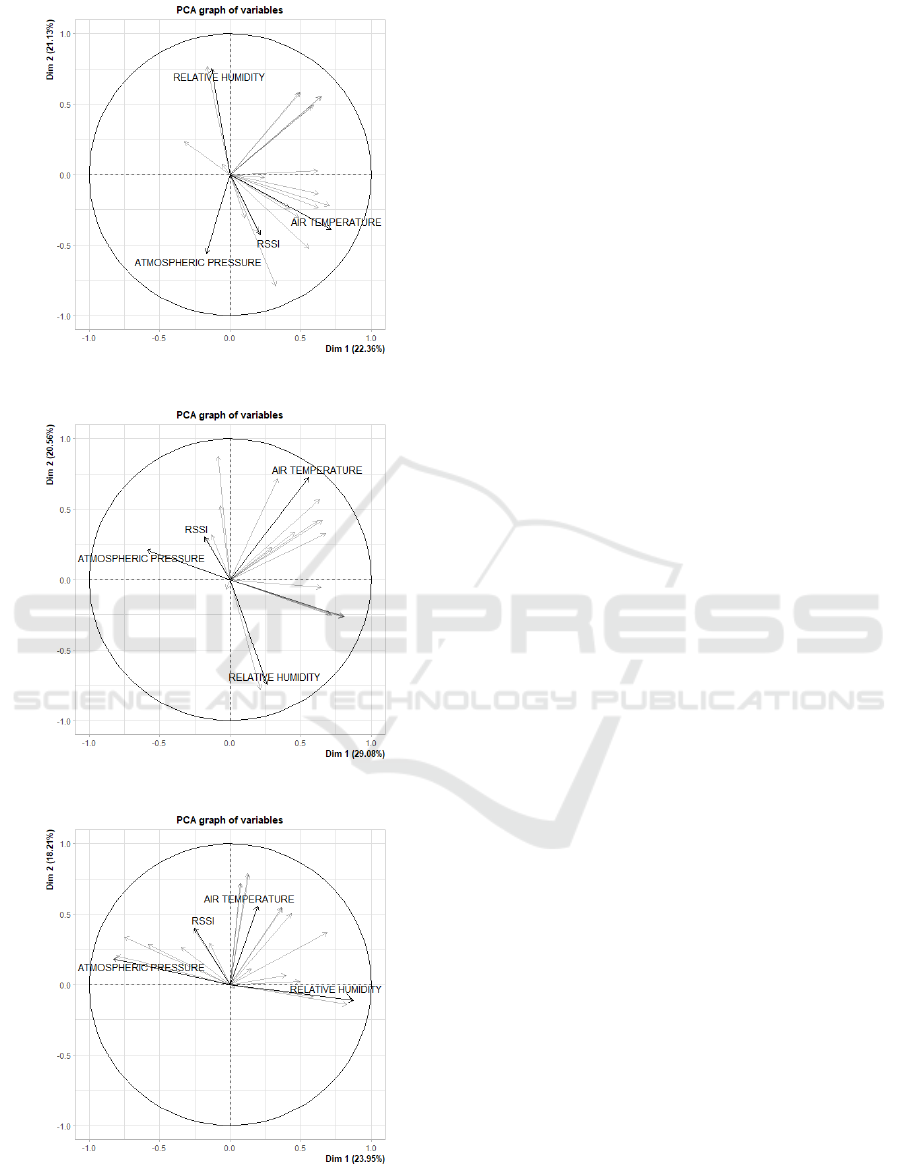
Figure 5: PCA of the datas from the firefighters station.
Figure 6: PCA of the datas from the saffron field.
Figure 7: PCA of the datas from the Casteddu.
contained in a dataset is the total variance or iner-
tia. The objective of PCA is to identify the directions
(i.e., principal axes or principal components) along
which the variation in the data is maximum. We tried
to define the parameters above by running the PCA
through multiple emitters. The first emitters chosen
for this analysis were GPS trackers (Rf-track, 2022)
on the animals. We can retrieve a certain amount of
data through these trackers, such as position, RSSI,
spreading factor, frequency, movement speed, and di-
rection. We can calculate the distance between the
emitter and the gateway at each transmission with a
known location. We used this distance instead of the
location in the PCA. For the experiment, tracker de-
vices were placed on different herd animals. These
animals move freely on a vast mountainous territory.
We retrieved around fourteen thousand transmissions
and the PCA results presented in Figure 4. Many
models such as Free Space Path Loss or Okumura-
Hata already consider distance when estimating RSSI
values. Thus, it seems coherent to see distance nega-
tively correlated to the RSSI. According to this PCA,
the SF appears also negatively correlated to the RSSI.
The SF could have changed to assure the transmis-
sion of the message in harsh conditions. It could ex-
plain the aforementioned negative impact. Further-
more, the animals usually travel at low speed, which,
according to literature, isn’t enough to impact LoRa
signal propagation. This observation can explain the
lack of correlation between the speed and the RSSI
represented in Figure 4. The minor variations in fre-
quency operated in LoRaWAN don’t seem to impact
the RSSI either as the RSSI and frequency vectors are
at an angle close to 90°. Thus it is unlikely that the
differences in frequency provoked by the channels in
use by LoRaWAN are detrimental to the signals.
Another exciting piece of information is the im-
pact of atmospheric pressure, as the weather could
affect signal propagation. It seems that with higher
pressure, we obtain a better RSSI.
5 WAY TO ENHANCE LoRa
DEVICES DEPLOYMENT
We evoke the axis in which we will contribute to im-
proving the deployment of wireless sensor networks.
We imagine coupling a Machine Learning algorithm
to predict positions and optimize these positions. Our
idea base itself on the coupling of two algorithms for
placement optimization:
• The k-nearest neighbours algorithm (KNN),
which allows an accurate estimation of the signals
on the deployment area from localized measure-
ments
IoTBDS 2022 - 7th International Conference on Internet of Things, Big Data and Security
278
• Hitchcock bird-inspired algorithm (HBIA) opti-
mizes the devices’ positioning according to dif-
ferent parameters: environmental parameters and
signal quality according to the defined areas of in-
terest.
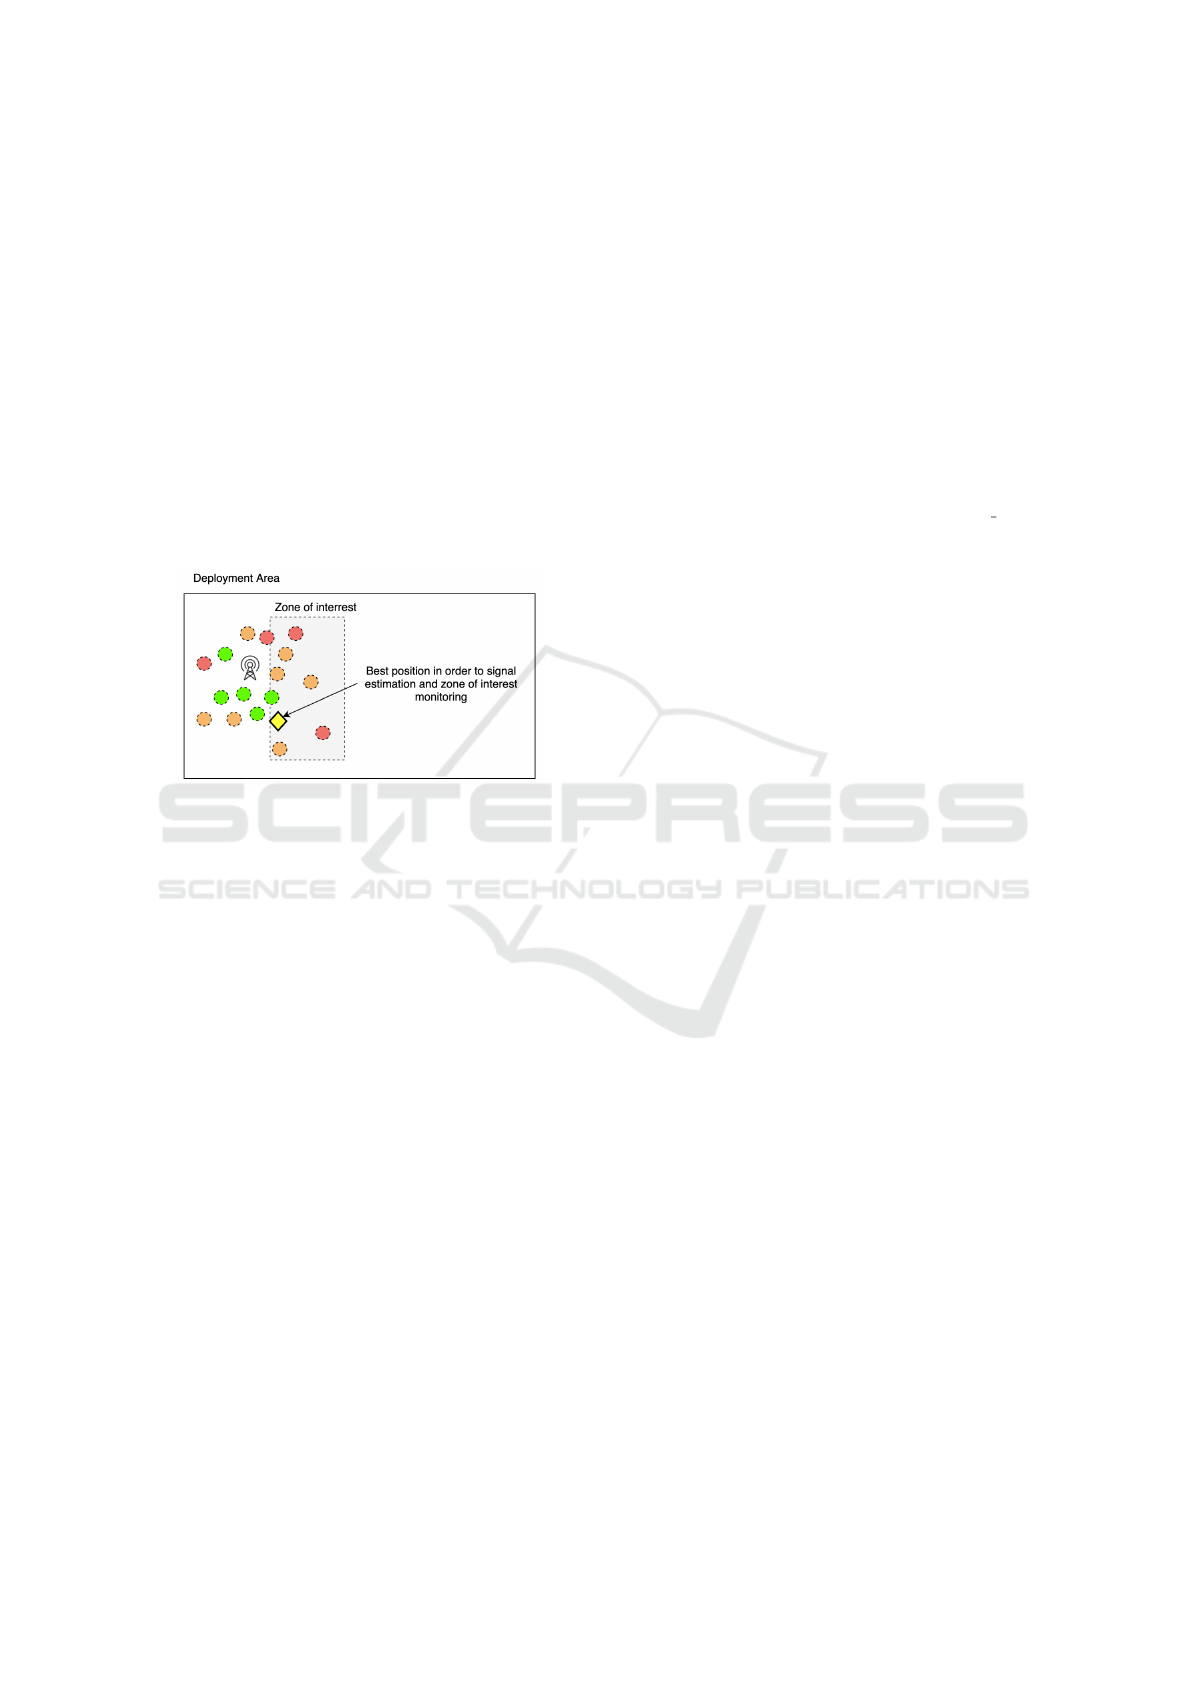
In the example in Figure 8, we can see different
signal qualities collected by field measurements. It
can see that the signal from the antenna is worse to the
northeast of the antenna than to the southeast, proba-
bly due to obstacles (vegetation, buildings) or envi-
ronmental conditions. If we want to place the antenna
in an optimal way (RSSI, gateway link) in an area of
interest, we use an optimisation process; the yellow
diamond represents the result in the Figure 8. This
process can reproduce in different regions of the map.
Figure 8: Example of best position found by signal estima-
tion.
6 CONCLUSION AND
PERSPECTIVES
This paper first presents a literature review on the fac-
tors influencing LoRa signals. In a second step, we
have analysed the RSSI results in a village in Corsica
with its own LoRA network. We see that environ-
mental factors, as well as granite buildings strongly,
influence the signal quality. These exploratory works
lead us to think about optimisation of the deployment
of the devices by using machine learning and optimi-
sation algorithms.
REFERENCES
What is LoRa? | Semtech LoRa Technology | Semtech.
https://www.semtech.com/lora/what-is-lora. Ac-
cessed on 2020-01-22.
Ali, N. A. A., Latiff, N. A. A., and Ismail, I. S. (2019).
Performance of LoRa Network for Environmental
Monitoring System in Bidong Island Terengganu,
Malaysia. International Journal of Advanced Com-
puter Science and Applications (IJACSA), 10(11).
Number: 11 Publisher: The Science and Information
(SAI) Organization Limited.
Alliance, L. (2015). White Paper: A Technical Overview of
Lora and Lorawan. Technical report, CA, USA.
Alset, U., Kulkarni, A., and Mehta, H. (2020). Performance
Analysis of Various LoRaWAN Frequencies For Op-
timal Data Transmission Of Water Quality Parame-
ter Measurement. In 2020 11th International Confer-
ence on Computing, Communication and Networking
Technologies (ICCCNT), pages 1–6, Kharagpur, India.
IEEE.
Ansah, M. R., Sowah, R. A., Meli
`
a-Segu
´
ı, J., Katsriku,
F. A., Vilajosana, X., and Banahene, W. O. (2020).
Characterising foliage influence on LoRaWAN
pathloss in a tropical vegetative environment. IET
Wireless Sensor Systems, 10(5):198–207.
eprint:
https://onlinelibrary.wiley.com/doi/pdf/10.1049/iet-
wss.2019.0201.
Antoine-Santoni, T., Poggi, B., Vittori, E., Hieux, H. V.,
Delhom, M., and Aiello, A. (2019a). Smart entity –
how to build DEVS models from large amount of data
and small amount of knowledge ? In Proceedings
of 11th EAI International Conference on Simulation
Tools and Techniques, pages 615–626. EAI.
Antoine-Santoni, T., Poggi, B., Vittori, E., Manicacci, F.-
M., Gualtieri, J.-S., and Aiello, A. (2019b). Proposi-
tion of a smart environment architecture for resources
monitoring and rural activities management. In Pro-
ceedings of SENSORCOMM 2019, pages 62–68.
Augustin, A., Yi, J., Clausen, T., and Townsley, W. (2016).
A Study of LoRa: Long Range & Low Power Net-
works for the Internet of Things. Sensors, 16(9):1466.
Avila-Campos, P., Astudillo-Salinas, F., Vazquez-Rodas,
A., and Araujo, A. (2019). Evaluation of LoRaWAN
Transmission Range for Wireless Sensor Networks in
Riparian Forests. In Proceedings of the 22nd Inter-
national ACM Conference on Modeling, Analysis and
Simulation of Wireless and Mobile Systems - MSWIM
’19, pages 199–206, Miami Beach, FL, USA. ACM
Press.
Boano, C. A., Cattani, M., and R
¨
omer, K. (2021). Impact
of Temperature Variations on the Reliability of LoRa
- An Experimental Evaluation. pages 39–50.
Dambal, V. A., Mohadikar, S., Kumbhar, A., and Gu-
venc, I. (2019). Improving LoRa Signal Coverage
in Urban and Sub-Urban Environments with UAVs.
arXiv:1902.11243 [eess]. arXiv: 1902.11243.
Doroshkin, A. A., Zadorozhny, A. M., Kus, O. N.,
Prokopyev, V. Y., and Prokopyev, Y. M. (2019). Ex-
perimental Study of LoRa Modulation Immunity to
Doppler Effect in CubeSat Radio Communications.
IEEE Access, 7:75721–75731. Conference Name:
IEEE Access.
Elijah, O., Rahman, T. A., Saharuddin, H., and Khairodin,
F. (2019). Factors that Impact LoRa IoT Communi-
cation Technology. In 2019 IEEE 14th Malaysia In-
ternational Conference on Communication (MICC),
pages 112–117, Selangor, Malaysia. IEEE.
Haxhibeqiri, J., De Poorter, E., Moerman, I., and Hoebeke,
J. (2018). A Survey of LoRaWAN for IoT: From Tech-
nology to Application. Sensors, 18(11):3995.
Factors Influencing LoRa Communication in IoT Deployment: Overview and Experience Analysis
279

Hidayat, M. S., Nugroho, A. P., Sutiarso, L., and Okayasu,
T. (2019). Development of environmental monitor-
ing systems based on LoRa with cloud integration for
rural area. IOP Conference Series: Earth and Envi-
ronmental Science, 355:012010.
Inagaki, K., Narieda, S., Fujii, T., Umebayashi, K., and
Naruse, H. (2019). Measurements of LoRa Propaga-
tion in Harsh Environment: Numerous NLOS Areas
and Ill-Conditioned LoRa Gateway. In 2019 IEEE
90th Vehicular Technology Conference (VTC2019-
Fall), pages 1–5, Honolulu, HI, USA. IEEE.
Iova, O., Murphy, A. L., Picco, G. P., Ghiro, L., Molteni, D.,
Ossi, F., and Cagnacci, F. (2017). LoRa from the City
to the Mountains: Exploration of Hardware and Envi-
ronmental Factors. In Proceedings of the 2017 Inter-
national Conference on Embedded Wireless Systems
and Networks, EWSN ’17, pages 317–322,
USA. Junction Publishing.
Jolliffe, I. T. (2013). Principal Component Analysis.
Springer Science & Business Media.
Jovalekic, N., Drndarevic, V., Darby, I., Zennaro, M.,
Pietrosemoli, E., and Ricciato, F. (2018). LoRa
Transceiver With Improved Characteristics. IEEE
Wireless Communications Letters, 7(6):1058–1061.
Kerlink (2022). Web page of kerlink.
https://www.kerlink.com/product/wirnet-station/.
Pet
¨
aj
¨
aj
¨
arvi, J., Mikhaylov, K., Pettissalo, M., Janhunen,
J., and Iinatti, J. (2017). Performance of a low-
power wide-area network based on LoRa technology:
Doppler robustness, scalability, and coverage. In-
ternational Journal of Distributed Sensor Networks,
13(3):155014771769941.
Qaraqe, M., Althunibat, S., Badarneh, O. S., and Mesleh,
R. (2020). Performance analysis of chirp spread spec-
trum system under mobility scenario. Physical Com-
munication, 43:101233.
Rf-track (2022). Rf-track, tracker 7. https://www.rf-
track.com/balises-de-geolocalisation/.
Shanmuga Sundaram, J. P., Du, W., and Zhao, Z. (2020).
A Survey on LoRa Networking: Research Problems,
Current Solutions, and Open Issues. IEEE Communi-
cations Surveys & Tutorials, 22(1):371–388.
Souza Bezerra, N.,
˚
Ahlund, C., Saguna, S., and
de Sousa, V. A. (2019). Temperature Impact in Lo-
RaWAN—A Case Study in Northern Sweden. Sen-
sors, 19(20):4414. Number: 20 Publisher: Multidis-
ciplinary Digital Publishing Institute.
Villarim, M. R., de Luna, J. V. H., de Farias Medeiros, D.,
Pereira, R. I. S., and de Souza, C. P. (2019). LoRa
Performance Assessment in Dense Urban and Forest
Areas for Environmental Monitoring. In 2019 4th In-
ternational Symposium on Instrumentation Systems,
Circuits and Transducers (INSCIT), pages 1–5, Sao
Paulo, Brazil. IEEE.
Wiyadi, E., Setiadi, R. N., and Umar, L. (2020). Effect
of Vegetation Profile and Air Data Rate on Packet
Loss Performance of LoRa E32-30dBm 433 MHz as a
Wireless Data Transmission. Journal of Physics: Con-
ference Series, 1655:012015. Publisher: IOP Publish-
ing.
Yousuf, A. M., Rochester, E. M., Ousat, B., and Ghaderi,
M. (2018). Throughput, Coverage and Scalability
of LoRa LPWAN for Internet of Things. In 2018
IEEE/ACM 26th International Symposium on Quality
of Service (IWQoS), pages 1–10, Banff, AB, Canada.
IEEE.
Zhu, G., Liao, C., Sakdejayont, T., Lai, I., Narusue, Y., and
Morikawa, H. (2019). Improving the Capacity of a
Mesh LoRa Network by Spreading-Factor-Based Net-
work Clustering. IEEE Access, 7:21584–21596. Con-
ference Name: IEEE Access.
IoTBDS 2022 - 7th International Conference on Internet of Things, Big Data and Security
280
