
Perceived Value of IS Collaboration Support in an SME Ecosystem’s
Innovation Activity
Susanne Marx
1a
, Michael Klotz
1b
and Kurt Sandkuhl
2c
1
Faculty of Business Studies, Stralsund University of Applied Sciences, Stralsund, Germany
2
Institute of Computer Science, University of Rostock, Rostock, Germany
Keywords: Perceived Value, Open Innovation, SME Ecosystem, Collaboration Information System.
Abstract: Networks and ecosystems are involved in Open Innovation (OI) initiatives, their collaboration mediated by
technology. A central element of OI is the generation of value as perceived by involved actors. The paper
investigates how information systems supporting collaboration (CIS) facilitate the generation of perceived
value for OI participants. As multi-method qualitative research, the study uses interview and survey data
derived from an innovation activity jointly implemented by two small and medium-sized enterprises and their
ecosystem (ten participants), facilitated by two tools: video conferencing and online whiteboard software. The
findings suggest specific functionalities and characteristics of these tools to support the development of three
types of value: excellence, efficiency, and emotional value. The identified adverse impacts of the CIS
encourage providing transparent guidelines for behaviour when using the CIS for an ecosystem’s innovation
activity. The tools’ functionalities proved appropriate, with the Perceived Usefulness independent from prior
experience. The research advances the understanding of the role of technology in value generation in an
ecosystem’s innovation activity and supports practitioners in their decisions for digital support for OI. The
study is limited by its small, qualitative approach and focus on the ideation phase of innovation.
1 INTRODUCTION
Value provision is a central topic in open innovation
(OI) research (Chesbrough et al., 2018; Kazadi et al.,
2016; Tidd & Bessant, 2018), yet the role and design
of technology to support the generation of value in
innovation processes need to be further understood
(Chesbrough et al., 2018; Lusch & Nambisan, 2015).
Analyzing calls for future OI research, West &
Bogers (2017) identify network collaboration as a
topic, where the aspect of motivation and value as
perceived by the various actors partaking in OI
activities is relevant for designing such initiatives
(Chesbrough et al., 2018; Kazadi et al., 2016; West &
Bogers, 2014).
OI is “a distributed innovation process based on
purposively managed knowledge flows across
organizational boundaries” (Chesbrough & Bogers,
2014, p.17). Chesbrough et al. (2018) define value in
OI “as all actor-perceived consequences arising from
a
https://orcid.org/0000-0003-3294-5351
b
https://orcid.org/0000-0002-3841-0318
c
https://orcid.org/0000-0002-7431-8412
the deployment of a resource in a process“ (p. 932).
Value is subjective (Lepak et al., 2007; Rivière &
Mencarelli, 2012); thus, the value perceived by the
actors involved in OI can differ. The concept of
perceived value originating from marketing literature
takes up this understanding (Holbrook 1999; Rivière
& Mencarelli 2012; Sweeney & Soutar 2001) which
we suggest applying to study the participation of
actors in OI initiatives.
Technology is applied to enable the participation
of actors belonging to networks and ecosystems in OI
initiatives (Lusch & Nambisan, 2015; Moore, 1993;
Perks et al., 2012; Radziwon & Bogers, 2018).
Although facilitating technology is acknowledged to
support innovation efforts in intra- and inter-
organizational settings (Abbate et al., 2019; Cui et al.,
2018; Scuotto et al., 2017), how specific
functionalities support individually perceived value
remains to be understood. The research presented in
this paper aims to contribute to filling this gap by
256
Marx, S., Klotz, M. and Sandkuhl, K.
Perceived Value of IS Collaboration Support in an SME Ecosystem’s Innovation Activity.
DOI: 10.5220/0011088600003179
In Proceedings of the 24th International Conference on Enterprise Information Systems (ICEIS 2022) - Volume 2, pages 256-267
ISBN: 978-989-758-569-2; ISSN: 2184-4992
Copyright
c
2022 by SCITEPRESS – Science and Technology Publications, Lda. All rights reserved

addressing the research question: How can
collaboration information systems facilitate value
generation in an innovation activity of a small and
medium-sized enterprise (SME) network’s
ecosystem? The term collaboration information
systems (CIS) denotes a category of information
systems (IS) dedicated to supporting collaborative or
group work (cf. section 2.3). The exploratory study
applies a multi-method research design using
interview and survey data collected from an
innovation activity of two SMEs and representatives
from their ecosystem. The results aim to both increase
the understanding of the role of CIS for the generation
of value for participants and support practitioners in
their decisions on digital support for OI initiatives.
2 BACKGROUND
2.1 Perceived Value in Innovation
Activities
The consequences of innovation activities shall be
studied beyond the direct innovation output, the value
proposition that generates revenue, argue several
authors (e.g. Burdon et al., 2015; Reypens et al.,
2016; Sjödin et al., 2020; Westergren, 2011).
Reypens et al. (2016) state that “traditional firm-level
outcomes such as patents or market share no longer
fully represent the range of value created for diverse
stakeholders in a network” (p. 40). This shift from the
single firm view toward the value derived for various
stakeholders is especially apparent for OI initiatives,
where “we need to investigate value as the motivating
factor for participation in both outside-in and inside-
out open-innovation projects“ (Chesbrough et al.,
2018, p. 931). Participants in OI initiatives attribute,
e.g., time resources for which a consequence results:
the actor specific value (Chesbrough et al., 2018).
Value depends on the perception of the beneficiary
(Edvardsson & Tronvoll, 2013; Grönroos, 2011;
Lusch & Nambisan, 2015; Nardelli & Broumels,
2018; Prahalad & Ramaswamy, 2003; Rubalcaba et
al., 2012; Vargo & Lusch, 2016).
The term perceived value stems from marketing
literature, investigating consumers' perceived value
of market offerings (Holbrook 1999; Rivière &
Mencarelli 2012; Sweeney & Soutar 2001). A market
offering could be a service defined “as the application
of specialized competences (knowledge and skills)
through deeds, processes, and performances for the
benefit of another entity or the entity itself.“ (Vargo
& Lusch, 2004, p. 2). The participation of various
actors in OI activities of firms could be interpreted as
a mutual service, with the firm creating the
opportunity for participation, the actors applying their
specific competencies, thus consuming the offering of
the innovation activity providing their time resources.
For their competencies and time resources, they
achieve actor specific value (Chesbrough et al.,
2018). We, therefore, suggest analyzing the
participation in the innovation activity via the concept
of perceived value.
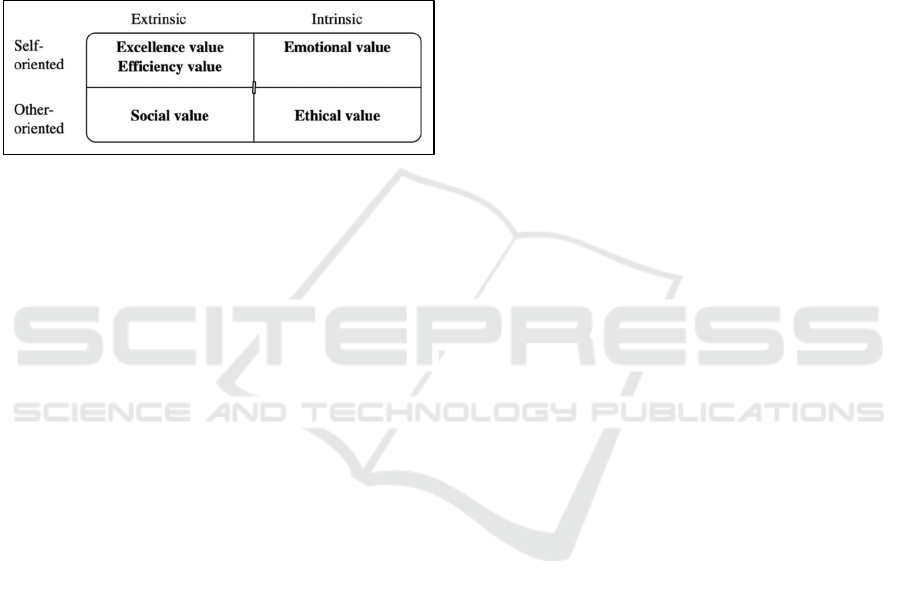
A typology for perceived value is suggested by
Holbrook (1999), distinguishing extrinsic versus
intrinsic value as well as self- and other-oriented.
Coutelle-Brillet et al. (2014) adapt Holbrook’s
structure suggesting six different value categories:
excellence, efficiency, emotional, social,
altruistic/ethical value, and interactional value,
stemming from the interaction of the actors. As the
present research investigates a joint innovation
activity of various actors, we assume that most value
experiences relate to interaction with others, which is
why we see it not as a separate category but inherent
to the other value types. For this research, we describe
the following perceived value categories with
examples inspired from (Chesbrough et al., 2018;
Coutelle-Brillet et al., 2014; Mahr et al., 2014)
displayed in
Figure 1:
• Excellence value: A means to an end, to achieve a
goal (e.g., results achieved, knowledge acquired,
money received) (“one admires … some
experience for its capacity to accomplish some
goal or to perform some function” (Holbrook,
1999, p. 15), “derived from the utility
characteristics, quality, performance, and
“excellence” of the offer” (Coutelle-Brillet et al.,
2014, p. 166)
• Efficiency value: Ratio of outputs to inputs, e.g.,
time savings, convenience, monetary
compensation versus resources (“measured as a
ratio of outputs to inputs” (Holbrook, 1999, p. 13)
• Emotional value: Feelings, emotional, or affective
reaction including play and aesthetics/beauty for
its own sake, e.g., enjoyment, the fun of
challenges, being part of something important
(“derived from the feelings or emotional and
affective states elicited by a product” (Coutelle-
Brillet et al., 2014, p. 166), unites the concepts of
play: “self-oriented experience - actively sought
and enjoyed for its own sake” (Holbrook, 1999, p.
18) and aesthetics/beauty: “aesthetic value in
general or beauty in particular is that it is enjoyed
purely for its own sake” (Holbrook, 1999, p. 20)
• Social value: Status or esteem to be gained from
others, e.g. improving own image or reputation
("relates to building a self-image that an
Perceived Value of IS Collaboration Support in an SME Ecosystem’s Innovation Activity
257
individual reflects to 'others' (Coutelle-Brillet et
al., 2014, p. 166), unites the categories status and
esteem to be gained from others (Holbrook,
1999))
• Ethical value: For the benefit of "others", e.g.
good citizenship (“ethics involves doing
something for the sake of others” (Holbrook,
1999, p. 21))
Holbrook also counts spirituality, a value by
adoration of, e.g., a Divine Power, which we consider
non-relevant in the field of industry and is not subject
in Coutelle-Brillet et al. (2014).
Figure 1: Typology of perceived value based on Holbrook
(1999) and Coutelle-Brillet et al. (2014).
2.2 Networks and Ecosystems in
Innovation Activities
Networks have been increasingly discussed since the
1990ies (Sydow, 2003), yet, the term is not uniformly
defined (Provan et al., 2007). The terms network (e.g.
Sydow, 2003) and network organization (Moretti,
2017) are used synonymously and distinguished from
the organizational entity of the network administrative
organization (Provan & Kenis, 2007). Sydow (2003)
identifies a network as a form of cooperation within or
between relatively autonomous organizations or units,
tied in a net of relations. Moretti (2017) defines in a
similar direction yet focusing the inter-organizational
perspective: “The network organization is constituted
by autonomous and independent organizations (or
individuals acting on behalf of the organization), which
are connected by enduring and repeated exchange
relationships, and which may or may not pursue a
collective common goal“ (p. 24). Interorganizational
networks are rarely researched for initiating OI (Sydow
& Müller-Seitz, 2020).
The term ecosystem has gained considerable
attention in innovation and service-related literature
(Lusch & Nambisan, 2015; Moore, 1993; Perks et al.,
2012; Radziwon & Bogers, 2018). In 1993, Moore
suggested looking at the business ecosystem
collaborating for innovation to gain an advantage
competing with other business ecosystems. Radziwon
and Bogers (2018) define four elements of such an
ecosystem: co-evolution, interdependencies,
orchestration, and proximity. The definition of a
service ecosystem by Lusch & Nambisan (2015)
instead focusses the self-containing aspect as a
possible distinction from a network: “relatively self-
contained, self-adjusting system of mostly loosely
coupled social and economic (resource-integrating)
actors connected by shared institutional logics and
mutual value creation through service exchange.” (p.
162). Following this definition, we conclude that
relations are consciously built with a set of mainly
organizational actors engaged in repeated relations
for a network, while an ecosystem is broader in terms
of individual actors of mutual influence. Despite the
attention to the ecosystem view in innovation, Kazadi
et al. (2016) conclude that "few studies consider firms
that simultaneously include a diverse set of
stakeholders in their innovation projects" (p. 525).
We conclude that an organization might engage in
innovation activities in organizational networks yet
also involve a broader ecosystem.
While Fasnacht (2018) claims that there is
“evidence that the most effective innovators
succeeded because of their creative communities
where a community consists of individuals or a group,
interconnected through a digital platform” (p. 144),
the design of such IT support is recommended for
further research (Chesbrough et al., 2018; Lusch &
Nambisan, 2015).
2.3 Information Systems in Innovation
Activities
As part of the service innovation framework, Lusch
and Nambisan (2015) regard information technology
(IT) as an enabler and facilitator in the process of
value creation across a network of actors. In an
empirical study, Cui et al. (2018) confirmed that IT-
enablement in the inter-organizational innovation
process supports OI performance measured by
innovativeness and speed to market. Scuotto et al.
(2017) also found a positive relationship between the
use of information and communication technologies
for facilitating communication, information
exchange, and workflow and the innovation
performance in SMEs. Abbate et al. (2019) research
an OI platform used for knowledge co-creation in a
B2B regional network in Italy, concluding that such a
platform has to provide support for specific services
in the innovation process, such as identifying and
relating to participants or facilitating collaboration.
While functionalities seem to be investigated to some
extent, understanding how IS supports the
development of the perceived value of different
participants in innovation activities remains to be
ICEIS 2022 - 24th International Conference on Enterprise Information Systems
258

further understood. Different categorizations of IS
have been proposed in the literature (see, e.g., Laudon
and Laudon 1988)). The category in the focus of work
is IS supporting collaborative work in an
organization. The term collaborative information
systems (CIS) will be used for this category (see also
Lehner et al., 2008) that is strongly related to
groupware systems and computer-supported
collaborative work (CSCW) (Rodden, 1991)).
To investigate this aspect of technological
support, we use selected constructs and items of the
technology acceptance model TAM3 (Venkatesh &
Bala, 2008), widely used and well-accepted
(Marangunić & Granić, 2015), and the D&M IS
Success Model (DeLone & McLean, 2003). The
TAM3 constructs in focus for our research project are
Perceived Usefulness, Perceived Ease of Use, and
Behavioral Intention, which shall help understand the
benefit of the used digital platform to support the
innovation activity across an SME ecosystem.
Perceived Ease of Use affects both Perceived
Usefulness and Behavioral Intention. This effect is
moderated by experience, in that with increasing
experience with the information system for Perceived
Usefulness, the effect becomes stronger, while for
Behavioral Intention, the effect becomes weaker
(Venkatesh & Bala, 2008). Therefore, we assume that
with a different level of experience of applied systems
facilitating the innovation activity, the results of the
selected constructs differ significantly in favour of the
system for which participants have prior experience.
The construct relevant to understanding value in
the updated D&M IS Success Model (DeLone &
McLean, 2003) are the net benefits, later adapted to
net impacts (DeLone & McLean, 2016). DeLone and
McLean (2016) define net impacts as “the extent to
which information systems are contributing (or not
contributing) to the success of individuals, groups,
organizations, industries, and nations" (p. 11). The
understanding of net impacts would also allow
negative impacts. Our research focuses on the
individual participants, the group (ecosystem) and the
organizations (the SMEs); we approach identifying
net impacts on these levels.
2.4 Research Question
Given the importance of CIS facilitating the value
creation in innovation processes, the value
individually perceived by the actors involved might
help decide for IS solutions to attract participants into
OI activities. We, therefore, ask: How can
collaboration information systems facilitate value
generation in an innovation activity of an SME
network’s ecosystem? We break this question down
into the following sub-questions: To which types of
perceived value can the CIS contribute? What
functionalities and characteristics of the CIS
contribute to the perceived value perceived by the
actors? Do the Perceived Ease of Use, Perceived
Usefulness, and Behavioral Intention differ with
previous CIS experiences?
3 RESEARCH METHODOLOGY
We conducted an exploratory, multi-method
qualitative study to assess the perceived value of IS
support in an ecosystem's innovation activities. To
understand the perception of net impacts of IS, semi-
structured interviews and a survey on the selected
TAM3 constructs were applied. Although the data
collection technique of the survey might qualify as
quantitative, we still regard it as a qualitative study
due to the small sample size and for its purpose as an
additional amendment to the interview data. The
study is embedded in a case study of a heterarchical
network. Case studies are recommended for
researching innovation (Elsahn et al., 2020) and are
suitable to answer "how"-questions with limited
control over the environment in which the research is
conducted (Yin, 2006).
Table 1: Description of participants (company: A – B;
status: O – Owner, E – Employee, F – Family/Friend; work
experience: O - < 1 year, F - 1 to 5 years, S - 6 to 10 years,
T - > 10 years; experience: y – yes, b – basic, n – no).
Participant
No.
1 2 3 4 5 6 7 8 9 10
SME AAAAA B B B BB
Status to
owner SME
O E E F F O E F E E
Work
ex
p
erience
T T T T O T S T N T
Interview
in minutes
23 15 17 17 23 19 14 15 18 20
Experience
VC Zoo
m
y y y y y y y y y y
Experience
OW Mural
n n n b n b n n n b
The sampling technique combined self-selection
and snowball sampling (Saunders et al., 2009). Two
self-selected tour operator SMEs engaged in a
heterarchical network invited four representatives
from their respective ecosystems for a joint
innovation activity. This joint innovation activity was
facilitated online by the CIS Zoom (video
conferencing (VC)) and Mural (online whiteboard
Perceived Value of IS Collaboration Support in an SME Ecosystem’s Innovation Activity
259

(OW)). The tourism sector seemed appropriate
because of its networked nature, and further research
on innovation in this industry is recommended
(Hjalager, 2010; Rubalcaba et al., 2012). Ten
individuals participated in the study: the two owners,
five employees (one freelancer), and three belonging
to the group family/friend. The snowball sampling by
the SME owners resulted in no participation of
customers. Although some respondents were also
customers of the SME, they considered their primary
relationship to the SME owner differently. Most
participants had work experience of over ten years
(Table 1). All participants had prior experience with
the VC Zoom. Before the joint online innovation
activity, they were introduced to the OW Mural’s
functionalities by a short demonstration of about five
minutes.
3.1 Interviews
Ten interviews were conducted in April 2021,
between three and seven days after the joint online
innovation activity. Each interview had a length of 14
to 23 minutes. Based on the construct of net impacts
(DeLone & McLean, 2016), we asked three questions
regarding the CIS support: How did the CIS
contribute (or not contribute) to the success of
• your individual participation in the innovation
activity?
• the collaboration with the other participants in the
innovation activity?
• the joint innovation activity for the SME(s)?
The semi-structured interviews were recorded
and transcribed. For the qualitative analysis, we
followed the six-step-process for systemic focused
interview analysis with MAXQDA (Kuckartz &
Rädiker, 2020):
• Prepare the data and explore
• From the interview structure to the category
system
• Coding interviews (Basis)
• Coding (Detailed)
• Analysis
• Documentation
The first level categories were derived
deductively based on the perceived value constructs
in
Figure 1. The second and third levels were
identified inductively how the IS supported these
types of value. Kuckartz and Rädiker (2020)
recommend using methods for improving coding
quality instead of working with coefficients such as
Krippendorff's Alpha, especially applying intracoder-
testing earliest two weeks after initial coding, which
we performed 21 days after initial coding.
3.2 Survey
The survey investigated selected TAM3 constructs
measured using a 7-point Likert scale (Venkatesh &
Bala, 2008). The items for Perceived Usefulness
relate to the purpose of use in original to the “job” in
general of the user (Venkatesh & Bala, 2008). In our
case, we focus on the Perceived Usefulness for the
innovation activity that might instead be part of a
task, not necessarily of the participant's job. Thus, the
items were adapted for that purpose (Table 2). The
study was implemented with German SMEs requiring
translation of the TAM3 items. For the translation, we
applied the method of back translation (Douglas &
Craig, 2007), translating from the original to the
target language, in our case German, and then
translating back by a different bilingual person to the
original language (Douglas & Craig, 2007; Sinaiko &
Brislin, 1973), in our case by a professional translator.
The questionnaire was pre-tested to ensure its
comprehensibility (Behr, 2017; Douglas & Craig,
2007) by two bilingual persons, one assisted and one
un-assisted by the researchers, while the wording was
adapted accordingly.
Table 2: Selected constructs and items based on Venkatesh
and Bala (2008, pp. 313-314) – adaptations in italic.
Perceived Usefulness
- Using the system improves my performance in my
job. Using the system improves my participation
in the online innovation event.
- Using the system in my job increases my
productivity. Using the system in the online
innovation event increases my productivity.
- Using the system enhances my effectiveness in my
job. Using the system enhances my effectiveness
in the online innovation event.
- I find the system to be useful in my job. I find the
system to be useful for participating in the online
innovation event.
Perceived Ease of Use
- My interaction with the system is clear and
understandable.
- Interacting with the system does not require a lot of
my mental effort.
- I find the system to be easy to use.
- I find it easy to get the system to do what I want it
to do.
Behavioral Intention
- Assuming I had access to the system, I intend to use
it.
- Given that I had access to the system, I predict that
I would use it.
- I
p
lan to use the s
y
stem in the next <n> months.
The items from TAM3 (Table 2) are measured
separately for both IS. We then analyze differences
ICEIS 2022 - 24th International Conference on Enterprise Information Systems
260

between the two software tools used, hypothesizing
that the VC reaches higher results on the selected
TAM3 constructs than the OW. With n≤10, the data
is considered a small sample for which no normal
distribution can be assumed, and nonparametric tests
are preferable (Stiefl, 2018). The Wilcoxon signed-
rank test is applied to analyze the data from a paired
sample when no normal distribution can be assumed
(King et al., 2011; Schulz, 2019; Siegel, 1956; Stiefl,
2018; Wilcoxon, 1946). The test relies on a minimum
of 5 paired data sets (Schulz, 2019). For small
samples of n≤25, specific critical values for the test
statistic T apply (Siegel, 1956). The significance level
α is set to 0.05.
To measure the effect size, we apply the matched-
pairs rank biserial correlation coefficient (King et al.,
2011; Tomczak & Tomczak, 2014), that calculates
with the test statistic only, not via the z-value as in
other approaches (Field, 2013; Schulz, 2019):
𝑟
=
4 𝑇 −
𝑅
+ 𝑅
2
𝑛
𝑛+1
Ties are those pairs in the test statistic T that show
no difference and reduce n in the Wilcoxon signed-
rank test. Varying interpretations are found in the
literature on the n of the effect size for the test, e.g.,
generally the number of pairs (Marschall and
Marquier, n.d.), the sample size (Fritz et al., 2012;
Mayr et al., 2017; Rosenthal, 1994), or the number of
observations (Field, 2013; Tomczak and Tomczak,
2014). We apply n as the number of pairs including
ties, as they could be interpreted as reducing the
effect. The effect size can thus only reach 1.0 if all
pairs deviate in the same direction and no ties are
amongst the samples. R is interpreted (Cohen, 1988):
small effect size r = .1, medium effect size r = .3,
large effect size r = .5. Due to the small sample size,
distribution was not determined, preventing a
meaningful power analysis (Rasch et al., 2014).
4 RESULTS
4.1 Interviews
The interviews identify three value categories
supported by the two software tools used in the case
study innovation activity - the VC and the OW:
excellence, efficiency, and emotional value (Table 3).
In general, more detailed replies were given for the
OW since the VC was already known and such
common practice to all participants, making it difficult
for them to identify specific positive or negative
impacts, as this software seemed fundamental to them
to enable them collaborative work online.
Overall, it can be said that the combination of VC
and OW seemed sufficient and appropriate, supporting
various forms of perceived value. A few items were
identified as having adverse effects as well.
Table 3: Value categories supported by CIS in innovation
activity (unit = number of interview transcripts, n = 10).
Value categor
y
VC OW Both
EX – Excellence value
EX - Results achieved online
Sim
p
lifies documentation 1 4 -
Visualizes ideas - 3 -
EX - Work performed online
Supports decision making - 2 -
Enables synchronous individual wor
k
- 4-
Enables synchronous group
collaboration
1 2 -
Enables asynchronous group
collaboration
- 4 -
EX - Ne
g
ative
Reduced creativity - 1 -
Not increasing creativit
y
- 1 -
EF - Efficienc
y
value
EF - Time savin
g
s
Is technicall
y
reliable 1 1 -
Provides overview - 3 -
Supports moderation - 5 -
Standardizes - 1 -
EF - Limited in
p
ut re
q
uired
Is eas
y
to use 2 3 -
Is well known 1 1 -
EF - Negative
Distraction by using two CIS 1 - 1
Distraction b
y
simultaneous wor
k
- 1 -
Time effort new s
y
stem - 1 -
Uncertaint
y
1 - -
EM - Emotional value
EM - Seriousness
Fosters politeness - - 1
Su
pp
orts commitment - 1 -
EM - Belon
g
in
g
to
g
rou
p
Su
pp
orts interaction with others - 1 -
Visualizes others' work in progress - 3 -
EM - Play
Uses fun icons - 1 -
Su
pp
orts interactivit
y
(
entertainment
)
- 2-
EM - Ex
p
ress and
p
erceive emotions
Supports non-verbal communication 8 - -
Supports verbal communication 4 - -
EM - Negative
Perceived non-seriousness 2 - -
Personal dislike - 1 -
No advanta
g
e - 1 -
Lack of intuitive feeling - - 1
Lack of commitment - - 1
Perceived Value of IS Collaboration Support in an SME Ecosystem’s Innovation Activity
261

Excellence value is attributed to using a service or
tool to an end and achieving a goal. Here, we
identified that the CIS is used to achieve results of the
innovation activity and the work performed in a group
online due to the dispersion of the participants. The
CIS supports this value by enabling documentation of
results and the visualization of ideas. It both supports
individual work, synchronous and asynchronous
group collaboration, and decision-making processes
with the group.
Possible adverse effects on the value caused by
the CIS could be reducing or at least not increasing
creativity, thus potentially diminishing the results
achieved.
Efficiency value considers attributed outputs
versus inputs, with efficiency value in this research
stemming from time savings and limited required
input. Time savings by applying the CIS result from
a technically reliable system that is stable throughout
the interaction, standardizes how participants provide
input, allows a moderator to provide guidance, and
provides an overview of tasks. The limited input
required is based firstly on the perceived ease of use
of the CIS and secondly on prior knowledge of the
CIS. Possible adverse effects on the value of applying
the CIS is the time effort to learn a new system.
Another effect stems from using two systems in
parallel, e.g., by switching devices or the software
displayed in several windows. Using two CIS might
even result in uncertainty if participant contributions
have been made in the correct system and can be seen
by other participants. Additional clarification might
cost extra time. The OW, which visualizes the work
of other participants simultaneously, might also cause
distraction.
For the intrinsic emotional value, four value codes
have been identified: the expression and perception of
emotions, belonging to the group, play, and
seriousness. The CIS supporting the display of
emotions beyond voice is perceived to generate value,
by firstly allowing to see other participants in general
to get a personal impression, but also more
specifically to display mimic and gestures oneself, yet
also to interpret these of others to get a better feeling
for what a person means and feels. Nevertheless, this
functionality has to be taken with care. The VC
transmitting non-work-related activities has caused a
perceived non-seriousness by other participants,
potentially reducing motivation for their engagement.
The observed behavior might be explained by the
different backgrounds of participants mixed from
work and the personal background of the SME
entrepreneurs, thus seeing their participation as either
work or leisure. However, seriousness was
established as a factor for emotional value, with CIS
fostering polite behavior of participants, e.g., by not
interrupting, raising hands, and making contributions
tangible by visualizing them. Thus, the aspect of
seriousness is relevant to participants, yet the
contribution of CIS is discussed contradictory. The
CIS fosters the value factor of belonging to a group
or establishing a group feeling. It helps to interact
with others to have the feeling of collaborative group
work, which is appreciated, but also the CIS
visualizes what others work on. This sense of activity
visualized by the CIS drives motivation and a feeling
of being part of a group. A final aspect is play, where
the CIS uses, e.g., fun icons, but mainly supports
interactivity of various kinds perceived as
entertaining. Apart from the perceived lacking
seriousness, other aspects potentially harming
emotional value are an unspecific personal dislike, or
seeing no direct advantage, a felt lack of commitment
as participants could easily drop out of the online
activity, and, despite video transmission, a lack of
feeling for the group.
The frequency of third level categories was only
counted once per interview (Table 3). The
functionalities mentioned most frequently
unprompted and unweighted by the interviewees
were:
• supporting non-verbal and verbal
communication for emotional value,
• allowing moderation, giving an overview, and
being easy to use for efficiency value,
• enabling both group collaboration and
individual work and documentation for
excellence value.
Negative impacts seemed relatively rare in terms of
frequency, with only one to two mentions. We
identified some contradictions of positive and
negative impacts. While a respondent said CIS
increases commitment, another claimed it reduces it.
As discussed before, the same applies for distraction
versus improved guidance or supporting seriousness
versus non-seriousness. From these findings, we
conclude that not only do perceptions of value differ
but also the effect CIS has on them.
Other-oriented value categories (SO - Social
Value, ET - Ethical value) could not be identified in
this study, although generally possible. Ethical value
could be data privacy, e.g., allowing a background
picture in the VC or a warning when recording starts,
but the interviewees mentioned neither. Social value
could be the display of badges, qualifications, or
titles, but the interviewees did not mention it.
ICEIS 2022 - 24th International Conference on Enterprise Information Systems
262

Table 4: Means and Wilcoxon signed-rank test of the two software tools (Pairs: ET – excl. ties, IT – incl. ties).
Construct Mean Pairs Result Wilcoxon signed-rank test Eff. size r
c
incl. ties
VC OW ET IT
Perceived Ease of
Use
6.45 5.20 8 10 Reject one-tailed null-hypothesis for negative ranks,
means VC > OW. (T = 0)
0.65
Perceived
Usefulness
5.55 5.40 9 10 Accept null hypothesis. (T = 20)
Behavioral
Intention
6.17 4.43 7 10 Reject one-tailed null-hypothesis for negative ranks,
means VC > OW. (T = 2)
0.44
4.2 Survey
While agreement on the items for the selected TAM3
constructs on the VC is high on all constructs 5.37-
6.45 mean), it is less but still rather considerable on
the OW (4.43-5.40 mean), treating the Likert scale as
ordinal for calculating the mean (Table 4).
Performing the Wilcoxon signed-rank test as
described in 3.2, the null hypothesis must be accepted
for the Perceived Usefulness construct. There is no
significant difference in the VC and the OW
evaluation.
For the Perceived Ease of Use and Behavioral
Intention constructs, the one-tailed null hypothesis
must be rejected, with a medium to high effect of the
significant difference (r
c
=0.65 and 0.44), supporting
a significantly higher agreement with the VC.
Therefore, although demonstrating general
acceptance of these software tools in facilitating the
innovation activity, the VC is perceived as easier to
use with a higher intention of future usage.
5 DISCUSSION
The CIS prove to be an enabler for the inter-
organizational innovation activity in line with Cui et
al. (2018) and the generation of perceived value.
Based on the perceived value model (Coutelle-Brillet
et al., 2014; Holbrook, 1999), we identify extrinsic
and intrinsic value types supported by the CIS, yet,
only self-, but not other-oriented value. While this
result is limited by the small sample, from this study,
we conclude that CIS support is facilitating self-
oriented value types: excellence, efficiency, and
emotional value.
Specific functionalities can be attributed to help
build perceived value. Apart from facilitating
communication and collaboration in general (Abbate
et al., 2019; Scuotto et al., 2017), we could attribute
these functionalities to perceived value categories,
with excellence value derived by documentation,
visualization of ideas, and decision-making
functionalities, efficiency value by technical
reliability, providing an overview, standardization,
moderation, ease of use, and former CIS experience,
and emotional value by supporting seriousness, group
identification, play, and transmission of emotions in
the communication process. The study showed that
not only is value subjective (Lepak et al., 2007;
Rivière & Mencarelli, 2012) but also how the CIS
supports the establishment of perceived value in the
innovation activity individually, with single
functionalities mentioned ranging in frequencies
between one to seven.
In line with the understanding net impacts of CIS
(DeLone & McLean, 2003, 2016), both positive and
negative impacts were found. Special consideration
needs to be given to emotional value that CIS can both
support and harm. Extending the view from a network
of organizations (Moretti, 2017; Sydow, 2003;
Sydow & Müller-Seitz, 2020) with professionals
towards an ecosystems view (Lusch & Nambisan,
2015; Moore, 1993; Perks et al., 2012; Radziwon &
Bogers, 2018) mixes profit-oriented and non-profit-
oriented actors (Kazadi et al., 2016). The observed
behavior of participants partly in their private
environment might harm emotional value. Thus,
beyond giving instructions on how to use the CIS,
further guidelines are needed on the effects and
functionalities of the CIS for other users, e.g., what
data the CIS transmits.
Both software tools used in the innovation activity
received mean values above the midpoint for the
TAM3 constructs of Perceived Ease of Use,
Behavioral Intention, and Perceived Usefulness
(Venkatesh & Bala, 2008) despite the different
experience levels for both CIS. All participants knew
the VC before and were thoroughly familiar with it;
while 70% did not know the OW before, 30% had
basic experiences. We found a significant difference
in Perceived Ease of Use between the systems, which
might be explained by experience moderating the
Perceived Value of IS Collaboration Support in an SME Ecosystem’s Innovation Activity
263
effect of various determinants to this construct
(Venkatesh & Bala, 2008). The higher experience
was expected to strengthen the effect of Perceived
Ease of Use on Perceived Usefulness (Venkatesh &
Bala, 2008), implying that with a significantly higher
Perceived Ease of Use of the VC, the Perceived
Usefulness should also be significantly higher with an
even more significant effect. Despite the difference in
experience, the construct of Perceived Usefulness did
not produce significantly different results. This might
be explained by other influencing determinant
factors, e.g., image, job relevance, or output quality,
that were not part of this study. However, it might also
be affected by participants' motivation to join an OI
activity, where the value of improving skills might
extend towards getting to know new CIS, an
expectation that the SME owners had for the online
innovation activity. The overall positive results in the
TAM3 constructs for both CIS applied in the
innovation activity confirm the overall suitability of a
VC and OW to support such online innovation
activity. We conclude that while prior experience
with the CIS might impact the Perceived Ease of Use
and with that the Behavioral Intention, the Perceived
Usefulness seems independent from prior experience.
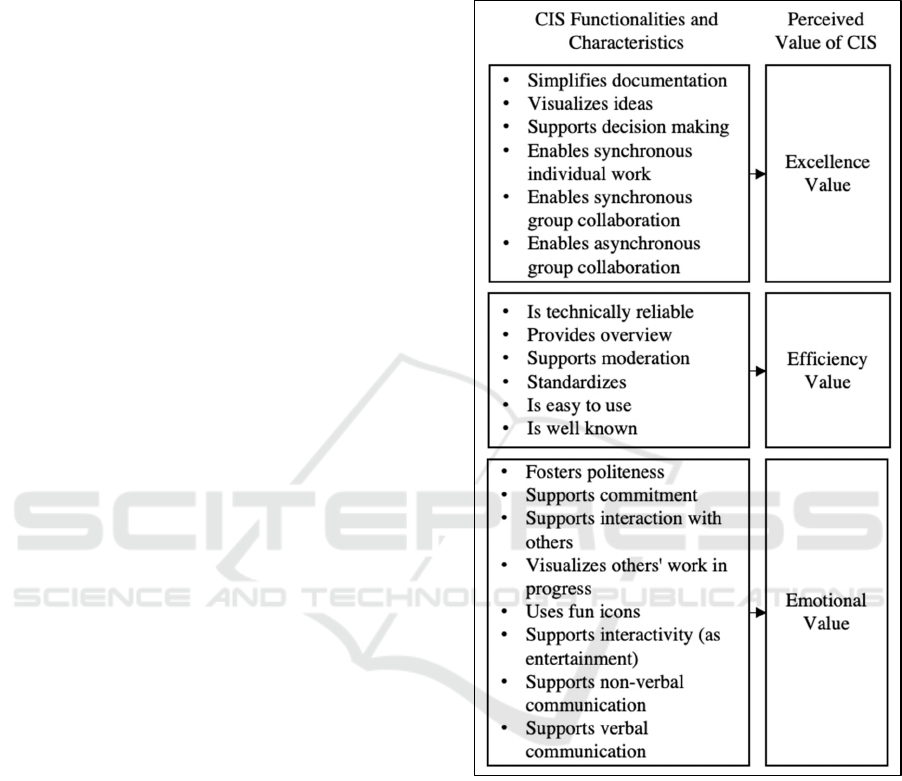
Although limited by the small example from
which we cannot generalize the descriptive findings,
we propose a causal model based on the qualitative
data in line with (Kuckartz & Rädiker, 2020) (Figure
2). The functionalities and characteristics of the CIS
applied in an innovation activity with an ecosystem
seem to facilitate the generation of individually
perceived excellence, efficiency, and emotional
value.
6 CONCLUSIONS
CIS enable innovation activities of networks and their
ecosystem members. Their functionalities facilitate
the achievement of participants' perceived value, a
central element in OI research (Chesbrough et al.,
2018; Kazadi et al., 2016; Tidd & Bessant, 2018).
Understanding this value can help to attract
participants to OI initiatives. Although CIS is
accepted to bring about innovation activities among
many participants, its selection potentially impacts
the perceived value. The selection should be guided
towards enabling excellence, efficiency, and
emotional value, yet, with functionalities strictly and
only suiting the task at hand, amended by behavioral
guidelines for the participants. The most suitable
software can only unfold its value-generating effect
when applied by the participants in a beneficial way,
thus, confirming the understanding of the digital
facilitation in the innovation activity as an
information system, inextricably linking technology
and behavior (Hevner et al., 2004).
Figure 2: Contribution of CIS to perceived value in
innovation activities in a network ecosystem
Contribution to Theory: This study contributes to
the understanding of how technology and its
functionalities and characteristics can support the
generation of perceived value in a network
ecosystem’s innovation activity, thus both advancing
the knowledge about technology’s role (Chesbrough
et al., 2018; Lusch & Nambisan, 2015) but also to the
strand of research on OI in networks (West & Bogers,
2017). The identified perceived value types of
efficiency, excellence, and emotional value supported
by specific software tools functions can help
understand actors' motivation for participating in OI
initiatives facilitated by information technology. We
ICEIS 2022 - 24th International Conference on Enterprise Information Systems
264

propose a link of the information system
functionalities to the identified three types of
perceived value and demonstrate how specific
software functionalities can contribute to the
perceived value for OI participants. We suggest that
in the setting of OI, participants' prior experience with
software is independent of Perceived Usefulness.
Contribution to Practice: Practitioners are
informed about the digital facilitation of potential OI
initiatives. The selection of the two software
products, a VC and an OW, proved sufficient to
support the ecosystem's innovation activity. The use
of established tools familiar to the participants is
recommendable, yet other systems that appear easy to
use can help drive value generation. The tools should
be as few as possible, accompanied with clear
guidance on how to use them and how to behave
appropriately in digitally facilitated activities,
especially when involving people from work and
personal backgrounds. The most important
characteristics for choosing digital tools to support
value generation in an OI innovation activity are:
video streaming, ease of use, support both individual
and group work, and document achieved results.
Limitations: The research is based on a small
sample involving two companies from a network with
selected representatives from their ecosystems,
summing up to ten participants. The qualitative study
provides exploratory insights yet needs further
empirical research for generalization. The study is
also limited by the two types of software used in the
innovation activity, and this activity focuses only on
the ideation stage of the innovation process.
Future Research: Future work is recommended in
two directions extending the reliability of the
findings: extending the number of participants and
extending the research to further stages of the
innovation process.
REFERENCES
Abbate, T., Codini , A. P. & Aquilani, B. (2019).
Knowledge co-creation in Open Innovation Digital
Platforms: processes, tools and services. Journal of
Business and Industrial Marketing, 34(7), 1434-1447.
https://doi.org/10.1108/JBIM-09-2018-0276
Behr, D. (2017). Assessing the use of back translation: the
shortcomings of back translation as a quality testing
method. International Journal of Social Research
Methodology, 20(6), 573-584. https://doi.org/10.1080/
13645579.2016.1252188.
Burdon, S., Mooney, G. R. & Al-Kilidar, H. (2015).
Navigating service sector innovation using co-creation
partnerships. Journal of Service Theory and Practice,
25(3), 285-303. https://doi.org/10.1108/JSTP-08-2013-
0164
Chesbrough, H., Lettl, C. & Ritter, T. (2018). Value
Creation and Value Capture in Open Innovation.
Journal of Product Innovation Management, 35(6),
930-938. https://doi.org/10.1111/jpim.12471
Chesbrough, H. & Bogers, M. (2014). Explicating Open
Innovation: Clarifying an Emerging Paradigm for
Understanding Innovation. In H. Chesbrough, W.
Vanhaverbeke & J. West J (Eds.), New Frontiers in
Open Innovation (pp. 3-28). Oxford University Press.
Cohen, J. (1988). Statistical Power Analysis for the
Behavioral Sciences (2nd ed.). Lawrence Erlbaum
Associates.
Coutelle-Brillet, P., Riviere, A. & des Garets, V. (2014).
Perceived value of service innovation: A conceptual
framework. Journal of Business and Industrial
Marketing, 29(2), 164-172. https://doi.org/10.1108/
JBIM-04-2012-0066
Cui, T., Wu, Y. & Tong, Y. (2018). Exploring ideation and
implementation openness in open innovation projects:
IT-enabled absorptive capacity perspective.
Information and Management, 55(5), 576-587.
https://doi.org/10.1016/j.im.2017.12.002
DeLone, W. H. & McLean, E. R. (2003). Model of
information systems success: A ten-year update.
Journal of Management Information Systems, 19(4), 9-
30. https://doi.org/10.1073/pnas.0914199107
DeLone, W. H. & McLean, E. R. (2016) Information
Systems Success Measurement. now Publishers Inc.
Douglas, S. P. & Craig, C. S. (2007). Collaborative and
iterative translation: An alternative approach to back
translation. Journal of International Marketing, 15(1),
30–43. https://doi.org/10.1509/jimk.15.1.030
Edvardsson, B. & Tronvoll, B. (2013). A new
conceptualization of service innovation grounded in S-
D logic and service systems. International Journal of
Quality and Service Sciences, 5(1): 19-31.
https://doi.org/10.1108/17566691311316220
Elsahn, Z., Callagher, L., Husted, K., Korber, S. & Siedlok,
F. (2020). Are rigor and transparency enough? Review
and future directions for case studies in technology and
innovation Management.
R and D Management, 50(3),
309-328. https://doi.org/10.1111/radm.12412
Fasnacht, D. (2018) Open Innovation Ecosystems: Creating
New Value Constellations in the Financial Services
(2nd ed.). Springer.
Field, A. (2013). Discovering Statistics Using IBM SPSS
Statistics. SAGE Publications.
Fritz, C. O., Morris, P. E. & Richler, J. J. (2012). Effect size
estimates: Current use, calculations, and interpretation.
Journal of Experimental Psychology: General, 141(1),
2-18. https://doi.org/10.1037/a0024338
Grönroos, C. (2011). Value co-creation in service logic: A
critical analysis. Marketing Theory, 11(3): 279-301.
https://doi.org/10.1177/1470593111408177
Hevner, A. R., March, S.T., Park, J., & Ram, S. (2004).
Design Science in Information Systems Research. MIS
Quarterly, 28(1): 75-105. https://doi.org/10.2307/251
48625
Perceived Value of IS Collaboration Support in an SME Ecosystem’s Innovation Activity
265

Hjalager, A. M. (2010). A review of innovation research in
tourism. Tourism Management, 31(1), 1-12.
https://doi.org/10.1016/j.tourman.2009.08.012
Holbrook, M. B. (1999). Consumer Value : A Framework
for Analysis and Research. Taylor & Francis Group.
Kazadi, K., Lievens, A. & Mahr, D. (2016). Stakeholder co-
creation during the innovation process: Identifying
capabilities for knowledge creation among multiple
stakeholders. Journal of Business Research, 69(2),
525-540. https://doi.org/10.1016/j.jbusres.2015.05.009
King, B. M., Rosopa, P. J. & Minimum, E. W. (2011).
Statistical Reasoning in the Behavioral Sciences (6th
ed.). John Wiley & Sons.
Kuckartz, U. & Rädiker, S. (2020). Fokussierte
Interviewanalyse Mit MAXQDA. Springer.
Laudon, K. C. & Laudon, J. P. (1988). Management
Information Systems. Macmillan.
Lehner, F., Wildner, S., & Scholz, M. (2008).
Wirtschaftsinformatik: eine Einführung. Hanser
Verlag.
Lepak, D. P., Smith, K. G. & Taylor, M. S. (2007). Value
creation and value capture: A multilevel perspective.
Academy of Management Review, 32(1), 180-194.
https://doi.org/10.5465/AMR.2007.23464011
Lusch, R. F. & Nambisan, S. (2015). Service innovation: A
service-dominant logic perspective. MIS Quarterly:
Management Information Systems, 39(1), 155-175.
https://doi.org/10.25300/MISQ/2015/39.1.07
Mahr, D., Lievens, A. and Blazevic, V. (2014). The value
of customer cocreated knowledge during the innovation
process. Journal of Product Innovation Management,
31(3), 599-615. https://doi.org/10.1111/jpim.12116
Marangunić, N., & Granić, A. (2015). Technology
acceptance model: a literature review from 1986 to
2013. Universal Access in the Information Society,
14(1), 81-95. https://doi.org/10.1007/s10209-014-
0348-1
Marschall E & Marquier B (n.d.) Wilcoxon Signed Rank
Test in SPSS. Sheffield Hallam University and
University of Sheffield.
Mayr, S., Erdfelder, E. & Buchner, A. (2017). G Power 3.1
manual. Tutorials in Quantitative Methods for
Psychology.
Moore, J. F. (1993). Predators and Prey: A new ecology of
Competition. Harvard Business Review, May-June, 75-
88.
Moretti, A. (2017). The Network Organization: A
Governance Perspective on Structure, Dynamics and
Performance. Palgrave Macmillan.
Nardelli, G. & Broumels, M. (2018). Managing innovation
processes thorugh value co-creation: A process case
from Business-to-Business service practice.
Interantional Journal of Innovation Management,
22(3), 1850030. https://doi.org/10.1142/S136391961
8500305
Perks, H., Gruber, T. & Edvardsson, B. (2012). Co-creation
in radical service innovation: A systematic analysis of
microlevel processes. Journal of Product Innovation
Management, 29(6), 935-951. https://doi.org/10.1111/
j.1540-5885.2012.00971.x
Prahalad, C. K. & Ramaswamy, V. (2003). The new
frontier of experience innovation. MIT Sloan
Management Review, 44(4), 12-18.
Provan, K. G. & Kenis, P. (2007). Modes of Network
Governance: Structure, Management, and
Effectiveness. Journal of Public Administration
Research and Theory, 18(2), 229-252.
https://doi.org/10.1093/jopart/mum015
Provan, K. G., Fish, A. & Sydow, J. (2007).
Interorganizational networks at the network nevel: A
review of the empirical literature on whole networks.
Journal of Management, 33(3): 479-516.
https://doi.org/10.1177/0149206307302554
Radziwon, A. & Bogers, M. (2018). Open innovation in
SMEs: Exploring inter-organizational relationships in
an ecosystem. Technological Forecasting and Social
Change, 146(May 2018), 573-587.
https://doi.org/10.1016/j.techfore.2018.04.021
Rasch, B., Friese, M., Hofmann, W. & Naumann, E. (2014).
Quantitative Methoden. Band 2 (4th ed.). Springer.
Reypens, C., Lievens, A. & Blazevic, V. (2016).
Leveraging value in multi-stakeholder innovation
networks: A process framework for value co-creation
and capture. Industrial Marketing Management,
2016(56), 40-50. https://doi.org/10.1016/
j.indmarman.2016.03.005
Rivière, A. & Mencarelli, R. (2012) Towards a Theoretical
Clarification of Perceived Value in Marketing.
Recherche et Applications en Marketing (English
Edition), 27(3), 97-122. https://doi.org/10.1177/
205157071202700305
Rodden, T. (1991). A survey of CSCW systems. Interacting
with Computers, 3(3), 319-353.
https://doi.org/10.1016/0953-5438(91)90020-3
Rosenthal, R. (1994). Parametric Measures of Effect Size.
In H. Cooper & L. V. Hedges LV (Eds.), The Handbook
of Research Synthesis (pp. 231–244). Russell Sage
Foundation.
Rubalcaba, L., Michel, S., Sundbo, J., Brown, S. W. &
Reysono, J. (2012). Shaping, organizing, and rethinking
service innovation: A multidimensional framework.
Journal of Service Management, 23(5), 696-715.
https://doi.org/10.1108/09564231211269847
Saunders, M., Lewis, P. & Thornhill, A. (2009). Research
Methods for Business Students (9th ed.). Pearson
Education.
Schulz, S. (2019). Grundlagen der medizinischen Statistik
für Gesundheitsberufe. In R. Haring (Ed.)
Gesundheitswissenschaften (pp. 61–75). Springer.
Scuotto, V., Santoro, G., Bresciani, S & Del Giudice, M.
(2017). Shifting intra- and inter-organizational
innovation processes towards digital business: An
empirical analysis of SMEs. Creativity and Innovation
Management,
26(3), 247-255. https://doi.org/10.1111/
caim.12221
Siegel, S. (1956). Nonparametric Statistics for the
Behavioral Sciences. McGraw-Hill.
Sinaiko, H. W. & Brislin, R. W. (1973). Evaluating
language translations: Experiments on three assessment
ICEIS 2022 - 24th International Conference on Enterprise Information Systems
266

methods. Journal of Applied Psychology, 57(3), 328-
334. https://doi.org/10.1037/h0034677
Sjödin, D., Parida, V., Kohtamäki, M. & Wincent, J. (2020).
An agile co-creation process for digital servitization: A
micro-service innovation approach. Journal of Business
Research, 112(June 2019), 478-491.
https://doi.org/10.1016/j.jbusres.2020.01.009
Stiefl, J. (2018) Wirtschaftsstatistik (3rd ed.). De Gruyter.
Sweeney, J. C. & Soutar, G. N. (2001). Consumer perceived
value: The development of a multiple item scale.
Journal of Retailing, 77(2): 203-220.
https://doi.org/10.1016/S0022-4359(01)00041-0
Sydow, J. (2003). Editorial – Über Netzwerke,
Allianzsysteme, Verbünde, Kooperationen und
Konstellationen. In J. Sydow (Ed.), Management von
Netzwerkorganisationen (pp. 1-6). Gabler Verlag.
Sydow, J. & Müller-Seitz, G. (2020). Open innovation at
the interorganizational network level – Stretching
practices to face technological discontinuities in the
semiconductor industry. Technological Forecasting
and Social Change, 155(June 2020), 119398.
https://doi.org/10.1016/j.techfore.2018.07.036
Tidd, J. & Bessant, J. (2018). Innovation Management
Challenges : From fads to fundamentals. International
Journal of Innovation Management, 22(5), 1840007.
https://doi.org/10.1142/s1363919618400078
Tomczak, M. & Tomczak, E. (2014). The need to report
effect size estimates revisited. An overview of some
recommended measures of effect size. Trends in Sport
Sciences, 1(21), 19–25.
Vargo, S. L. & Lusch, R. F. (2004). Evolving to a New
Dominant Logic for Marketing. Journal of Marketing,
68(January), 1–17, https://doi.org/10.1509/jmkg.68.1.
1.24036
Vargo, S. L. & Lusch, R. F. (2016). Institutions and axioms:
an extension and update of service-dominant logic.
Journal of the Academy of Marketing Science, 44(1), 5-
23. https://doi.org/10.1007/s11747-015-0456-3
Venkatesh, V. & Bala, H. (2008). Technology Acceptance
Model 3 and a Research Agenda on Interventions.
Decision Sciences, 39(2), 273-315.
https://doi.org/10.1111/j.1540-5915.2008.00192.x
West, J. & Bogers, M. (2014). Leveraging external sources
of innovation: A review of research on open innovation.
Journal of Product Innovation Management, 31(4),
814-831. https://doi.org/10.1111/jpim.12125
West, J. & Bogers, M. (2017). Open innovation: current
status and research opportunities. Innovation:
Management, Policy and Practice, 19(1), 43-50.
https://doi.org/10.1080/14479338.2016.1258995
Westergren, U. H. (2011). Opening up innovation: The
impact of contextual factors on the co-creation of IT-
enabled value adding services within the manufacturing
industry. Information Systems and e-Business
Management, 9(2), 223-245. https://doi.org/
10.1007/s10257-010-0144-2
Wilcoxon, F. (1946). Individual comparisons of grouped
data by ranking methods. Journal of economic
entomology, 39(6), 269. https://doi.org/10.1093/
jee/39.2.269
Yin, R. K. (2006) Case Study Research - Design and
Methods. SAGE Publications.
Perceived Value of IS Collaboration Support in an SME Ecosystem’s Innovation Activity
267
