
An Application of the Analytic Hierarchy Process to the Evaluation of
Companies’ Data Maturity
Simone Malacaria
1a
, Andrea De Mauro
1b
, Marco Greco
2c
and Michele Grimaldi
2d
1
Department of Enterprise Engineering, University of Rome “Tor Vergata”, Rome, Italy
2
Department of Civil and Mechanical Engineering, University of Cassino and Southern Lazio, Cassino, Italy
Keywords Big Data, Data Analytics, Analytic Hierarchy Process, Assessment System.
Abstract: The study reports the data maturity evaluation on a sample of Italian firms of different sectors and sizes,
retrieved through an online assessment made by 261 professionals and entrepreneurs operating in the data
domain. The paper's objective is to derive the relative importance of the critical factors to impact successful
big data initiatives, according to organization reality and manager perspective. The questionnaire was
distributed among IT professionals and decision-makers in Italy using the LinkedIn platform. The assessment
was divided into two sections: the 1st one contained the assessment of 8 critical success factors for big data,
whereas the 2nd section assessed weights based on an application of the analytic hierarchy process. The result
of this process is a scoring system that includes the characteristics a company "must-have" to become data-
oriented and make data-driven decisions. The application of the weights allows giving more importance to
the domains that managers think are more important in a data-driven company. Respondents agreed to the
importance of integrated architecture, data-friendly corporate culture, and integrated organization domains.
Once the results consider the weights from the AHP, data friendliness becomes the most sought-after
characteristic. The findings provide direction for further development of the assessment system.
1 INTRODUCTION
Data science is the set of statistical techniques and
methods necessary for the extraction, analysis, and
interpretation of data. In the era of "Big Data" where
a huge amount of information is available to
companies, data-driven choices are essential for
defining a company's medium and long-term strategy
and can turn into a huge competitive advantage
success (Grover et al., 2018; Kubina et al., 2015). The
major internet and manufacturing companies like
Google, Facebook, and Apple hire the best data
science talents to work in their vast data science
departments. Being a successful company today
means making data-driven decisions (Ghasemaghaei,
2019; Wamba et al., 2017). Companies that have
overlooked the potential of data science have
observed their competitors seize market share and
enlarge their customer base over the past years.
Pioneers like Facebook, Amazon, and Google instead
a
https://orcid.org/0000-0003-0736-3464
b
https://orcid.org/0000-0001-9050-5018
c
https://orcid.org/0000-0002-6935-7775
d
https://orcid.org/0000-0002-5837-0616
developed dominant market positions. Nowadays,
basically, companies of all sizes are investing heavily
in data and AI initiatives to narrow the gap with the
tech giants(Davenport & Bean, 2019). Although the
value that data analytics brings to companies has been
recognized (Grover et al., 2018; Günther et al., 2017;
Mikalef et al., 2019), there is still confusion on how
to properly integrate big data initiatives within the
organization for long-term planning (McShea et al.,
2016; White, 2019). This is today the main reason for
the actual failures of more than half of big data
programs worldwide. Being a data mature
organization means being able to spot new data-
driven opportunities in advance while they are still
invisible to the competitors, using analytic insights to
deliver business outcomes.
In this study, we analyze the data maturity of a
representative sample of Italian companies of
different sectors and sizes. To score what the ripeness
level of the enterprises is, we relied on an eight-
50
Malacaria, S., De Mauro, A., Greco, M. and Grimaldi, M.
An Application of the Analytic Hierarchy Process to the Evaluation of Companies’ Data Maturity.
DOI: 10.5220/0011088000003179
In Proceedings of the 24th International Conference on Enterprise Information Systems (ICEIS 2022) - Volume 1, pages 50-61
ISBN: 978-989-758-569-2; ISSN: 2184-4992
Copyright
c
2022 by SCITEPRESS – Science and Technology Publications, Lda. All rights reserved

dimensional assessment system derived from the
literature (De Mauro et al., 2021) - the CBDAS -
consensual with the existing big data maturity
models. The CBDAS applies the analytic hierarchy
process to assign weights to the critical success
factors for big data initiatives. We analyze how
respondents (Senior Manager and IT Decision-
makers) agreed or disagreed with questions that
underlined the importance of each success factor
proposed. As a result, the paper derives insights on
the importance that the managers give on data-driven
choices and on the validity of the CBDAS to apply to
companies of different sizes and industry sectors.
2 BIG DATA MATURITY
MODELS
In the digital era, data analytics becomes a central
point of achieving corporate objectives (Khanra et al.,
2020). The ability of a company to take advantage of
the usage of big data (degree of corporate data
maturity) determines the degree of success or failure
of a data-driven initiative (Constantiou & Kallinikos,
2015; Santos-Neto & Costa, 2019; Sharma et al.,
2014).
The big data maturity models represent robust
frameworks that support the evaluation of old and
new big data initiatives among specific aspects or
domains to rule whether they can generate new
knowledge for a company (Grover et al., 2018;
Olszak & Mach-Król, 2018; Santos-Neto & Costa,
2019; van Hillegersberg J., 2019).
By leveraging a maturity model, data maturity can
be evaluated at the sub-domain level when it refers to
micro-level factors such as routines and
organizational requirements, at the domain level
when it refers to the macro-level factors to assess the
needed conditions to reach maturity stages. While
macrolevels generally assess strategic factors of big
data initiatives' success, microlevels make clear the
actions to be taken to guide maturity within
organizations (Comuzzi & Patel, 2016; Halper &
Krishnan, 2014; Nott, C. and Betteridge, 2014).
The aspects investigated through the maturity
models can be many, such as IT management,
business intelligence ecosystem, and data warehouse
adoption, among others. In general, big data maturity
models give the company the maximum value when
used to analyze how business processes and strategies
integrate with big data initiatives, providing
management with the needed information to support
strategic and operational decisions (Al-Sai et al.,
2019).
Data models help to outline the optimal choices
for a path of improvement of the business
management system. The absence of specific
procedures regarding the assessment and operation of
maturity models may represent a limitation for the use
of the model as an organizational and diagnostic-
prescriptive management system.
So far, only a few of the big data maturity models
present in the literature contain details on the
development, validation, and evaluation processes of
the model itself, constituting a limit to the validity and
usefulness of many proposals (Pöppelbuß &
Röglinger, 2011; Santos-Neto & Costa, 2019).
We rely on the Consensual Big Data Assessment
System (CBDAS) proposal (De Mauro et al., 2021),
which starts from a holistic and conceptual
integration of existing models. It encompasses the
key elements of success that are coherent with big
data's essential components and consensual with the
most prominent existing models. The CBDAS offers
a robust conceptual model complemented by a
practical assessment and recommendation system to
grant usefulness and applicability for industries.
3 METHODOLOGY
3.1 Sample Collection
In this work, we submitted a Likert-scale (1-strongly
disagree to 5-strongly agree) questionnaire to 261
Italian companies' employees, where the participants
were asked to answer questions that measure a
company data maturity. The participants were mostly
company managers and IT experts. We used the
LinkedIn platform to draw a representative sample of
professionals worldwide to conduct the online
assessment. Although the LinkedIn community is not
encompassing the population of industry
representatives exhaustively, it might be considered
suitable for targeting professionals in scope. The
process of sample selection leverage publicly
available information about the respondents provided
by LinkedIn users, which increases the credibility of
the sample and permits control over its composition.
The inclusion criteria were related to (a) the
seniority of the respondents (Senior Managers and
Directors), (b) the position covered in their
organization (IT Director, IT Responsible, IT
Specialist, Senior Data Specialist, Senior Data
Scientist, Senior Business Analyst, IT Consultant),
(c) their confirmed experiences and skills in the area
An Application of the Analytic Hierarchy Process to the Evaluation of Companies’ Data Maturity
51

of Data Analytics, Big Data, and IT Management.
With the inclusion criteria identified, we had a
potential audience of more than 320.000 unique
respondents, targeted with LinkedIn campaigns
launched from October to December 2021. Exclusion
criteria have been applied to filter (a) uncomplete
assessments and (b) companies operating outside
Italy since the study focus on the Italian territory.
3.2 Assessment Structure
The CBDAS assessment was structured in two parts:
the first part is composed of 40 questions divided into
8 domains and allows the evaluation of data maturity
on critical success factors for big data initiatives; the
second part is made of 15 questions that focus on the
pairwise comparison of data maturity characteristics
of the company, which represent a multifactorial
combination of the 8 critical success factors.
Table 1: Assessment submitted to the participants.
Domain Questions
DATA STRATEGY
1
)
The com
p
an
y
has a solid data anal
y
sis strate
gy
.
2
)
The com
p
an
y
uses data anal
y
sis to make strate
g
ic decisions.
3
)
Data anal
y
sis is not an im
p
ortant
p
art of the com
p
an
y
's transformation strate
gy
.
4) The Corporate Data Strategy has been documented, approved, and communicated by Top
Mana
g
ement to the entire or
g
anization.
5
)
Leadershi
p
p
romotes the use of data anal
y
tics throu
g
hout the com
p
an
y
.
6) There is a list of key analytical projects or analysis priorities whose progress is regularly
tracked.
7) The legal procedures on data usage and management are documented and communicated to
the entire or
g
anization.
8
)
There are re
g
ular audit
p
rocesses on data usa
g
e and mana
g
ement within the or
g
anization
DATA-PROCESS
INTEGRATION
9) Business processes are guided by numerical evidence, which directly impacts the way the
com
p
an
y
o
p
erates.
10) The Key Performance Indicators related to data processes are stored and could be
anal
y
zed in real-time.
11) The organization uses automated analyses (e.g., systems that suggest in-depth analysis or
build models, alert systems based on control levels, reports that automated data processing
and output delivery).
12) Your company has organizations (internal or external) that focus on data engineering,
software development, data quality to ensure proper support to analytical processes.
13) Managers and process owners know what data are available in the company to support
their business decisions.
TECH
INFRASTRUCTURE
14) The data infrastructure is adequate to the size of the organization, and the organization is
using the following types of data management technology where needed: Cloud Systems, Big
Data Architectures.
15) The organization is able to monitor more data pipelines. Therefore, the organization is
able to manage multiple analytical projects in parallel.
16) The organization has designed its data architecture to integrate multiple sources and
facilitate data access and anal
y
sis.
17) The computational power and the size of the available memory are adapted to the current
information in
j
ections.
18
)
S
y
stems com
p
l
y
with hi
g
h-securit
y
standards and are sub
j
ect to
p
eriodic intrusion tests.
19) How many of the following technologies use your organization to analyze your data?
(Spreadsheets, reports, dashboard, predictive analysis/machine learning, deep learning, and
other aspects of the AI).
20) Only a few managers in the company have access to the analysis results.
INTEGRATED
ARCHITECTURE
21) The organization collects and manages structured (i.e., sales data in tabular format) and
unstructured
(
i.e., Video and Audio
)
data t
yp
es for its anal
y
sis activities.
22) Employees can access data as needed, including structured and unstructured data, through
a well-defined
g
overnance
p
rocess.
23
)
The data formats are standardized and documented.
24
)
There is a sin
g
le data model to which all the business units refer.
ICEIS 2022 - 24th International Conference on Enterprise Information Systems
52

Table 1: Assessment submitted to the participants (cont.).
Domain Questions
DATA
INTERFACE
25) Analysis solutions are designed to provide the best user interface to the right person (for
example, corporate analysts, business users, data scientists, data engineers, et al.).
26) Employees do not receive guides on how to access the data.
27) It is easy to get data in a format not covered by existing interfaces; the technical support
needed is minimal, and the request is standardized.
28) Corporate data are accessible through a business intelligence interface that allows users to
combine different data sources, create graphs and tables with a high degree of customization,
and allows users to share the most interestin
g
views with other stakeholders.
29) Data Scientists and Business Analysts are able to connect any application developed with
the latest data available at the needed level of detail.
ANALYTICAL
SKILLS
30) The knowledge of data science techniques is widespread in the organization, even outside
the business units dedicated to data anal
y
sis.
31) The analysts use tested and documented tools and methodologies to respond to the business
q
uestions of the or
g
anization, which re
q
uires anal
y
tical su
pp
ort.
32
)
There is a career model for Business Anal
y
sts and Data Scientists.
33
)
The com
p
an
y
has a clear recruitment strate
gy
for data
p
rofessionals.
34) There is a broad and modular program for analytical skills development open to all
em
p
lo
y
ees and modulated accordin
g
to career as
p
irations and
p
ersonal interests.
35
)
The or
g
anization invests in the trainin
g
of data anal
y
sts.
INTEGRATED
ORGANISATION
36) Business Analysts and Data Scientists operate in an integrated manner with the rest of the
organization.
37) Analysts are in contact with corporate opportunities and challenges; they can directly
impact decisions and influence the corporate strategy.
38) Analysts' priorities are defined according to urgencies and are not linked to the company's
opportunities.
DATA FRIENDLY
APPROACH
39) The entire organization is pervaded by widespread knowledge and live interest in data, and
the role of analytics is recognized in guiding the company to success.
40) Top Managers are consistently leveraging the recommendations generated by data and
algorithms.
We leveraged the Analytic Hierarchy Process
(AHP) (Thomas L. Saaty, 1990) to obtain appropriate
weights for the questionnaire answers. The result of
this process is a scoring system that evaluates the data
maturity of a company and includes the principal
characteristics that a company must have to become
data-oriented and make data-driven strategic
decisions. Moreover, this assessment gives more
importance to the domains that managers think are
more important in a data-driven company.
3.3 The Analytic Hierarchy Process
The AHP process is a quantitative method for making
decisions based on the relative importance that people
arbitrarily assign to certain factors. This process
requires answering pairwise comparison questions
structured in the following way:
(A) is X times more important than (B)
Or
(A) is as important as (B)
Or
(B) is X times more important than A
Weights for the single criteria are then computed in
the following way.
𝑉
𝑥
∗𝑥
∗𝑥
Which is the criterion 1 geometric mean. Then each
geometric criterion mean is divided by the sum of all
criteria:
𝑊
𝑉
𝑉
𝑉
𝑉
The 15 questions in the second section of the CBDAS
require the respondent to choose between a pairwise
comparison of data maturity characteristics and how
much it counts on a specific aspect versus one other
to improve big data management, according to the
organization's reality.
In our specific case, the AHP process was used to
evaluate the following company characteristics,
derived from the conceptual CBDAS:
An Application of the Analytic Hierarchy Process to the Evaluation of Companies’ Data Maturity
53
1. The proliferation of a data culture across the
entire organization.
2. Availability of IT services.
3. Managers' support in data-driven projects.
4. Care of analytical talents within the company.
5. Satisfaction of technological needs.
6. Business sponsorship to facilitate data-driven
decision-making.
The respondents were allowed to rank one of the
options from equally important to 3 times more
important, according to the respondent's perspective
on its organization reality. It is crucial to figure out
that not all the domains could always be relevant to a
particular context (Walls & Barnard, 2019). For the
same reason, certain factors may be more important
than others in specific sectors. To respond and collect
all those situations, we included the respondents'
possibility to assign different weights to each
organizational need in this section of the assessment.
The resulting AHP matrix is shown in Table 2.
Table 2: AHP Matrix results based on the interview of 261 Italian managers and entrepreneurs.
Proliferation of
a data culture
across the
entire
organization
Availability
of IT
services
Managers'
support in
data-driven
projects
Care of
analytical
talents
within the
company
Satisfaction
of
technological
needs
Business
sponsorship
to facilitate
data-driven
decision
makin
g
Proliferation of a data
culture across the
entire or
g
anization
1.0000 1.6061 0.9394 1.0000 1.6902 0.5926
Availability of IT
services
0.6226 1.0000 0.5000 0.5000 1.2677 0.5505
Managers' support in
data-driven projects
1.0645 2.0000 1.0000 0.8451 0.8923 0.8165
Care of analytical
talents within the
compan
y
1.0000 2.0000 1.1833 1.0000 0.9646 0.6246
Satisfaction of
technological needs
0.5916 0.7888 1.1208 1.0366 1.0000 0.6768
Business sponsorship
to facilitate data-
driven decision
makin
g
1.6875 1.8165 1.2247 1.6011 1.4776 1.0000
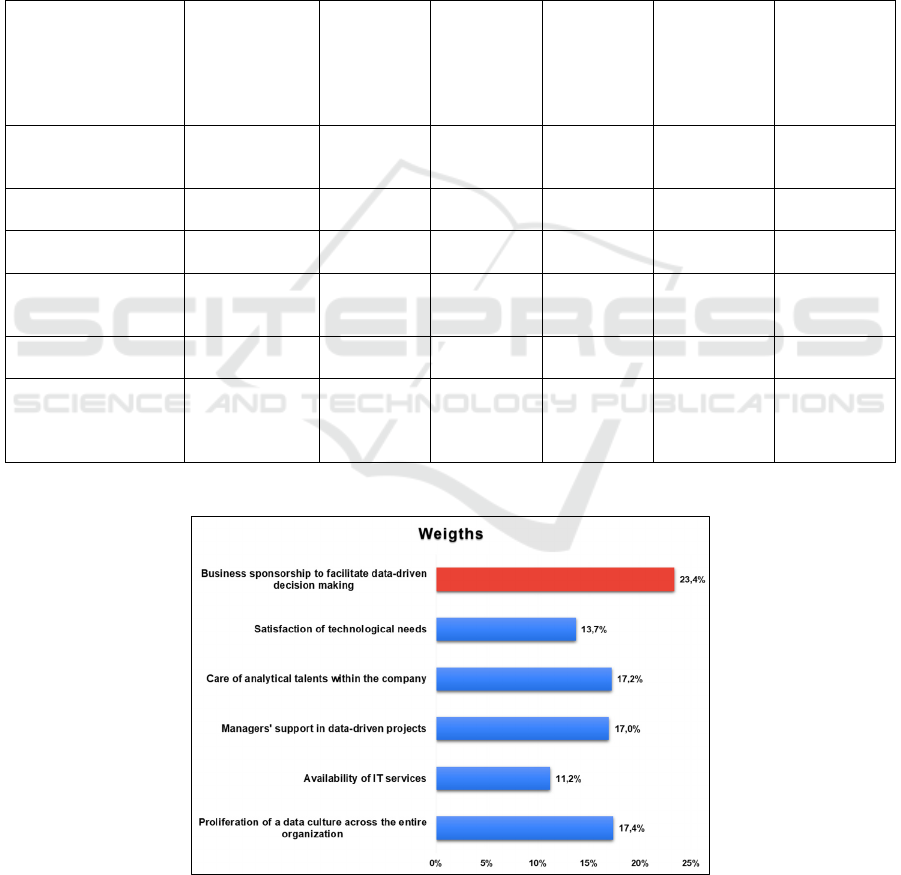
The associated weights are depicted in Figure 1:
Figure 1: AHP weights for each of the dimensions chosen in this study. According to more than 261 managers interviewed,
the key factors for a company's data maturity are that the business facilitates data-driven decisions and the proliferation of
data culture across the entire organization.
ICEIS 2022 - 24th International Conference on Enterprise Information Systems
54
4 ASSESSMENT RESULTS
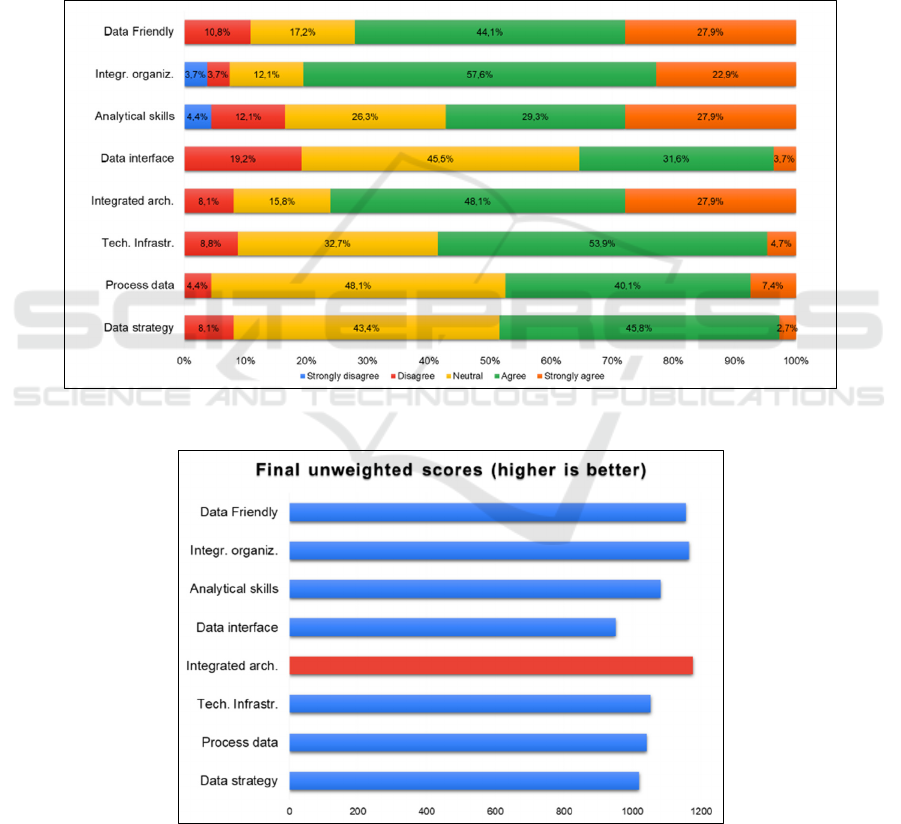
The questionnaire results are synthesized in Figure 2,
where the respondent proportion for each question is
represented as vertical bars of distinct colours. As
shown in the bar chart, more than half of the
respondents agreed or strongly agreed to the
importance of "Integrated architecture", "Data
Friendly" and "Integrated organization" domains.
This can also be seen in Figure 3, where the
unweighted score shows how the domain in which the
interviewed agreed more are the same mentioned
before. The situation changes dramatically if one
considers not only how strongly each person agreed
to a certain question but, most importantly, how much
importance relative to the other domains each person
would give (i.e., by applying the AHP weights to the
unweighted scores). This can be seen in Figure 4.
In Figure 4, one can see that once one considers
the weights from the AHP, data friendliness in the
organization becomes the most sought-after
characteristic. Followed by "Integrated Organization"
and "Analytical Skills."
Figure 2: Relative percentage of answers for each domain.
Figure 3: Unweighted final scores. This graph compares the sum of the Likert scores given by each of the 261 people
interviewed.
An Application of the Analytic Hierarchy Process to the Evaluation of Companies’ Data Maturity
55
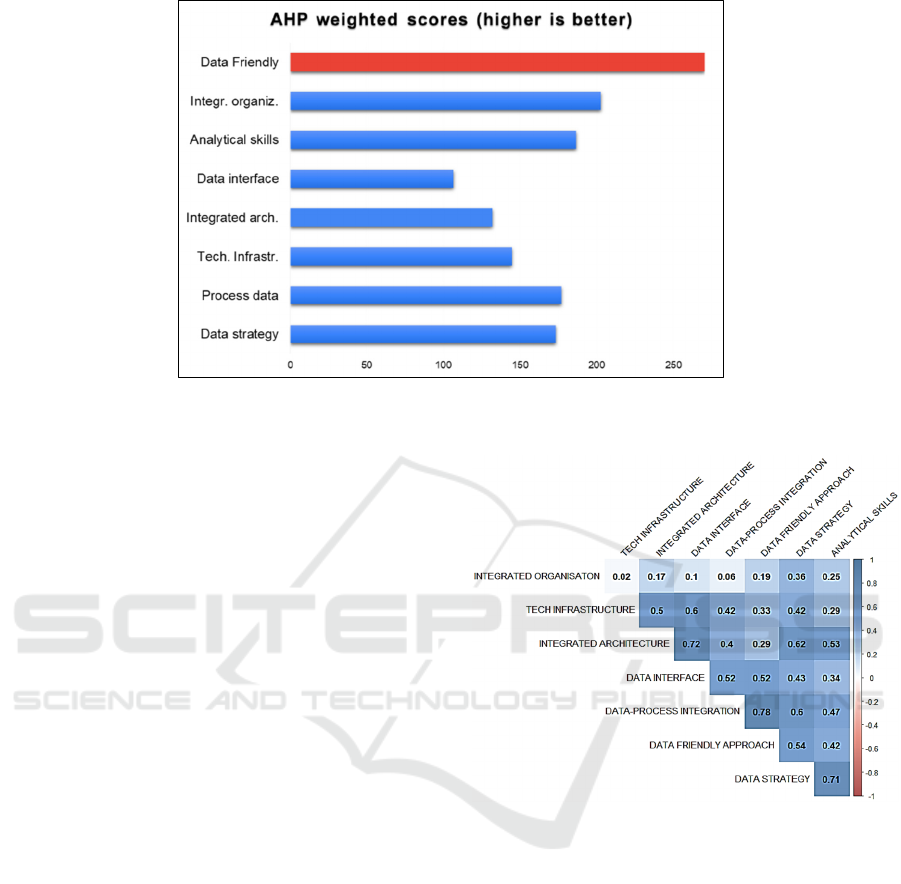
Figure 4: Final scores weighted using the AHP process. The results now look quite different since the domain "data-friendly"
was considered the most important (higher weights) in the AHP process.
4.1 Correlation among Parameters
As one may expect, there may be correlations among
domains due to their nature or to the similarity of
questions. To investigate that, we calculated a
correlation coefficient between every domain listed in
Table 1. To do that, we used a Spearman correlation
coefficient (Spearman rank correlation) (Spearman,
1904) that has the advantage of not being limited to
continuous numerical variables but can also be
applied to discrete ordinal variables. Moreover, this
method of calculation can spot strictly non-linear
correlations and can assess how much two variables
are correlated by a monotonic function (Zar, 1972).
For linear relationships, the two methods give similar
answers. The value of Spearman's R is always
between -1 (indicating a perfect negative correlation)
and +1 (indicating a perfect positive correlation).
Weak correlations have R values 0
|
𝑅
|
0.2,
moderate correlations 0.2
|
𝑅
|
0.6 and strong
correlations 0.6
|
𝑅
|
1 We have created a
correlation Matrix using the software R 4.1.2 and the
command rcorr. The results are shown below in
Figure 5.
It was to be expected that only positive
correlations had to be found since all questions in the
Likert scale go in the same direction. The strongest
correlations happen to be between data process
integration and data-friendly approach, where a
R=0.78 indicates a strong correlation. It also appears
a strong correlation between the domain integrated
architecture and data interface with a Spearman's
R=0.72.
Figure 5: Spearman correlation matrix among domains
scores.
4.2 Stratification By Company Sector
and Size
A series of demographic questions were asked to the
participants when the assessment was submitted to
them. We collected information about the
characteristics of the company to which they
belonged. The questions were focused on the
company size and the sector in which it operates. This
allowed us to stratify for such parameters and search
for statistically significant differences.
The results of this stratification are shown in
Figure 6 and Figure 7.
ICEIS 2022 - 24th International Conference on Enterprise Information Systems
56
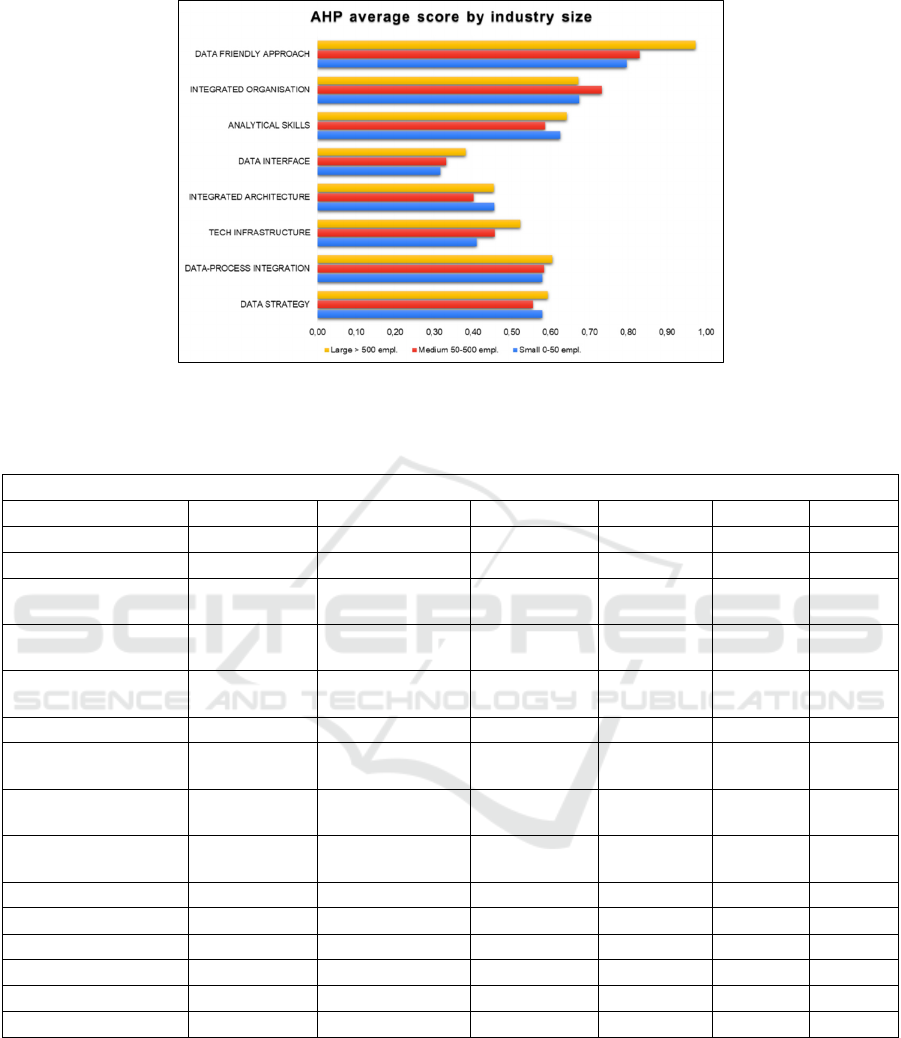
Figure 6: AHP-weighted average score by industry size. The results look very similar among different company sizes.
Table 3: ANOVA output. The p-value << 0.05 indicates that we can reject with a high degree of confidence the hypothesis
that the average scores of companies by DOMAIN are the same.
ANOVA
SUMMARY
Groups Count Sum Average Variance
DATA STRATEGY 3 1.726453388 0.575484463 0.000372
DATA-PROCESS
INTEGRATION
3 1.767461022 0.589153674 0.000201
TECH
INFRASTRUCTURE
3 1.389559865 0.463186622 0.003198
INTEGRATED
ARCHITECTURE
3 1.310043357 0.436681119 0.000883
DATA INTERFACE 3 1.030418065 0.343472688 0.001125
ANALYTICAL
SKILLS
3 1.852298318 0.617432773 0.000828
INTEGRATED
ORGANISATION
3 2.077575264 0.692525088 0.001193
DATA FRIENDLY
APPROACH
3 2.597837495 0.865945832 0.008814
ANOVA
Source of Variation SS df MS F P-value F crit
Between Groups 0.557008477 7 0.07957264 38.31854 7.88E-09 2.657197
Within Groups 0.033225746 16 0.002076609
Total 0.590234223 23
The stratification by company size shows that the
only domain where there could verify differences
among the different-sized company is the data-
friendly approach. However, such differences have to
be ascertained by means of appropriate statistical
tools. We performed an ANOVA (ANalysis Of
VAriance) test (Fisher, 1946) to search for statistical
differences among groups. ANOVA tests the null
hypothesis that the averages of the groups belong to
the same distribution by testing the variance between
and within groups. We first tested for significant
differences among domains, the results of which are
shown in Table 3.
Since the p-value is p << 0.05, we can reject the
hypothesis that the different domains have equal
means (i.e., there are significant differences).
An Application of the Analytic Hierarchy Process to the Evaluation of Companies’ Data Maturity
57
Regarding the scores of companies of different sizes,
the results were opposite and are summarized in table
4.
Since the p-value >> 0.05, we observe no
statistically significant differences among different
company sizes in this case. This can be interpreted as
companies of varied sizes having the same data-
maturity aspirations and ambitions. The stratification
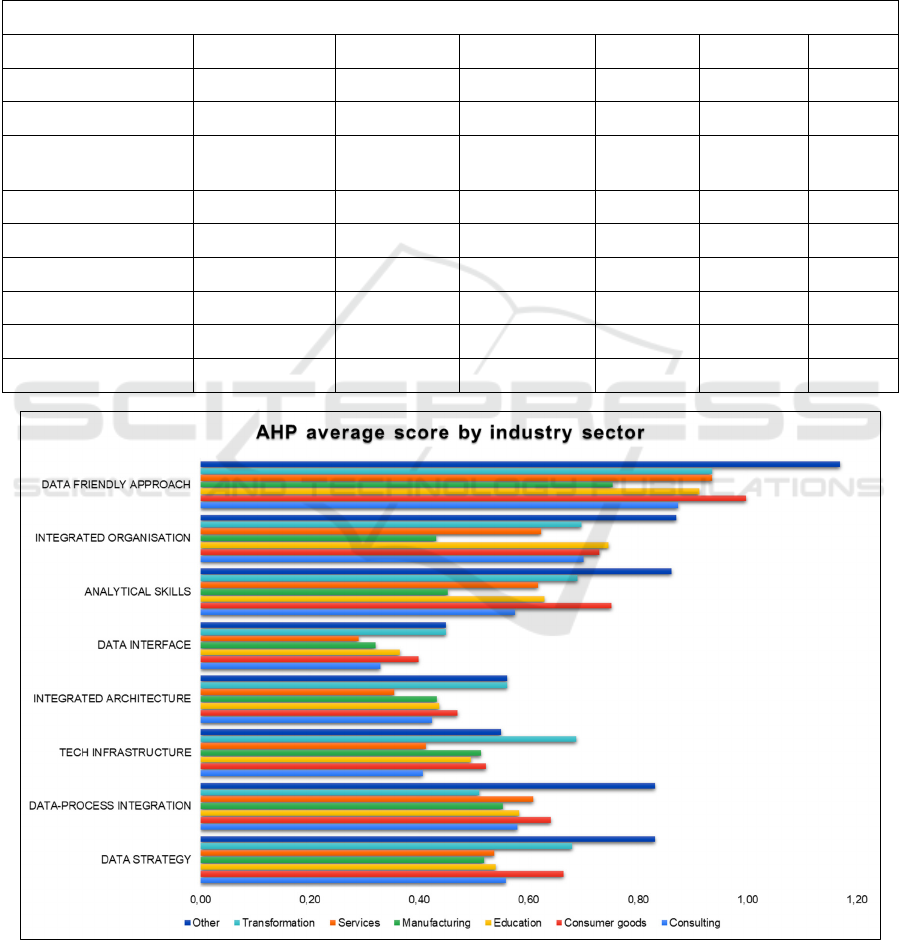
for the company sector also shows similar results.
Figure 7 and Table 5 show no statistically significant
differences in data needs and maturity scores among
companies operating in different sectors.
Table 4: ANOVA output. The p-value >> 0.05 indicates that we cannot reject the null hypothesis that the average AHP-
weighted scores of companies by SIZE are the same.
ANOVA (company size)
SUMMARY
Groups Count Sum Average Variance
Small 0-50 employees 8 4.433638116 0.554204765 0.023713
Medium 50-500
employees
8 4.47730905 0.559663631 0.027267
Large > 500 employees 8 4.840699608 0.605087451 0.031556
ANOVA
Source of Variation SS df MS F P-value F crit
Between Groups 0.012485788 2 0.006242894 0.226917 0.798916 3.4668
Within Groups 0.577748435 21 0.02751183
Total 0.590234223 23
Figure 7: AHP-weighted average score by industry sector. The results look similar among different company sizes.
Table 5: ANOVA output. The p-value > 0.05 indicates that we cannot reject the null hypothesis that the average AHP-
weighted scores of company sector are the same.
ICEIS 2022 - 24th International Conference on Enterprise Information Systems
58

ANOVA (company sector)
SUMMARY
Groups Count Sum Average Variance
Consulting 8 4.445729 0.555716 0.030538
Consumer goods 8 5.172092 0.646512 0.035667
Education 8 4.705451 0.588181 0.030794
Manufacturing 8 3.972509 0.496564 0.015973
Services 8 4.37681 0.547101 0.040978
Transformation 8 5.208651 0.651081 0.022189
Other 8 6.123635 0.765454 0.054318
ANOVA
Source of Variation SS df MS F P-value F crit
Between Groups 0.379039697 6 0.063173 1.918852 0.096414 2.290432
Within Groups 1.613199204 49 0.032922
Total 1.992238901 55
5 DISCUSSIONS AND
CONCLUSIONS
We have created an AHP based evaluation system for
estimating companies' data maturity and the
importance that their managers assign to data-driven
choices. Our results suggest that the data-maturity
estimator that is considered as most important by the
interviewed managers was "Data friendliness",
followed by "Integrated Organization" and
"Analytical Skills". Moreover, we have found
evidence that the relevance of the 8 critical success
factors included in CBDAS is statistically
independent of the size of the company and the sector
in which it is operating, making the assessment of
general applicability for a broad range of business
organizations. Our findings suggest that, when
companies look for new opportunities to use
analytics, the presence of data-driven culture is of
primary importance for making data initiatives able to
generate business value (McAfee & Brynjolfsson,
2012; Vidgen et al., 2017). We believe that managers'
support rule should be promoting a broad sense of
data ownership by all employees and a solid
connection between data professionals and business
functions (Bahjat et al., 2014; Comuzzi & Patel,
2016). This enables data experts to directly impact
business decisions and influence business strategy.
By having top managers seeking advice from data
analysts, organizations recognize and accept the
central role of data in decision-making, business
transformation, and innovation. Our research also
highlighted how the characteristics identified by
managers as relevant (i.e., corporate culture) do not
correspond linearly to those with a higher degree of
maturity. This mismatch between managers'
perceptions and the implementation of concrete
actions suggests the usefulness of a system of
recommendations for bridging the existing maturity
gap in higher priority areas.
The current study is affected by some known
limitations that provide opportunities for future
research. Firstly, the limited sample size requires the
assessment to be tested with a broader audience
involving a larger number of enterprises respondents
to confirm preliminary insights obtained from the
current analysis. Secondly, the scope of the
interviewed audience was limited to Italy, causing its
findings to be prone to specific local dynamics.
Thirdly, more robust qualitative research is needed to
assess the sufficiency of the critical success factors
included in the assessment model that was used in this
study. A future direction of the study would be to
create a specific model for different company
contexts capable of thoroughly evaluating how every
aspect of data management change according to the
complexity of the organizational network (Daryani &
Amini, 2016; Gökalp et al., 2021). This will allow
increasing the practical applicability of the rule-based
recommendations, obtaining specific indications to
An Application of the Analytic Hierarchy Process to the Evaluation of Companies’ Data Maturity
59

be implemented in the process of improving business
choices.
REFERENCES
Al-Sai, Z. A., Abdullah, R., & Husin, M. H. (2019). A
review on big data maturity models. 2019 IEEE Jordan
International Joint Conference on Electrical
Engineering and Information Technology, JEEIT 2019
- Proceedings, 156–161. https://doi.org/10.1109/
JEEIT.2019.8717398
Bahjat, E.-D., Koch, V., Meer, D., Shehadi, R. T. ù, &
Tohme, W. (2014). Big Data Maturity: An Action Plan
for Policymakers and Executives. Weforum, 369 p.
http://reports.weforum.org/global-information-
technology-report-2014/
Comuzzi, M., & Patel, A. (2016). How organisations
leverage: Big Data: A maturity model. Industrial
Management and Data Systems, 116(8), 1468–1492.
https://doi.org/10.1108/IMDS-12-2015-0495
Constantiou, I. D., & Kallinikos, J. (2015). New games,
new rules: Big data and the changing context of
strategy. Journal of Information Technology, 30(1), 44–
57. https://doi.org/10.1057/jit.2014.17
Daryani, S. M., & Amini, A. (2016). Management and
Organizational Complexity. Procedia - Social and
Behavioral Sciences, 230(May), 359–366.
https://doi.org/10.1016/j.sbspro.2016.09.045
Davenport, T. H., & Bean, R. (2019). How big data and AI
are accelerating business transformation. 1–16.
www.newvantage.com
De Mauro, A., Greco, M., Grimaldi, M., & Malacaria, S.
(2021). A consensual maturity assessment system.
Fisher, R. A. (1946). Statistical methods for research
workers. Oliver and Boyd.
Ghasemaghaei, M. (2019). Are firms ready to use big data
analytics to create value? The role of structural and
psychological readiness. Enterprise Information
Systems, 13(5), 650–674. https://doi.org/10.1080/
17517575.2019.1576228
Gökalp, M. O., Gökalp, E., Kayabay, K., Koçyiğit, A., &
Eren, P. E. (2021). Data-driven manufacturing: An
assessment model for data science maturity. Journal of
Manufacturing Systems, 60(March), 527–546.
https://doi.org/10.1016/j.jmsy.2021.07.011
Grover, V., Chiang, R. H. L., Liang, T.-P., & Zhang, D.
(2018). Creating Strategic Business Value from Big
Data Analytics: A Research Framework. Journal of
Management Information Systems, 35(2), 388–423.
https://doi.org/10.1080/07421222.2018.1451951
Günther, W. A., Rezazade Mehrizi, M. H., Huysman, M.,
& Feldberg, F. (2017). Debating big data: A literature
review on realizing value from big data. Journal of
Strategic Information Systems, 26(3), 191–209.
https://doi.org/10.1016/j.jsis.2017.07.003
Halper, F., & Krishnan, K. (2014). TDWI Big Data
Maturity Model Guide. http://www.pentaho.com/sites/
default/files/uploads/resources/tdwi_big_data_maturit
y_model_guide_2013.pdf
Khanra, S., Dhir, A., & Mäntymäki, M. (2020). Big data
analytics and enterprises: a bibliometric synthesis of the
literature.
Enterprise Information Systems, 14(6), 737–
768. https://doi.org/10.1080/17517575.2020.1734241
Kubina, M., Varmus, M., & Kubinova, I. (2015). Use of Big
Data for Competitive Advantage of Company.
Procedia Economics and Finance, 26(15), 561–565.
https://doi.org/10.1016/s2212-5671(15)00955-7
McAfee, A., & Brynjolfsson, E. (2012). Big data: the
management revolution. Harvard Business Review,
90(10), 61–67. https://doi.org/10.1007/s12599-013-
0249-5
McShea, C., Oakley, D., & Mazzei, C. (2016). The Reason
So Many Analytics Efforts Fall. Harvard Business
Review. https://hbr.org/2016/08/the-reason-so-many-
analytics-efforts-fall-short
Mikalef, P., Boura, M., Lekakos, G., & Krogstie, J. (2019).
Big data analytics and firm performance: Findings from
a mixed-method approach. Journal of Business
Research, 98(July 2018), 261–276.
https://doi.org/10.1016/j.jbusres.2019.01.044
Nott, C. and Betteridge, N. (2014). Big Data & Analytics
Maturity Model. https://www.ibm.com/developer
works/community/blogs/bigdataanalytics/entry/big_da
ta_analytics_maturity_model?lang=en
Olszak, C. M., & Mach-Król, M. (2018). A conceptual
framework for assessing an organization’s readiness to
adopt big data. Sustainability (Switzerland), 10(10).
https://doi.org/10.3390/su10103734
Pöppelbuß, J., & Röglinger, M. (2011). What makes a
useful maturity model? A framework of general design
principles for maturity models and its demonstration in
business process management. 19th European
Conference on Information Systems, ECIS 2011.
Santos-Neto, J. B. S. dos, & Costa, A. P. C. S. (2019).
Enterprise maturity models: a systematic literature
review. Enterprise Information Systems, 13(5), 719–
769. https://doi.org/10.1080/17517575.2019.1575986
Sharma, R., Mithas, S., & Kankanhalli, A. (2014).
Transforming decision-making processes: A research
agenda for understanding the impact of business
analytics on organisations. European Journal of
Information Systems, 23(4), 433–441.
https://doi.org/10.1057/ejis.2014.17
Spearman, C. (1904). The Proof and Measurement of
Association between Two Things Author ( s ): C .
Spearman Source : The American Journal of
Psychology , Vol . 15 , No . 1 ( Jan ., 1904 ), pp . 72-
101 Published by : University of Illinois Press Stable
URL : http://www.jstor.o. The American Journal of
Psychology, 15(1), 72–101.
Thomas L. Saaty. (1990). Multicriteria Decision Making:
The Analytic Hierarchy Process: Planning, Priority
Setting, Resource Allocation. RWS Pubns; 2nd edition.
van Hillegersberg J. (2019).
The Art of Structuring.
Springer, Cham.
Vidgen, R., Shaw, S., & Grant, D. B. (2017). Management
challenges in creating value from business analytics.
ICEIS 2022 - 24th International Conference on Enterprise Information Systems
60

European Journal of Operational Research, 261(2),
626–639. https://doi.org/10.1016/j.ejor.2017.02.023
Walls, C., & Barnard, B. (2019). Success factors of big data
to achieve organisational performance. December.
https://www.researchgate.net/publication/337991292_
Success_factors_of_big_data_to_achieve_organisation
al_performance
Wamba, S. F., Gunasekaran, A., Akter, S., Ren, S. J. fan,
Dubey, R., & Childe, S. J. (2017). Big data analytics
and firm performance: Effects of dynamic capabilities.
Journal of Business Research, 70, 356–365.
https://doi.org/10.1016/j.jbusres.2016.08.009
White, A. (2019). Gartner - Our Top Data and Analytics
Predicts for 2019. https://blogs.gartner.com/
andrew_white/2019/01/03/our-top-data-and-analytics-
predicts-for-2019/
Zar, J. H. (1972). Significance testing of the spearman rank
correlation coefficient. Journal of the American
Statistical Association, 67(339), 578–580.
https://doi.org/10.1080/01621459.1972.10481251
An Application of the Analytic Hierarchy Process to the Evaluation of Companies’ Data Maturity
61
