
Putting Chaos into Perspective: Evaluation of Statistical Test Suite
Implementations on Isolated Sequences of Arbitrary Length
Pol H
¨
olzmer
a
, Manuel Koschuch
b
and Matthias Hudler
c
Competence Centre for IT Security, University of Applied Sciences FH Campus Wien, Vienna, Austria
Keywords:
Statistical Randomness Tests, NIST SP 800-22, Open Source, Binary Classifier, Randomness-as-a-Feature.
Abstract:
Randomness is ambiguously defined as the absence of structure, whereby reliable generation and evaluation
thereof imposes a complex problem. Efforts have been made to quantify randomness by developing random-
ness test suites as aggregation of selected statistical methods. This study aims to evaluate caveats developers
may encounter employing such methods, and compares the application of randomness test suites for arbi-
trary data to evaluate features of randomness. Therefore, an initial set of three open-source Python-based
implementations of the NIST SP 800-22 test suite have been analyzed and compared. The results indicate
no ”one-size-fits-all” approach when assessing randomness; instead, it demonstrates how deviations between
specification and implementation can lead to inaccurate results and erroneous conclusions about randomness.
1 INTRODUCTION
The concept of randomness is complex and counter-
intuitive, as it is by its very definition the absence of
structure or any predictability. Consider the follow-
ing sentence as an introductory example: ”A quick
brown fox jumps over the lazy dog!” and the question
of this 42 Byte isolated sequence being ”random” or
not. Given the human instinct, trained to look for pat-
terns, probably none would consider this sequence to
be ”random”. Nevertheless, common statistical meth-
ods and specialized test suites classify this sequence
as such (as we will also show in Section 5). This prob-
lem raises the question of how such methods perform
and for which application areas they are suitable be-
sides the evaluation of random number generators.
A variety of statistical methods exist to evaluate
randomness, which all have their own properties and
limitations. Statistical methods are often combined
into test suites to compensate for limitations by look-
ing at multiple results more broadly. In principle, a
sequence to be tested can represent any form of a data
stream. This includes more or less structured data,
such as TXT, DOC, PDF, over encrypted data, such as
XOR, RC4, AES, up to ”random” data generated by
Pseudo (PRNG) or True Random Number Generators
a
https://orcid.org/0000-0001-9046-7963
b
https://orcid.org/0000-0001-8090-3784
c
https://orcid.org/0000-0003-4879-018X
(TRNG). Knowledge of the data structure is required
to be able to process data. Ultimately, it all comes
down to a binary sequence as the only accurate rep-
resentation for any given data stream in information
systems, which may be considered chaos by humans
unable to (efficiently) process binary data.
The Python programming language was the pri-
mary tool used in this project. Compared to C, Python
is not the most efficient language, yet it has become
a tool that has found great acceptance in many areas,
as in the field of data science, where it is in no way
inferior to its colleagues R or Matlab. Even embed-
ded systems can benefit from this popularity by us-
ing a subset of the Python standard library, called Mi-
croPython. Python has a large community that pro-
duces Free and Open Source Software (FOSS) on a
daily basis. However, FOSS is not automatically a
seal of quality. FOSS makes up a large share of the
tools used daily in many different domains. Major
projects have immense community support and are
usually well maintained, but minor personal projects
also exist. When browsing for tools, frameworks, or
packages, users usually install blindly, using package
managers, without looking at the code. Thus, one en-
joys the benefit of a black-box that is easy to install,
always at hand, and implements all the desired func-
tions. Theory and practice are often far apart, and dif-
ferent implementations of the exact specification op-
timally have identical results, even though a different
approach has been employed to reach a given state.
258
Hölzmer, P., Koschuch, M. and Hudler, M.
Putting Chaos into Perspective: Evaluation of Statistical Test Suite Implementations on Isolated Sequences of Arbitrary Length.
DOI: 10.5220/0011087400003194
In Proceedings of the 7th International Conference on Internet of Things, Big Data and Security (IoTBDS 2022), pages 258-266
ISBN: 978-989-758-564-7; ISSN: 2184-4976
Copyright
c
2022 by SCITEPRESS – Science and Technology Publications, Lda. All rights reser ved

1.1 Problem Statement
In a recent, yet unrelated, project using Tensorflow to
work with machine learning (or pattern recognition),
the assessment of randomness (or absence of any pat-
tern) was required as a feature of the employed model.
During this project, the question arose of how to col-
lect and use this property from arbitrary data to im-
prove the learning curve with measurement and to sort
by the amount of ”structure” supporting further devel-
opment. A cursory glance at Github looking for ran-
domness tests in Python revealed several projects im-
plementing well-established randomness test-suites.
However, the initially selected open-source imple-
mentation of a randomness test suite produced results
that could only be described as ”random” at the time,
mainly due to the rather short sequences tested. Fur-
ther comparisons and evaluations revealed noticeable
differences in the results of different implementations
of the same test suite. These findings raised funda-
mental questions about how developers should deal
with these problems, so these points were pursued,
deepened, and addressed in this work.
With this work, we want to provide the first indi-
cators for developers on how to approach the prob-
lem of classifying an isolated sequences of arbitrary
length. In this context, an isolated sequence is defined
as any stream of bits, which is evaluated without any
context besides the sequence length and ”amount of
structure” derived from statistical test results. While
this paper focuses on comparing specific implemen-
tations to identify problem areas, it does not aim to
evaluate the statistical methods but rather the difficul-
ties developers face in implementing and using such.
1.2 Related Work
To the best of our knowledge, there are currently
no publications dealing with the practical problems
of evaluating the quality of open-source implementa-
tions of randomness test suites, focusing on the ap-
plications of diverse datasets and arbitrary length se-
quences to extract features of randomness.
Beside others, (Bastos et al., 2019; Parisot et al.,
2021; Popereshnyak and Raichev, 2021) et al. fo-
cus on the originally intended application of random-
ness test suites to evaluate and select random num-
ber generators. (Zia et al., 2022; Poojari et al., 2021;
Gao et al., 2022) et al. are trying to design new en-
tropy sources focusing on the constraint Internet of
Things (IoT). Others, are specialized in the evalua-
tion of short sequences based on block cipher (Sulak
et al., 2010), or specialized in the randomness of cryp-
tographic function mappings (Kaminsky, 2019).
However, none of them question the way on how
those evaluated randomness properties could be con-
sidered as a staggering feature. So with this work,
we want to make the first steps towards addressing
this gap, not from a purely mathematical or statistical
but more of an ”expert in other areas” point of view.
This work focuses on applying (black box) statisti-
cal randomness test to extract features of randomness
by ”amount of structure”. This work evaluates struc-
ture as the opposite of randomness and addresses how
much data is required for an isolated sequence to de-
tect structure and dissolve chaos, which may be pro-
vided to data type classifiers as features.
2 BACKGROUND
2.1 Randomness
The analogy of the ”unbiased (fair) coin” is one at-
tempt to describe randomness that is easy to follow.
It assumes that elements can be generated in a se-
quence of evenly distributed values by tossing an un-
biased coin with sides labeled with values ”1” or ”0”.
Thereby, each coin flip is independent of one another
and has a probability of 50% of producing a ”1” or
”0” (Bassham et al., 2010). Consequently, such a se-
quence has no structure that allows for prediction or
correlation. The concept of randomness may be re-
jected in philosophy and religion, where the concept
of fate is believed in. In cryptography, on the other
hand, there is no use for fate but in predictability
and probability instead. Random data can be gener-
ated using random number generators (RNG), which
come in two primary forms: Pseudo-RNG (PRNG)
and True-RNG (TRNG) (or simply RNG). A TRNG
gains randomness from non-deterministic physical
phenomena such as the LavaRand (Cloudflare, 2017)
or atmospheric noise (Haahr, 2018). PRNG uses a
deterministic algorithm that is fed some input values,
often defined by a seed value. These types of RNG
are fast but can produce weak randomness if either
the algorithm is weak, the seed is known, or if enough
data has been collected so that the probability of pre-
dictability increases. Compared to TRNG, a PRNG
does not generate randomness, but chaos, which a
(non-linear) formula can model. Typically intersec-
tions of the two are used to create a usable Crypto-
graphically Secure PRNG (CSPRNG) that uses phys-
ical phenomena to create a source pool with high en-
tropy that serves as input to a robust algorithm that
generates an arbitrary amount of random data that is
unpredictable, no matter how much data was gener-
ated by the CSPRNG (Cloudflare, 2017).
Putting Chaos into Perspective: Evaluation of Statistical Test Suite Implementations on Isolated Sequences of Arbitrary Length
259

2.2 Statistics
Statistical tests are formulated to test the null hypoth-
esis (H0) that a given test sequence is random, in con-
junction with the alternative hypothesis (Ha) that the
sequence is not random. For each applied test, a deci-
sion is derived that accepts or rejects the null hypoth-
esis (Bassham et al., 2010). Since statistical methods
have their strengths and weaknesses, different meth-
ods are combined in test suites, which are all unique
in scope and application:
• Diehard: Published in 1996, this suite provides
a battery of 12 statistical tests for measuring the
quality of RNG. There is an improved variant
called Dieharder in native C, which, i.a., extends
the list of tests to 26. (Marsaglia, 1995; Robert
G. Brown, 2003)
• ENT: Statistical test for command-line applica-
tion released in 1998, which uses five tests to de-
tect the basic characteristics of random sequences
including Entropy, Chi-Square, and Arithmetic
Mean. (Walker, 1998)
• NIST SP 800-22: Originally released in 2001, the
NIST Special Publication 800-22 Rev. 1a pro-
vides 15 tests to evaluate the randomness of ar-
bitrary long binary sequences. The publication is
currently under review as of July 2021. (Bassham
et al., 2010)
• TestU01: Software library implemented in ANSI
C that offers a collection of 7 tests for the empir-
ical statistical testing of uniform RNG. (L’Ecuyer
and Simard, 2007)
3 RESEARCH DESIGN
This study evaluates the performance and quality of
a given set of randomness test suite implementations
through a quantitative and qualitative case study. Due
to the reputation, the number of tests, and availability
of implementations in Python, the National Institute
of Standards and Technology’s (NIST) Special Pub-
lication (SP) 800-22 (Bassham et al., 2010) was cho-
sen for the one randomness test suite to be used here.
This test suite provides the basis for all analyses, re-
sults, and conclusions drawn for arbitrary data and use
cases. We do not evaluate the NIST SP 800-22 it-self,
but open source implementations thereof. The NIST
SP 800-22 contains a set of 15 statistical tests. The
NIST recommends a minimum input sizes and addi-
tional prerequisites and conditions for each of these
tests to ensure the reliability, which will become an
important factor for our evaluation. Therefore, it has
to be noted that only at an input size of 1 Mbit all
15 randomness tests forming the test suite may be in-
cluded in the evaluation. The following list shows the
NIST SP 800-22 test battery and their recommended
minimum input size:
1. Frequency (aka. Monobit) Test 100 bit
2. Frequency within a Block Test 100 bit
1
3. Runs Test 100 bit
4. Longest-Run-of-Ones in a Block 128 bit
1
5. Binary Matrix Rank Test 38,912 bit
6. Discrete Fourier Transform Test 1,000 bit
7. Non-overlapping Template Matching
2
1 bit
1
8. Overlapping Template Matching 1,000,000 bit
9. Maurer’s ”Universal Stat.” Test 387,840 bit
10. Linear Complexity Test 1,000,000 bit
1
11. Serial Test 1 bit
1
12. Approximate Entropy Test 1 bit
1
13. Cumulative Sums Test 100 bit
14. Random Excursions Test 1,000,000 bit
15. Random Excursions Variant Test 1,000,000 bit
4 METHODS
The general methodology consists of three phases:
1. Determining a variety of NIST SP 800-22 test
suite implementations.
2. Generating appropriate datasets used for testing,
validation and results.
3. Preparing a common interface and validation
framework for automated tests.
4.1 Implementations
A set of three Python-based FOSS implementations
has been selected. A naming convention for the im-
plementations based on the authors’ initials is here-
after introduced to have a uniform way of identifica-
tion; also, a color pattern is used to ease the interpre-
tation of the results and related graphs.
It is very important for us to emphasize that this
analysis is in no way intended to criticize or belit-
tle the listed implementations in any way. Providing
FOSS is hard work, and any comments in this work
should be considered constructive feedback and may
be used to improve the implementation. Any claim we
make has been validated to the best of our knowledge
and may not be covered by intentional use cases.
1
Additional eligibility checks apply
2
Features non-deterministic characteristics
IoTBDS 2022 - 7th International Conference on Internet of Things, Big Data and Security
260

• DJ aka. dj-on-github/sp800 22 tests (Johnston,
2017) (114 stars, 29 forks): The earliest im-
plementation in the list was created by David
Johnston, Engineer at Intel and author of ”Ran-
dom Number Generators, Principles and Prac-
tices” (Johnston, 2018). This implementation is
”simplistic” in terms of coding concepts.
• LP aka. InsaneMonster/NistRng (Pasqualini,
2019) (18 stars, 8 forks): This work by Luca
Pasqualini (SAILab) from the University of Siena
is inspired by the work of David Johnston. The
implementation is the ”most advanced” in terms
of coding concepts and is available as pip pack-
age thus, it is the most convenient to use and was
the starting point for this work.
• SA aka. stevenang/randomness testsuite (Ang,
2018) (50 stars, 12 forks): The Independent in
Comparison, implemented by Steven Kho Ang.
This implementation is characterised by the pro-
vision of an additional graphical user interface.
4.2 Datasets
This work is not focused on evaluating a single source
of data of a given length. Instead, results are acquired
by feeding data to each implementation and validating
the number of passed tests in relation to input length,
which results in a two-dimensional representation per
implementation with input length on the x-axis, and
the sum of S-values or P-values on the y-axis. But
there is also a z-axis, by means of different datasets,
which are staggered by the amount of expected ”struc-
ture”. Employed datasets are large blobs with more
than 100 MB of data of a common ”language” from
which at random a sample is extracted for a specific
test run. The datasets are chosen to cover all interest-
ing cases, not to focus on any specific scenario; there-
fore, the datasets are introduced without greater gen-
eration details. Depending on the generation process,
employed datasets are categorized into classes: ran-
dom, cipher, or encoding. Finally, the datasets are or-
dered as listed from expected ”randomness” to ”struc-
ture”. Many different types of data may be, and have
been, compared using our method. This list reflects
only a small selection of data sets with noteworthy at-
tributes spanning over the whole spectrum:
1. RND: ”True” randomness acquired via
RANDOM.ORG (Haahr, 2018) gained from
atmospheric noise, as the epitome of randomness.
2. DES: Weak block cipher in ECB mode using a
weak key to add structural distortion compared to
other cipher-modes, generated with OpenSSL.
3. ZIP: File archive of the aclImdb (Maas et al.,
2011) dataset to evaluate the amount of chaos in-
troduced by compression.
4. TXT: English text consisting of printable-ASCII,
based on a large movie review dataset (Maas et al.,
2011), which is further used as basis for genera-
tion of the DES, and ZIP datasets.
5. NUL: Straight binary sequence of all zeros (Null-
Bytes) which together with the all-ones sequence
can be argued as the epitome of structure.
4.3 Framework
A custom framework has been developed to overcome
considerable differences in how each implementation
handles inputs and provides output. These differences
make it cumbersome to operate and to compare the re-
sults manually. For this reason, a common interface
was designed for all implementations, and wrapper
functions were developed to enable large-scale auto-
matic tests to be carried out. This interface was then
embedded into custom applications based on Jupyter
notebooks, providing the easy-to-use ability to bench-
mark, plot, and analyze implementation characteris-
tics like quality and time. The open-source Python li-
braries pandas (McKinney et al., 2010; Pandas Devel-
opment Team, 2020) and matplotlib (Hunter, 2007)
were of priceless help here.
All randomness tests return one straightforward
metric, namely the probability, or P-value in short,
in the range of zero to one, which summarizes the
strength of the evidence against the null hypothesis.
Tests are then run against a decision rule based on a
significance level of 10% for each test in the SP 800-
22 test suite, which means that any input for which
a test returns a P-value above the decision mark is
considered to be random by passing the test, with
a P-value of 1 stating perfect randomness. The re-
sult of this comparison is hereafter defined as S-Value
(Success-Value). Some tests may have lower signif-
icance levels or additional checks for a positive S-
Value. This work mainly focuses on S-Values as
Key Performance Indicators (KPI) to ease compar-
isons over the whole spectrum, rather than gathering
enough P-Values for generic P-Graphs. P-Values are
suitable for evaluating data sources by generating vast
amounts of data while being too volatile to evaluate
isolated sequences, as can be seen in Figure 2.
The test spectrum covers different scenarios in
which the test suite may be applied, including the
number of tests, the quality of the results, and the cal-
culation speed in relation to different data lengths to
be tested. One would think the number of tests is al-
ways the same when using only the same test suite,
Putting Chaos into Perspective: Evaluation of Statistical Test Suite Implementations on Isolated Sequences of Arbitrary Length
261
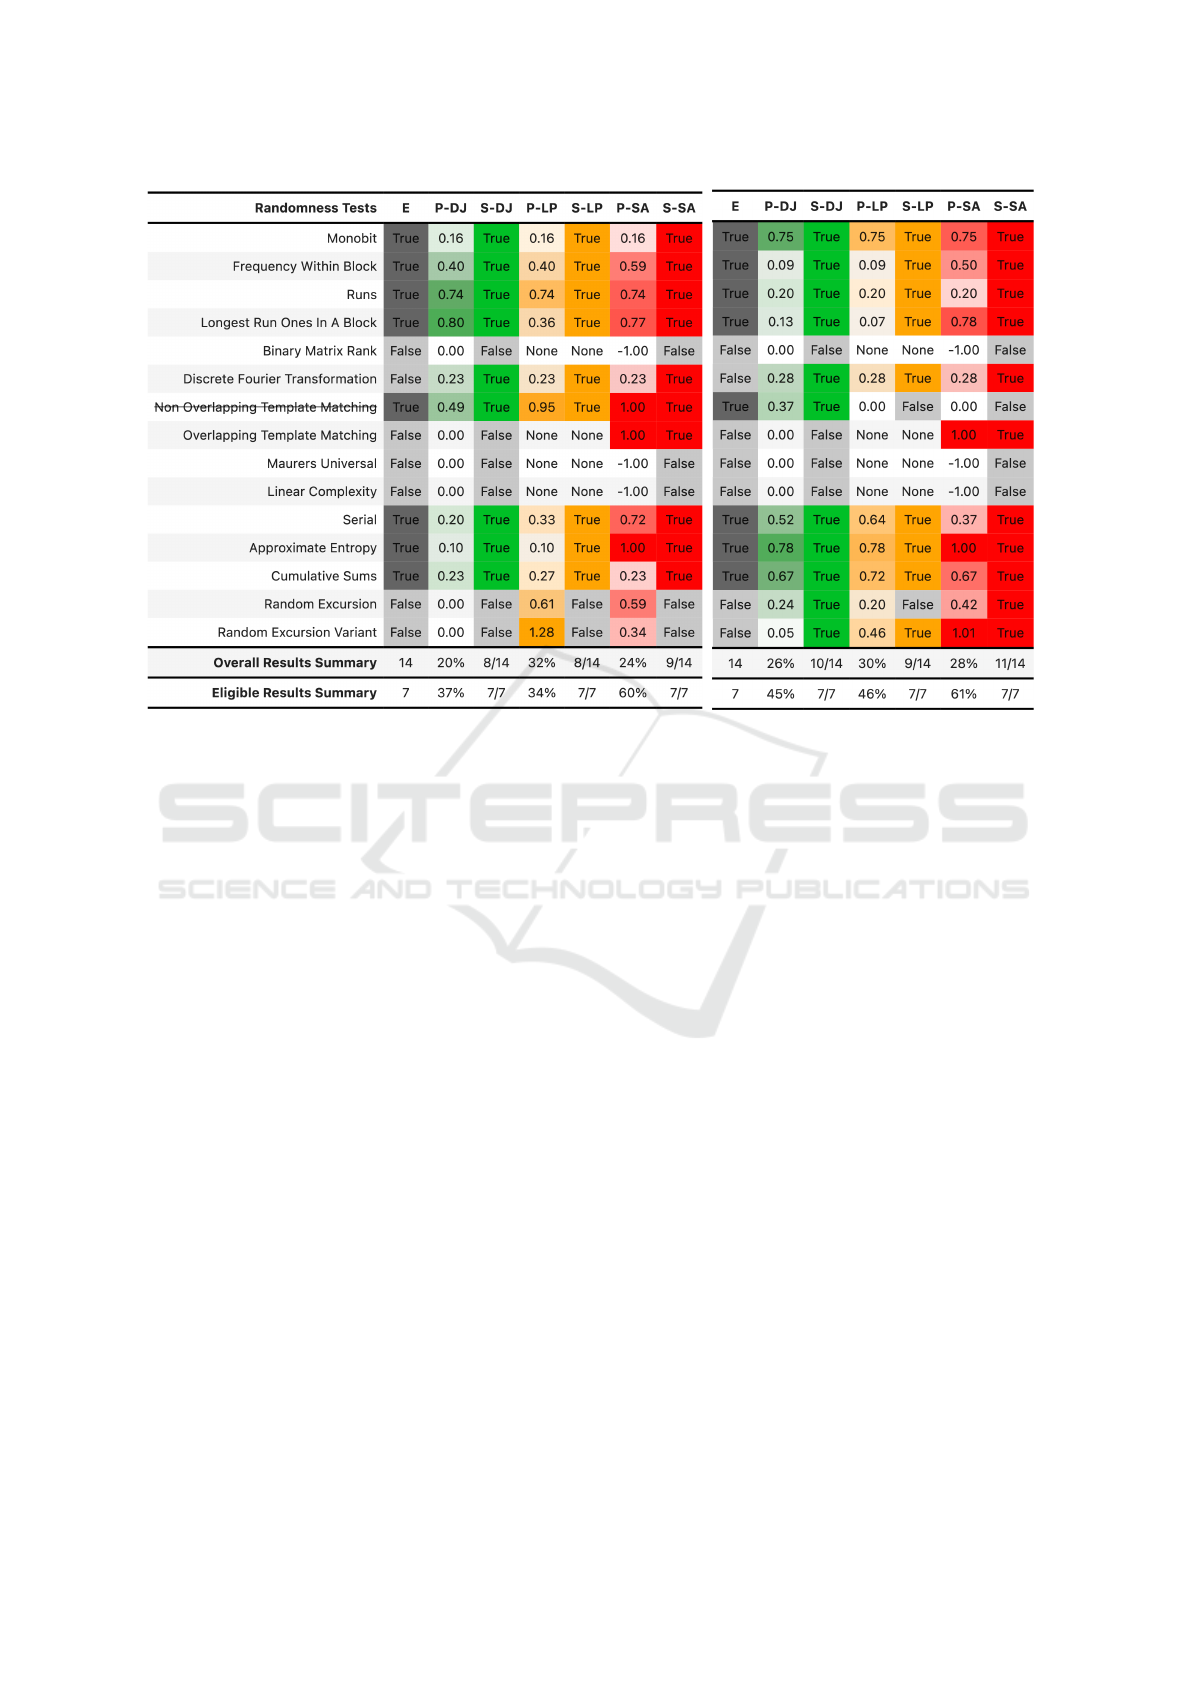
(a) 42B Pangram (TXT dataset) from the introductory Example.
(b) 42B Sample from the RND dataset.
Figure 1: [P]robability and [S]uccess Calculation for [E]ligible NIST SP 800-22 Tests.
yet not all tests are applicable for all input lengths or
may have other preconditions, as shown in the list of
the statistical tests involved. The input length is an
essential factor, as different use cases rely on shorter
or longer sequences of data, while the test suite it-
self is claimed to be applicable for an arbitrary length
of data; a given implementation may score differently
in some scenarios where the different length of se-
quences of the same data set are fed. Finally, the
speed of calculation, which naturally increases with
the number of tests and input length, is an important
factor that is not always tolerable. The growth is lin-
ear with occasional jumps, depending on how many
tests are effectively applied at a given length. For ex-
ample, testing a 128 bit value takes less than a sec-
ond but only runs reliably against 8 out of 15 tests.
On the other hand, to perform all 15 tests reliably, a
minimum length of about 1Mb is required, whereby
such a run takes between one and three minutes (on
high-performance hardware) depending on the imple-
mentation, as later discussed and shown in Table 1.
It should be noted that some implementations do not
respect the input size recommendations for all tests
or do not label the result appropriately to differentiate
between a failed and a non-eligible test. Non-eligible
tests should then be treated as unreliable or advisory,
if at all.
5 ANALYSIS
The selected implementations are analyzed using the
previously defined framework and datasets. In order
to conclude on the defined metrics and scenarios, the
framework has been used to develop multiple appli-
cations in form of Jupyter Notebooks, which focus on
details, average quality, and time for different datasets
and input lengths. With each run of an application, a
given dataset sample is fed to each implementation.
Each run is repeated for an increasing range of sample
length, starting at the same offset of the data source.
Note that a sample would randomly start at a different
offset for any following run, which allows evaluating
how the implementations react to the same input, as
it is fed with more data of the same sequence. The
results are returned as Pandas DataFrames and are
plotted for better visualization. The tools are not yet
publicly available; however, we plan on releasing the
Git repository as well as our entire datasets.
The manual analysis for isolated sequences is not
straightforward. Figure 1a shows the results for the
example pangram from the Introduction, a detailed
example of a single test run is discussed to show what
kind of values the randomness test suites return. Fig-
ure 1b on the other hand, shows the results for a se-
quence from the RND dataset of the same length. It is
IoTBDS 2022 - 7th International Conference on Internet of Things, Big Data and Security
262

Figure 2: Example Results (P-Value) for the Datasets ”TXT” and ”RNG” (grey overlay) split by Run and Implementation.
intended to show that it is hard to conclude random-
ness, especially for short sequences. Note that these
results are presented as they are returned from the
actual implementations. Although the sum of the P-
values is higher on average for 1b, which is not always
true for other samples of the same dataset, all tests are
passed for 1a too, so that both examples pass all el-
igible randomness tests. P-Values may vary largely,
while S-Values are relatively constant. This fact is vi-
sualized in Figure 2, which shows the average results
of P-Values for applied randomness tests for ten runs
over the three different implementations. The result-
ing P-Values are used to average the test runs for Fig-
ures 4a and 4d in the Appendix. It is intended to show
that the results of both datasets are similar for short
sequences, then start to diverge with larger input se-
quences. Figure 2 reveals similar resulting curves for
the ”TXT” dataset, per run and implementation, while
the curve of the ”RND” dataset has no visible pat-
terns. Note that, with increasing structure, the runs re-
sulting curves feature correlate with a higher degree.
These detailed views are employed for manual
analysis of anomalies within the other tools, which
abstract or summarize these results per run instead
of every test. Some implementations do not dif-
ferentiate between zero and non-applicable (None)
tests. Also, some implementations have slightly dif-
ferent criteria for eligibility that differ from the SP
800-22. Note that the E column denotes all eligible
tests for the given sample data based on the NIST In-
put Size Recommendation (Bassham et al., 2010) and
that the Non-Overlapping Template Matching test is
not taken into consideration for the summary due to
its non-deterministic characteristics. Besides the de-
tailed view, the developed Notebook employs addi-
tional views for time and quality benchmarks, which
will be introduced in the following chapter.
6 RESULTS
For all datasets introduced, benchmarks were per-
formed on time, quality (S-Value), and accuracy (P-
Value). The test results for time can be seen in Ta-
ble 1. The results for accuracy and quality have been
added to the Appendix as Figure 3 and 4, respec-
tively. Each plot is the outcome of the average re-
sults for 100 runs with a maximum of 2
20
Bytes input
length, which required around 24 hours of calcula-
tion time on an 8-core (16-thread) Intel i9 CPU. The
graphs show the average P-Values and S-Values for
performed runs. Each benchmark run is performed
for n steps using the input size of 2
n
Bytes, where
n ∈ [0, 20]. The x-axis employs a logarithmic scale. 2
n
may be considered a minimum, but smaller sequences
are tested for completeness. Benchmark calculations
were threaded to optimize processor performance and
parallelize calculations. Note that the light-grey line
and area in the quality and accuracy plots, denotes the
maximum value that could be reliably achieved for a
given input length. Optimally, the results should not
exceed this line. The results show that the experiment
was successful, yet many points were not as expected.
The main observations, per implementation, are given
in the following list:
• DJ : Overall good results in time and quality. The
code leaves room for performance improvements.
Weaker in the detection of ”true” structure.
• LP : Decent quality but fails for input over 2
13
Bytes and worst in time. Best in eligibility checks.
Easiest to install and use. Scores have a small
peak at 2
16
Byte of input.
• SA : Decent quality, but the results are gener-
ally too high, yet the fastest in the set. Behaves
strangely at 2
7
Byte of input where scores peak.
Putting Chaos into Perspective: Evaluation of Statistical Test Suite Implementations on Isolated Sequences of Arbitrary Length
263

Table 1: Average Results of 10 Runs from 2
0
to 2
20
Byte Inputs for Time Calculation.
n 2
n
Byte 8·2
n
Bit
DJ
LP
SA
0 1 8 189ms 4ms 420ms
1 2 16 179ms 8ms 428ms
2 4 32 181ms 8ms 438ms
3 8 64 185ms 14ms 441ms
4 16 128 170ms 20ms 450ms
5 32 256 170ms 30ms 460ms
6 64 512 190ms 60ms 460ms
7 128 1 Ki 200ms 100ms 500ms
8 256 2 Ki 240ms 200ms 550ms
9 512 4 Ki 320ms 380ms 640ms
10 1 Ki 8 Ki 440ms 740ms 820ms
11 2 Ki 16 Ki 700ms 1s 429ms 1s 159ms
12 4 Ki 32 Ki 1s 189ms 2s 890ms 1s 850ms
13 8 Ki 64 Ki 2s 319ms 5s 950ms 3s 250ms
14 16 Ki 128 Ki 4s 320ms 11s 570ms 5s 960ms
15 32 Ki 256 Ki 8s 439ms 22s 850ms 11s 119ms
16 64 Ki 512 Ki 17s 350ms 48s 299ms 22s 730ms
17 128 Ki 1 Mi 1m 29s 900ms 2m 59s 240ms 43s 840ms
18 256 Ki 2 Mi 2m 57s 569ms 5m 47s 069ms 1m 26s 409ms
19 512 Ki 4 Mi 5m 55s 860ms 11m 31s 600ms 2m 53s 530ms
20 1Mi 8Mi 12m 9s 179ms 23m 21s 910ms 5m 52s 930ms
Our preliminary results are highly context-
dependent and require additional interpretation.
Some of the statistical tests evaluate at bit, byte, or
block level, which favor some structured or chaotic
datasets. Also, the results for inputs smaller than 2
5
have hardly any significance. Finally, the number of
ineligible and, therefore, unreliable tests distort the
results. Full eligibility starts at 1Mbit. Note the dip
in the graphs as the length increases, which indicates
the input length at which the algorithm can recog-
nize structure within the chaos and starts to classify
sequences as being not so random. As expected, the
more structure attributed to the dataset, the further this
dip shifts to the left. In this way, DES in ECB mode
can be detected as no longer random, with a minimum
sample size of about 2
17
Byte.
Based on the results shown in Table 1, it can
be seen that the implementations strongly differ in
time consumed, where the fastest implementation for
smaller input became the slowest by a factor of four
for larger inputs. This fact is related to implemen-
tation differences, preliminary eligibility tests, and
thus the number of tests that are only ”unlocked” with
larger input. Python may not be committed to perfor-
mance, but the implementations would benefit from it,
which could be achieved by multi-threading or by use
of the Python libraries NumPy in combination with
Numba just-in-time (jit) compilation to maximize par-
allel computing and efficiency. In addition, Numba
also provides CUDA support for the use of NVIDIA
Graphics Processing Units (GPU).
7 CONCLUSION
It can be concluded that the NIST SP 800-22 is only
partially suited to extract features of randomness from
isolated sequences and requires a lot of data to per-
form at full scale. For this, the calculations are too
computationally intensive to be applied to larger data
sets. Therefore, results for short sequences of 2
7
Bytes (1,024 bit) or less are hardly meaningful. We
also could show that the compared implementations
differ in results, although they implement the same
specification, which should produce almost identical
results, highlighting the importance for developers to
be careful on selecting test suite implementations for
evaluation of RNGs or similar.
Future Work will show how to incorporate the re-
sults into applications to acquire better randomness
feature extraction by interpreting the relation between
input length, dataset, and the actual P-Values (or even
values of the tests internal state) to achieve better
accuracy using only KPIs while respecting a given
context. Until then, we mainly gain from these first
results that developers looking for easy and reliable
ways to check for the randomness of a given solu-
tion should be careful when interpreting the results
IoTBDS 2022 - 7th International Conference on Internet of Things, Big Data and Security
264

of open-source implementations of randomness test
suites. Always take them with reservations, when in
doubt, use multiple different implementations or test
suites to get a holistic picture.
REFERENCES
Ang, S. K. (2018). stevenang/randomness testsuite. https:
//github.com/stevenang/randomness\ testsuite.
Bassham, L. E., Rukhin, A. L., Soto, J., Nechvatal, J. R.,
Smid, M. E., Barker, E. B., Leigh, S. D., Levenson,
M., Vangel, M., Banks, D. L., Heckert, N. A., Dray,
J. F., and Vo, S. (2010). Nist sp 800-22 rev. 1a. a statis-
tical test suite for random and pseudorandom number
generators for cryptographic applications.
Bastos, D. C., Kowada, L. A. B., and Machado, R. C. S.
(2019). Measuring randomness in iot products. In
2019 II Workshop on Metrology for Industry 4.0 and
IoT (MetroInd4.0 IoT), pages 466–470.
Cloudflare (2017). Lavarand in production: The nitty-
gritty technical details. https://blog.cloudflare.com/
lavarand-in-production-the-nitty-gritty-technical-details/.
Accessed: 2021-12-27.
Gao, B., Lin, B., Li, X., Tang, J., Qian, H., and Wu, H.
(2022). A unified puf and trng design based on 40-nm
rram with high entropy and robustness for iot security.
IEEE Transactions on Electron Devices.
Haahr, M. (1998–2018). RANDOM.ORG: true random
numbers. https://www.random.org. Accessed: 2021-
12-24.
Hunter, J. D. (2007). Matplotlib: A 2d graphics environ-
ment. Computing in Science & Engineering, (3):90–
95.
Johnston, D. (2017). dj-on-github/sp800 22 tests. https:
//github.com/dj-on-github/sp800\ 22\ tests.
Johnston, D. (2018). Random Number Genera-
tors—Principles and Practices: A Guide for Engi-
neers and Programmers. De—G Press.
Kaminsky, A. (2019). Testing the randomness of cryp-
tographic function mappings. IACR Cryptol. ePrint
Arch., 2019:78.
L’Ecuyer, P. and Simard, R. (2007). Testu01: A c library for
empirical testing of random number generators acm
transactions on mathematical software. http://simul.
iro.umontreal.ca/testu01/tu01.html. Accessed: 2021-
12-27.
Maas, A. L., Daly, R. E., Pham, P. T., Huang, D., Ng, A. Y.,
and Potts, C. (2011). Learning word vectors for sen-
timent analysis. In Proceedings of the 49th Annual
Meeting of the Association for Computational Lin-
guistics: Human Language Technologies, pages 142–
150, Portland, Oregon, USA. Association for Compu-
tational Linguistics.
Marsaglia, G. (1995). The marsaglia random number cdrom
including the diehard battery of tests of randomness.
https://www.stat.fsu.edu/pub/diehard.
McKinney, W. et al. (2010). Data structures for statistical
computing in python. pages 51–56.
Pandas Development Team (2020). pandas-dev/pandas:
Pandas.
Parisot, A., Bento, L. M. S., and Machado, R. C. S.
(2021). Testing and selecting lightweight pseudo-
random number generators for iot devices. In 2021
IEEE International Workshop on Metrology for Indus-
try 4.0 IoT (MetroInd4.0 IoT), pages 715–720.
Pasqualini, L. (2019). Insanemonster/nistrng. https://
github.com/InsaneMonster/NistRng.
Poojari, A., Nagesh, H., et al. (2021). Fpga implementation
of random number generator using lfsr and scrambling
algorithm for lightweight cryptography. International
Journal of Applied Science and Engineering, 18(6):1–
9.
Popereshnyak, S. and Raichev, A. (2021). The development
and testing of lightweight pseudorandom number gen-
erators. In 2021 IEEE 16th International Conference
on Computer Sciences and Information Technologies
(CSIT), volume 2, pages 137–140.
Robert G. Brown, Dirk Eddelbuettel, D. B. (2003).
Dieharder: A random number test suite. http://
webhome.phy.duke.edu/
∼
rgb/General/dieharder.php.
Accessed: 2021-12-27.
Sulak, F., Do
˘
ganaksoy, A., Ege, B., and Koc¸ak, O. (2010).
Evaluation of randomness test results for short se-
quences. pages 309–319.
Walker, J. (1998). Dieharder: A random number test suite.
https://www.fourmilab.ch/random/. Accessed: 2021-
12-27.
Zia, U., McCartney, M., Scotney, B., Martinez, J., and Saj-
jad, A. (2022). A novel pseudo-random number gen-
erator for iot based on a coupled map lattice system
using the generalised symmetric map. SN Applied Sci-
ences, 4(2):1–17.
APPENDIX
Benchmark Environment
• CPU: i9-9980HK
• macOS: 12.1.1
• Python: 3.8.12
• Jupyter-lab: 3.2.1
• Pandas: 1.3.1
• Matplotlib: 3.3.4
Benchmark Quality
See Figures 3 and 4.
Putting Chaos into Perspective: Evaluation of Statistical Test Suite Implementations on Isolated Sequences of Arbitrary Length
265
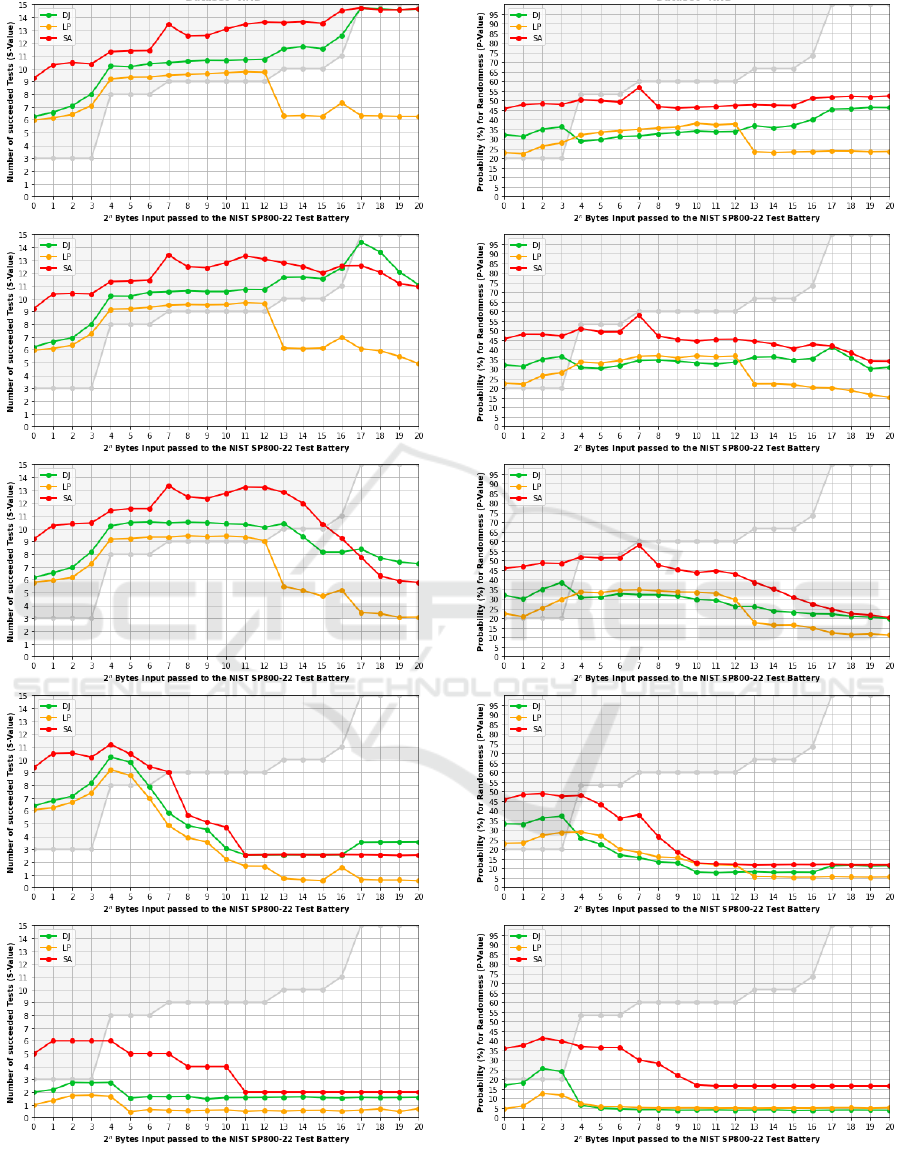
(a) Results (S-Value) for Dataset ”RND”.
(b) Results (S-Value) for Dataset ”DES”.
(c) Results (S-Value) for Dataset ”ZIP”.
(d) Results (S-Value) for Dataset ”TXT”.
(e) Results (S-Value) for Dataset ”NUL”.
Figure 3: Average Succeeded Randomness tests of 100
Runs per Dataset with Inputs of Length from 2
0
to 2
20
Byte.
(a) Results (P-Value) for Dataset ”RND”.
(b) Results (P-Value) for Dataset ”DES”.
(c) Results (P-Value) for Dataset ”ZIP”.
(d) Results (P-Value) for Dataset ”TXT”.
(e) Results (P-Value) for Dataset ”NUL”.
Figure 4: Average Probability for Randomness of 100
Runs per Dataset with Inputs of Length from 2
0
to 2
20
Byte.
IoTBDS 2022 - 7th International Conference on Internet of Things, Big Data and Security
266
