
BIKE2WORK: A Shift Towards Sustainable Mobility
Antonio Bucchiarone
1 a
, Annapaola Marconi
1 b
, Piergiorgio Cipriano
2
and Luca Giovannini
2
1
Fondazione Bruno Kessler (FBK), Trento, Italy
2
Dedagroup Public Services, Trento, Italy
Keywords:
Sustainable Mobility, Active Mobility, Smart City, Motivational Systems, Engagement, Behavior Change.
Abstract:
Encouraging a shift towards sustainable mobility habits based on active mobility is a key challenge for many
cities, since they are increasingly facing problems of traffic congestion, road safety, energy dependency and
air pollution. Active modes, as cycling, which are also the least polluting, should be particularly encouraged,
especially for local recurrent journeys (i.e., home–to–school, home–to–work). In this context, addressing
and mitigating commuter-generated traffic requires engaging public and private stakeholders through new
innovative and collaborative approaches that focus not only on supply (e.g., roads and vehicles), but also on
transportation demand management. In this paper we propose an approach to home–to–work mobility able to
support the company Mobility Manager (MM) acting on the promotion of sustainable mobility and transport
demand management by analysing the problems, needs and habits of employees, and trying to orient them
towards new sustainable transport habits.
1 INTRODUCTION
Mobility plays a fundamental role within modern
cities(Lyons, 2018): the way in which citizens ex-
perience the city, access its core services, and par-
ticipate in the city life strongly depends on its mo-
bility organization and efficiency (Vesco and Ferrero,
2015; Torrisi et al., 2020). In this context, the chal-
lenge that cities are facing is very ambitious: on the
one hand, administrators must guarantee to their cit-
izens the right to mobility and to easily access local
services, on the other hand they need to minimize
the economic, social, and environmental cost of the
mobility system (Cruz and Paulino, 2021; Haarstad,
2017).
Dealing with this challenge requires a holistic
approach that allows to efficiently harness existing
mobility resources while integrating and promoting
new or emerging mobility services to enable an in-
tegrated, efficient, and sustainable mobility ecosys-
tem (Gallo and Marinelli, 2020; Klecha and Gianni,
2018). To this end, cities are planning and imple-
menting interventions at the level of infrastructures,
services, and mobility policies. These are certainly
key ingredients towards a more sustainable and in-
tegrated mobility(Lam and Head, 2011), but another
a
https://orcid.org/0000-0003-1154-1382
b
https://orcid.org/0000-0001-8699-7777
very important aspect to be considered, as a socio-
technical phenomenon, is users’ acceptance and adop-
tion (Giesecke et al., 2016; K
¨
onig et al., 2016). Inno-
vative policies, infrastructures, and services are liable
to fail if they are not combined with actions aimed
at making citizens aware and involved in this process
and to influence their mobility habits in a gradual but
profound way (Vesco and Ferrero, 2015).
In most cases, citizens’ daily mobility choices are
driven by habits and are based on wrong or outdated
beliefs (Gartner et al., 2021; Anagnostopoulou et al.,
2020). Citizens need to be aware of the mobility ser-
vices offered by their city and of their actual value
(in terms of time, cost, and environmental impact).
They need to be conscious of the impact of their in-
dividual daily choices (in terms of traffic, greenhouse
gas emissions and social cost). Most importantly, they
need to feel part of a community that, through daily
individual choices, can play a key role towards the
fulfillment of city-level mobility strategic objectives
(Giffinger, 2019; Kazhamiakin et al., 2021). In other
words, individuals and communities must learn to
take responsible actions and this can only be achieved
through the development of a new culture for urban
mobility. In recent years, a significant effort has been
undertaken to understand how interactive technolo-
gies can be leveraged to raise citizens’ awareness, en-
courage their active participation, break bad habits
Bucchiarone, A., Marconi, A., Cipriano, P. and Giovannini, L.
BIKE2WORK: A Shift Towards Sustainable Mobility.
DOI: 10.5220/0011087000003203
In Proceedings of the 11th International Conference on Smart Cities and Green ICT Systems (SMARTGREENS 2022), pages 147-156
ISBN: 978-989-758-572-2; ISSN: 2184-4968
Copyright
c
2022 by SCITEPRESS – Science and Technology Publications, Lda. All rights reserved
147

and promote behavior change towards a more sus-
tainable lifestyle (Hiselius and Rosqvist, 2016; Al-
Thawadi et al., 2021; Marconi et al., 2021; Badii
et al., 2017).
Our aim, within the AIR-BREAK project
1
, is to
implement sustainable mobility campaigns that in-
volve the whole community raising its awareness on
the possibilities and advantages offered by the avail-
able sustainable mobility services and to encourage
the adoption of different, more sustainable, mobility
habits.
In this paper we present BIKE2WORK: a home–
to–work sustainable mobility campaign targeting em-
ployees of public or private companies that has the
goals to promote the use of bicycles for home-to-work
trips by providing economic incentives. Starting from
the motivations that led to the definition of this cam-
paign (see Section 2), we present the BIKE2WORK ob-
jectives and the various steps that have been per-
formed to engage both companies and employees (see
Section 3). We continue giving details on its technical
implementation supporting its management and oper-
ation (see Section 4). We conclude the paper with
some initial experimental results (see Section 5) and
with some conclusions and future work (see Section
6).
2 BACKGROUND AND
MOTIVATIONS
The transport sector is the largest contributor to green-
house gas (GHG) emissions (SUS, 2020). In 2017,
27% of total EU-28 GHG emissions came from this
sector. Within this sector, cities are the main sources
of global mobility demand due to citizens’ transporta-
tion activities within and between urban areas. Traffic
and commuting inefficiencies negatively impact ur-
ban infrastructure, increase pollution, and harm the
environment and people’s health.
Addressing and mitigating commuter-generated
traffic requires engaging public and private stake-
holders through a new innovative and collaborative
approach that can focus not only on supply (e.g.,
roads and vehicles), but also on transportation de-
mand management. In recent years, public author-
ities have broadened their focus from demand man-
agement policies that target individuals and house-
holds (which are a largely heterogeneous and disag-
gregated policy target) to demand management poli-
cies that target large traffic generators - including the
public and private sectors.
1
https://airbreakferrara.net/
Mobility is likely to be a valuable application area
as the impacts on environment, climate, and land
use are beyond the current generation, as it requires
paradigm shifting decisions at the level of individuals
(i.e., behavioural change) and decision-makers (i.e.,
policies and the use of resources).
According to (Hiselius and Rosqvist, 2016)
changes in attitudes and social norms are required to
promote new methods of applying technological so-
lutions and new behaviors and lifestyles in the transi-
tion to a low-carbon society. Mobility Management
initiatives have been proved to help people change
their minds, but they have yet to be acknowledged
as crucial components of a comprehensive transporta-
tion policy strategy.
Now, Covid-19 is generating a rapid change in the
way people work, act, and move, which could pave
the way for more change in transportation behavior
(TEI, 2021; Bergantino et al., 2021; Scorrano and
Danielis, 2021). This means that hard work will be
needed to shape the new behaviors that will form in
the future.
Positively transforming the way people travel for
the benefit of society requires a profound transforma-
tion of habits and behaviors, which must be based on
comprehensive impact assessments and simulations
that consider social, health, environmental and cli-
mate impacts, as well as economic impacts.
Within the AIR-BREAK project, behaviour
change and awareness raising campaigns have the
aim to inform citizens’ and raise their awareness on
the possibilities and advantages offered by the avail-
able sustainable mobility services and to encourage
the adoption of different, more sustainable, mobility
habits.
BIKE2WORK is one of the initiatives in this direc-
tion with the goal to promote an approach to mobility
oriented to workers able to support the company Mo-
bility Manager in the promotion of sustainable mobil-
ity and transport demand management by analyzing
the problems, needs and habits of workers, Covid-19
measures adopted by companies, trying to orient them
towards new habits of sustainable transport.
BIKE2WORK, leveraging on behavioral change,
technologies, and business model, intends to act on
the decisive factors that hinder modal shift by pro-
viding services, information, recommendations, and
incentives:
• To support companies in adopting policies and
initiatives to plan and implement actions and mea-
sures to identify the most sustainable mobility so-
lution.
• To encourage workers to significantly change
their mobility habits, making them active partic-
SMARTGREENS 2022 - 11th International Conference on Smart Cities and Green ICT Systems
148

ipants in the solution.
In the rest of the paper, we describe the
BIKE2WORK objectives, how it has been realized, and
the major findings after the first set of experiments.
3 BIKE2WORK OBJECTIVES,
FEATURES, AND
MANAGEMENT
The overall objective of BIKE2WORK is to promote
a more sustainable home–work mobility, contributing
to the reduction of CO2 emissions. Considering the
emergency related to COVID-19 this aspect becomes
even more important as new habits will have to be
re–invented to adapt to the new constraints and lim-
itations imposed by the government for the safety of
citizens to improve, at the same time, the quality of
life of employees.
The adoption of technological solutions alone can-
not make transport more sustainable; to do so it
is necessary to involve people and guide them to-
wards a behavioural change. To achieve these goals,
BIKE2WORK intends to engage companies with its
employees to build new innovative, sustainable, and
targeted solutions that can improve quality of life
more effectively.
The specific objectives of this initiative are:
• To support workers in switching to sustainable
mobility habits resulting in reduced CO2 emis-
sions.
• To support public/private companies in the adop-
tion of policies, initiatives, and the development
of urban mobility plans.
• To increase the perception of corporate (eco-
logical) Social Responsibility and improve Total
Quality Management (TQM) within companies.
• To increase cooperation between different modes
of transport and promote interconnection and
interoperability between existing transport net-
works.
• To increase the attractiveness of sustainable trans-
port modes through the implementation of differ-
ent measures such as proposing new private mo-
bility policies, promoting public transport, and
pooling and sharing services.
Ferrara
2
(IT) is a medium-sized city located be-
tween Bologna and Venice, along the Po river, with an
overall number of inhabitants of 131,000 distributed
2
https://www.comune.fe.it/
in an area of 400 Km
2
. The town has broad streets
and numerous palaces dating from the Renaissance,
when it hosted the court of the House of Este. More-
over, Ferrara is a pretty flat city where weather con-
ditions that are never particularly impactful. For its
beauty and cultural importance, it has been designated
by UNESCO as a World Heritage Site. The munici-
pal administration of Ferrara, through the signing of
a Memorandum of Understanding with the Emilia–
Romagna Region
3
, promoter, and financier of the ini-
tiative, has launched in Ferrara the BIKE2WORK cam-
paign for public or private companies based in the city
of Ferrara.
The campaign is part of the sustainable mobility
initiatives put in place to meet the new challenges of
the Covid-19 emergency and wants to promote the
use of bicycles for home–work trips by providing an
economic incentive to employees of public or private
companies in the Municipality of Ferrara. The needs
related to social distancing have, in fact, imposed a
drastic downsizing of public transport capacity, mak-
ing it particularly relevant to encourage the use of bi-
cycles and other modes of private transport with low
environmental impact.
BIKE2WORK provides incentives for sustainable
mobility through an economic contribution for work-
ers who are committed to using bicycles for home–
work trips. Public/private companies of the Munici-
pality of Ferrara can join. Employees of participat-
ing companies are rewarded for their home–work trips
by bike with economic incentives in their paychecks
(0.20 C per Km, max 50 C per month, max 20 km
per day). Mobility managers and employees are sup-
ported by a software platform and a mobile app, as de-
scribed in Section 4, and the overall campaign partici-
pation is supported by a specific life–cycle depicted in
Figure 1. Each interested company provides (in STEP
01) the following information: (a) all the company
data, and (b) the list of MMs with their related infor-
mation. After that, in STEP 02 each company speci-
fies the details of the headquarters that will participate
in the BIKE2WORK campaign with the declaration of
closure days (e.g., holidays). STEP 03 is dedicated
to the insertion of the employee’s data that will be in-
vited/engaged by the MM during STEP 04. In this
phase the MM sends an email to each participating
employee. In this email each employee receives:
• The presentation of the campaign with the relative
regulations and information regarding data pro-
cessing and privacy.
• The instructions to perform the registration to the
campaign and to download the software applica-
3
https://www.regione.emilia-romagna.it/
BIKE2WORK: A Shift Towards Sustainable Mobility
149

Figure 1: BIKE2WORK participation lifecycle.
tion needed to participate.
As soon as an employee accepts the invitation to
participate to the BIKE2WORK campaign and the reg-
istration is done, he/she can start tracking the home–
to–work and work–to–home bike journeys (STEP
05). Finally, STEP 06 is used to manage the em-
ployees’ performance and reward them with the cor-
responding amount.
4 THE BIKE2WORK SUPPORTING
TOOL
The life-cycle and all the features presented in the
previous Section have been used to guide the imple-
mentation of the Play&Go Aziende Framework. It
is an innovative ICT solution that provides a console
of data, information, recommendations, and simula-
tions for MM to assess, also through what-if analysis,
the environmental impact of employee commuting, to
evaluate changes because of specific measures and ac-
tions and to plan optimal and sustainable worker mo-
bility strategies.
To achieve the identified objectives, Play&Go
Aziende provides:
• A web console
4
- for the company MM to man-
age the necessary information (entity data, partic-
ipating employees) and to visualize the informa-
tion (trips/valid kilometers) of their employees.
The web console allows each company to con-
figure and manage all the information related to
their company and employees participating in the
BIKE2WORK campaign.
4
http://admin.playngo.it
• The Ferrara Play&Go Mobile App
5, 6
- for
the employees, which allows them to track their
home–to–work trips and to visualize the achieved
results.
4.1 Web Console
The web console allows each company to configure
and manage all information related to their company
and employees participating in the BIKE2WORK cam-
paign. It is a tool addressed to the appointed com-
pany manager (Mobility Manager) who is in close
contact with the campaign promoter (i.e., Municipal-
ity of Ferrara) before, during and after the execu-
tion of the initiative. Each MM can access a dedi-
cated web console with the received credentials. Ac-
cess can be done via the following console link https:
//admin.playngo.it. Once logged-in a MM can spec-
ify and modify the data useful for the validation of
the journeys of their employees. In particular he/she
can specify the data related to the company (address,
latitude, longitude as depicted in Figure 2(a)), the
non-working days and the days when the company is
closed (e.g. holidays) as depicted in Figure 2(b).
Once the company information has been defined,
the MM can start to insert the data related to the var-
ious headquarters involved and the related employees
that have expressed the interest to participate to the
BIKE2WORK campaign. A MM can insert these info
in a massive way through a file importing method (i.e.
CSV) or can add new headquarters and the related
employees manually through a dedicated form (as de-
picted in Figure 3).
5
https://play.google.com/store/apps/details?id=it.
smartcommunitylab.playgoferrara,
6
https://apps.apple.com/us/app/id1526145980
SMARTGREENS 2022 - 11th International Conference on Smart Cities and Green ICT Systems
150
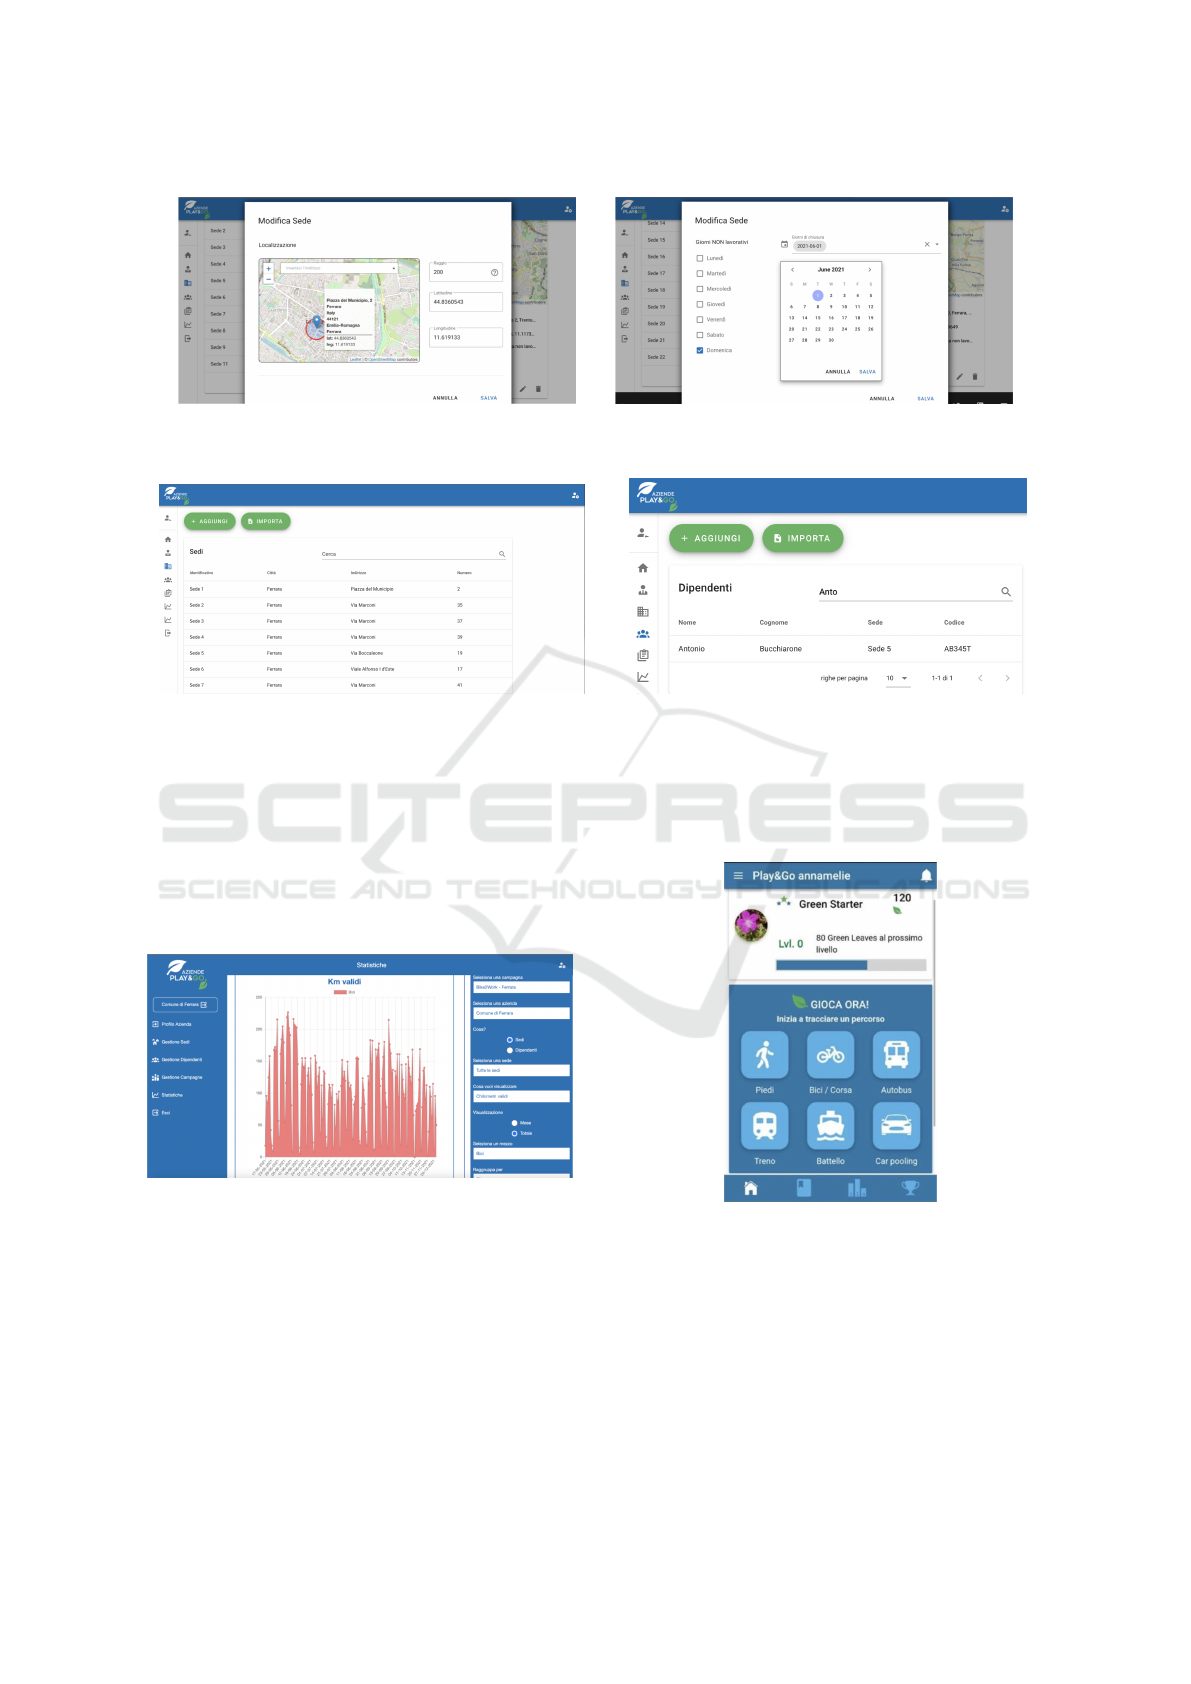
(a) Company Information. (b) Non-Working days declaration.
Figure 2: Web Console UI for Mobility Managers.
(a) Involved Headquarters. (b) Involved Employees.
Figure 3: Headquarters and Employees Data Definition.
As soon as all the needed company information
has been inserted in the console, each MM can de-
clare the interest to start the BIKE2WORK campaign.
It is from this moment that all the employees listed by
the MM can start to track their bike journeys and ac-
cumulate valid trips and kilometers using the Ferrara
Play&Go mobile app (see Section 4.2 for details).
Figure 4: BIKE2WORK statistics.
The last feature that a MM can use in the con-
sole is related to the campaign “Statistics”. The ob-
jective of this functionality is to filter and visualize
the information necessary to understand the progress
of the initiative and at the same time to export ded-
icated reports in CSV format for further analysis by
the company. It is possible to visualize aggregated
information about the trips and kilometers made by
the different employees, of the different headquarters,
etc.., eventually also choosing the interested period
(monthly, global) using a filter component (see Fig-
ure 4).
Figure 5: Home Page.
4.2 Ferrara Play&Go Mobile App
The functionalities supported by the Ferrara Play&Go
Mobile App concern the employee’s registration and
the management of the employee’s profile, the track-
ing of sustainable trips, the inspection of employee’s
results (e.g., points earned, badges and badge col-
lections, active challenges with completion status,
BIKE2WORK: A Shift Towards Sustainable Mobility
151
weekly and global leader boards ranking, personal
mobility diary), information on weekly and global
prizes, as well as the access to game rules and reg-
ulation. The application provides a homepage (see
Figure 5) , in which a summary of the employee’s
state is presented. The homepage also presents a set
of frequent and immediate actions that the user can
perform, e.g., trips tracking.
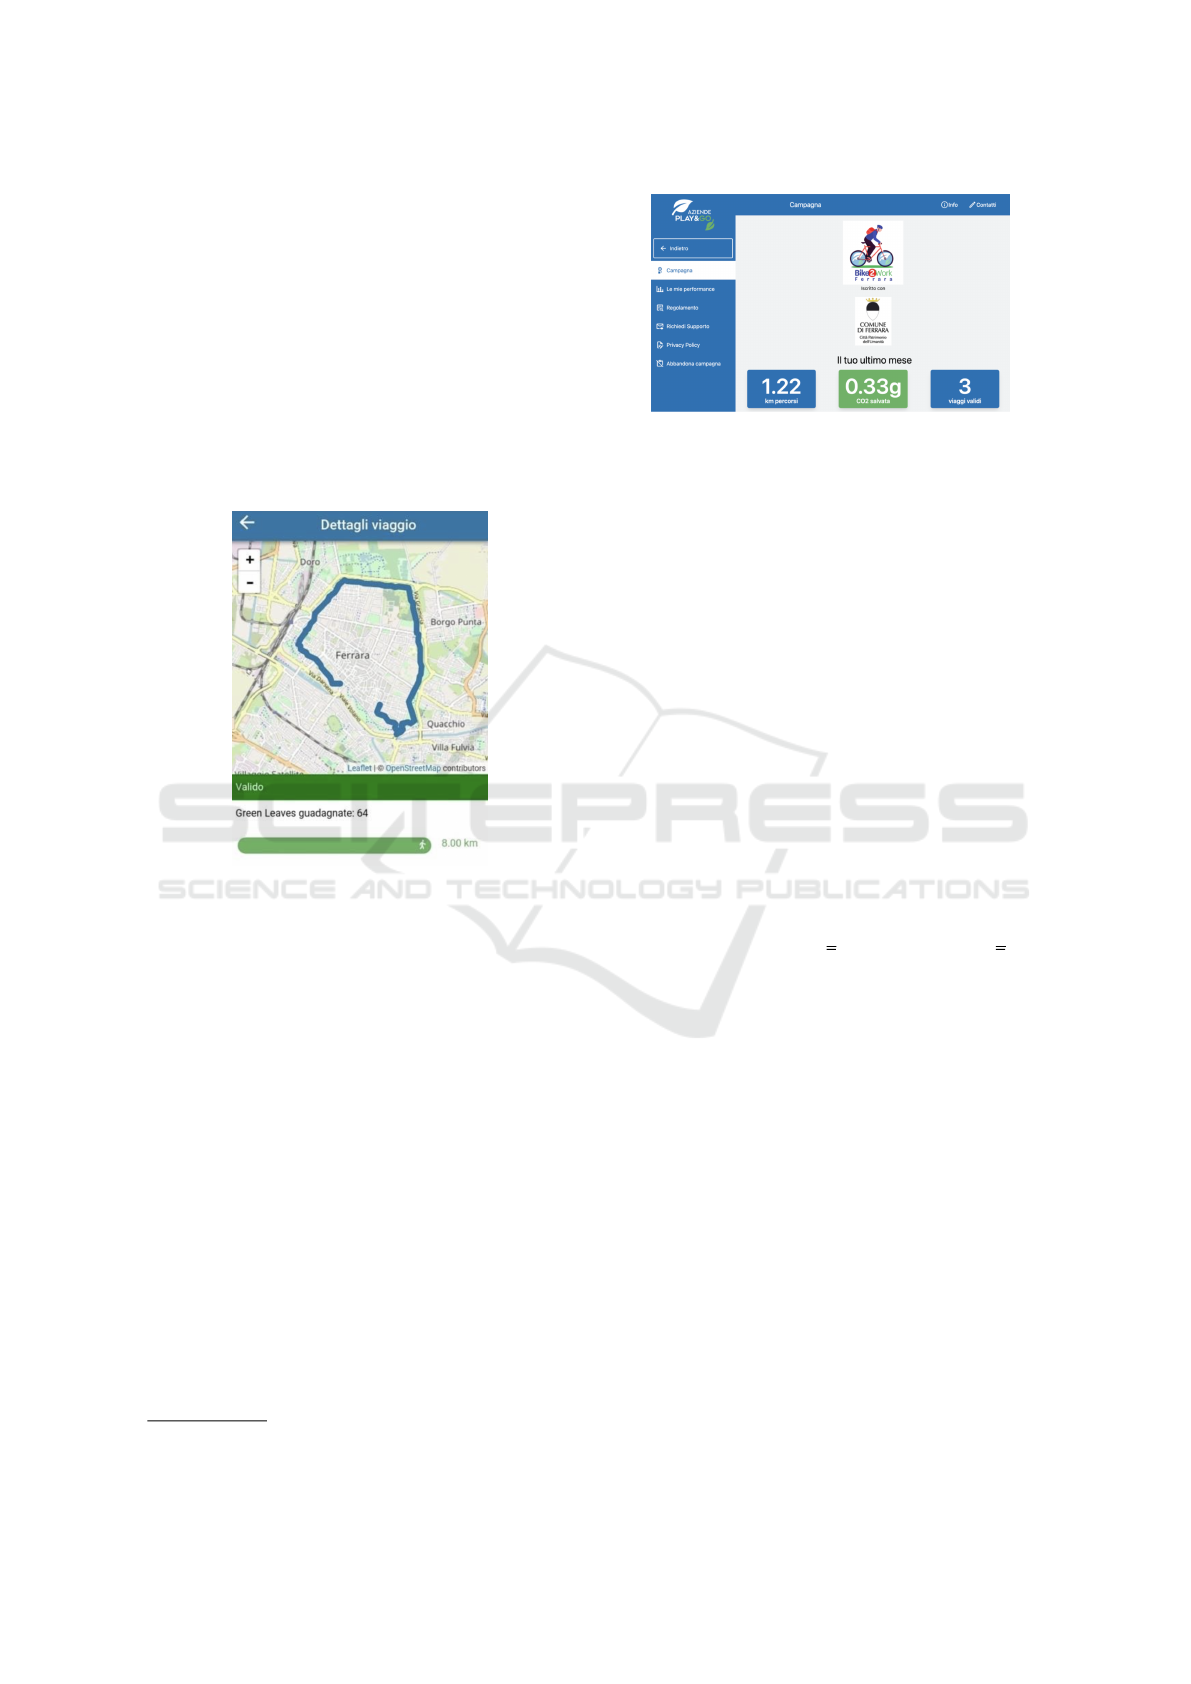
In the BIKE2WORK campaign, employees can
track trips by bike and can visualize the trips on a real-
world map (see Figure 6), both in real-time while they
are recording them during their journey, and for past
trips stored in their profile.
Figure 6: Trip tracking view.
Each employee who has joined the
BIKE2WORK campaign can directly enter in a
dedicated area (see Figure 7) where she/he can
monitor her/his progress in the campaign. Access to
this private area can take place directly through the
Ferrara Play&Go App through a dedicated web link
7
.
The main objective of this area is to show to each
employee her/his behavior regarding home–to–work
mobility. For this reason, it is possible to visualize
dedicated information on the Km traveled, the CO2
saved and the number of valid trips. Moreover, each
employee can consult the BIKE2WORK campaign
regulations, the privacy information document, and
any news dedicated to the campaign in execution.
To validate the bike journeys done to reach the
work locations by the employees, the mobile app ex-
ploits a dedicated trip Validation component. The
validation algorithm implemented by this component
uses the trace coordinates, deriving the information
about the user speed and using that for validation
(e.g., max limits, average speed, etc.). Furthermore,
7
https://aziende.playngo.it/
Figure 7: Employee Dedicated Area.
the algorithm can be configured, depending on the ap-
plication setting, to also consider some additional in-
formation to ”certify” the tracked data. For example,
in the case of the BIKE2WORK campaign, the employ-
ees are assigned to a specific set of company head-
quarters that he/she could reach every working day.
The trip validation component checks if each single
journey starts or arrives from/to one of the declared
locations in this set and if the trip is performed within
a company working day. If the trip validation compo-
nent considers the trip valid, the corresponding em-
ployee action is sent to the Gamification Engine com-
ponent that updates the employee state correspond-
ingly. Otherwise, the Trip Validation component pro-
vides a specific motivation for not considering the trip
valid (e.g., too fast). The validity outcome, in case of
a valid trip, or the motivation explanation, in case of
an invalid trip, is presented to the employee in the mo-
bile App. Finally, employees of participating compa-
nies to the BIKE2WORK campaign are rewarded for
their home–to–work trips with economic incentives
in their paychecks (0.20 C per Km, max 50 C per
month, max 20 km per day).
5 EXPERIMENTAL RESULTS
In this Section we present the preliminary results
of the BIKE2WORK sustainable mobility campaign
which have been obtained through the data collected
from the Ferrara Play&Go Mobile App and the MM
Web console.
The campaign was launched on May 15, 2021 and
it is still running. At the end of December 2021, 55
companies, in the territory of the municipality of Fer-
rara, were registered to the campaign with 537 active
employees. In this first period 24.491 sustainable
trips have been tracked and considered valid. These
trips have contributed to obtain 93.542 sustainable
Kms and 15 Tons of CO2 saved.
Figure 8 shows the distributions of trip total
distances (in Kilometers) while Figure 9 the dura-
SMARTGREENS 2022 - 11th International Conference on Smart Cities and Green ICT Systems
152
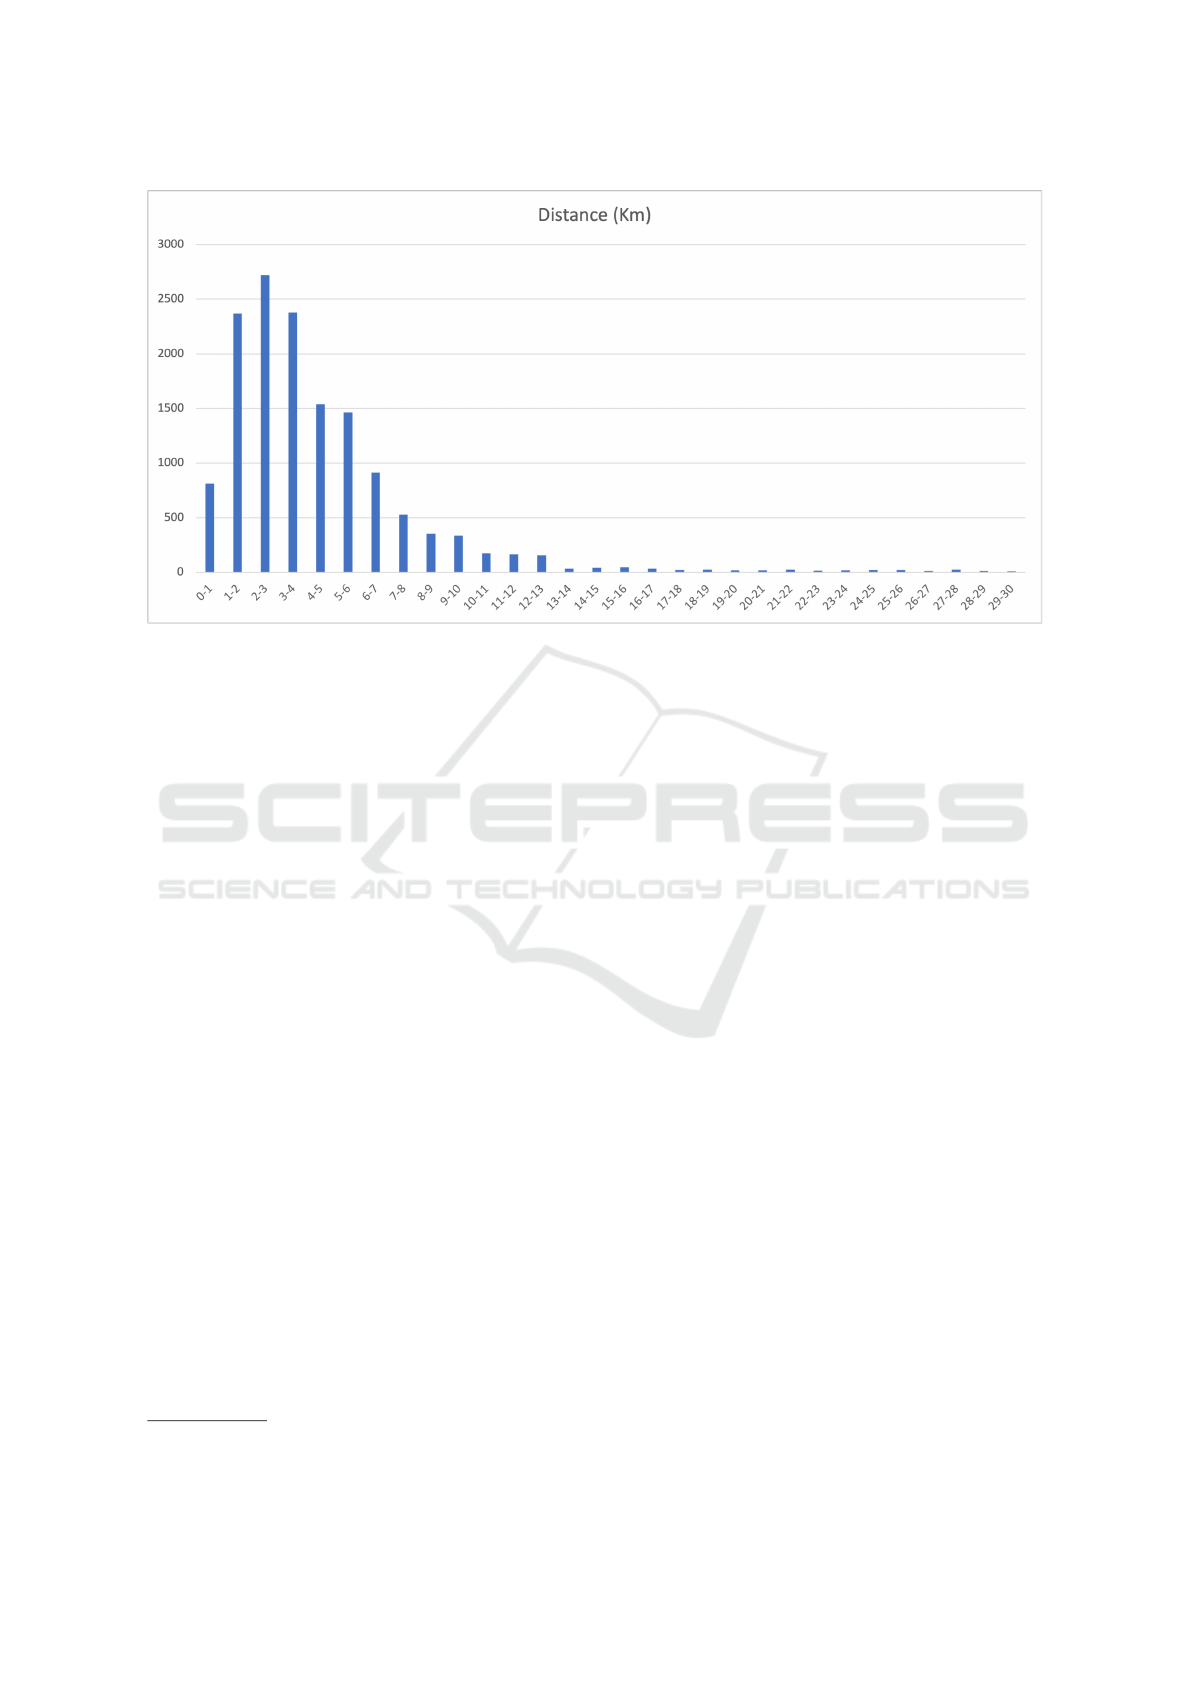
Figure 8: Distribution of the BIKE 2WORK trip distances.
tion (in minutes) for the whole set of trips of the
BIKE2WORK campaign. The most frequent trips are
shown to be the ones lasting between 10 to 20 minutes
and the ones covering a distance of 2-3 Km, while the
average ride duration is 35 minutes for an average dis-
tance of 5 Km.
Taking 20 Km/h as a reference for standard
urban cycling speed we could therefore say that
BIKE2WORK commuters on average do not rush to
work, but rather enjoy their ride.
To analyse the BIKE2WORK impact, different mo-
bility data analytics have been implemented. In par-
ticular, an ingestion procedure has been developed to
get anonymixed raw GPS data from Ferrara Play&Go
(depicted in Figure 10), followed by a map-matching
algorithm that reconstructs each trip from the raw
GPS logs using the OpenStreetMap
8
road network.
Generally speaking, a map-matching algorithm
(Quddus et al., 2007) is an automatized procedure that
combines measures from one or more positioning de-
vices with data from a road network map to provide
an enhanced positioning output. This task is usually
not straightforward because of the combined effect of
measurement errors in positioning data and accuracy
errors in road network data. The map-matching pro-
cedure exploited (Giovannini, 2011), in the context of
the BIKE2WORK campaign, handles the positioning
uncertainties adopting a bayesian approach of max-
imum likelihood; the data are projected on the road
segments that have the higher probabilities of having
generated them.
The overall procedure can be divided in differ-
8
https://www.openstreetmap.org/
ent phases. Before the actual map-matching of GPS
trajectories takes place, some initialization operations
are performed to speed up the following elaborations:
road network data for the area are loaded in memory
and a road proximity map is created. This proximity
map allows for a fast identification of the road arcs
that are close to every given spatial position inside the
area.
Once the initialization step is completed, the map-
matching can start. First of all, the data from each
bike trip goes through a trajectory aggregation stage,
that serves the purpose of removing useless data and
aggregating useful GPS data into trajectories. Then,
GPS trajectories are processed in sequence through
the two last steps of the procedure: the projection of
GPS data onto the surrounding road elements and the
identification of the optimal path between projected
data. A typical map-matching case is presented Fig-
ure 11: the red triangles identify single GPS data
records (in this case very distant from each other); the
blue line, connecting the GPS data into a sequence,
represents a GPS trajectory; the yellow line describes
a possible reconstruction of the path followed.
Another set of automatic procedures calculates
different indicators at single road segment, by times-
tamp. These procedures are though to provide practi-
cal and easy answer to typical use cases:
• What are the most used routes within the city?
• Do they match infrastructures for bikers and
pedestrians?
• What are the critical points for cyclist/pedestrian
BIKE2WORK: A Shift Towards Sustainable Mobility
153
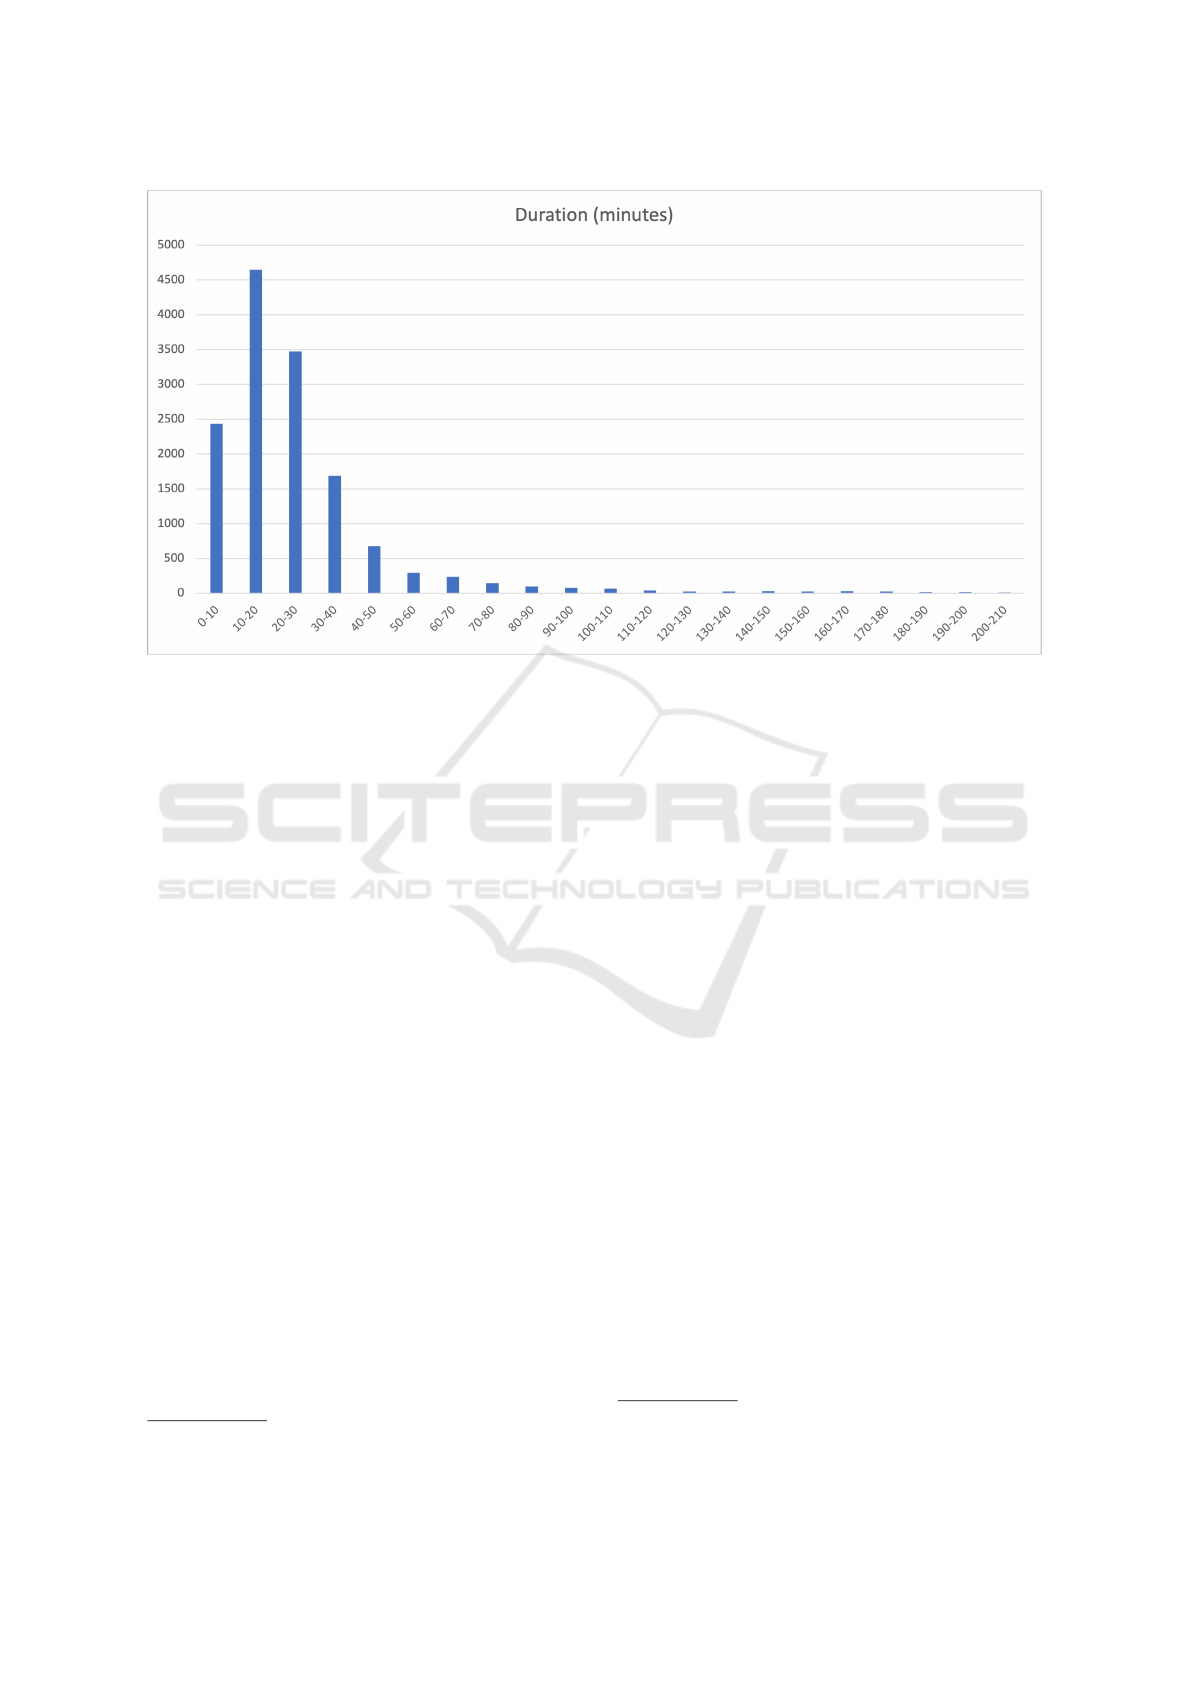
Figure 9: Distribution of the BIKE 2WORK trips durations.
safety?
• Where are cyclists riding the wrong way?
To showcase the results, different map applica-
tions have been deployed for sharing data. Interactive
web maps are based on a set of open-source Javascript
library (OpenLayers
9
)) for displaying spatial data in
web browsers as slippy maps, similar to Google Maps
and OpenStreetMap.
Based on GPS logs, different spatio–temporal in-
dicators have been developed. The map in Figure
12 shows where are the streets mostly used by the
BIKE2WORK participants in Ferrara, from May 2021
until end of December 2021. In the map, the two ma-
jor findings are highlighted in blue colour:
• Corso Giovecca, which cuts the city centre from
east to west and which in the western part is lack-
ing dedicated cycle lanes despite being very pop-
ular (see the the blue ellipse with label A in Figure
12).
• The new cycle lane, opened in early 2021, that
leads from the center to the hospital of Ferrara in
Cona village (located to the east) and which ap-
pears to be widely used by commuters working
at AUSL and University ((see the the blue ellipse
with label B in Figure 12).
To make the results of this initiative continu-
ously available, an interactive map has also been
9
https://openlayers.org/
made available online
10
. The map can be browsed
(zoom/pan) and queried: by clicking on a street seg-
ment, user gets information about number of transits
in the specific street segment, divided by weekday and
weekend (total number of transits and daily average).
6 CONCLUSIONS AND FUTURE
WORK
With this work, we present a home-to-work sustain-
able mobility campaign (BIKE2WORK ) defined and
executed in the context of the AIR–BREAK project.
It targets employees of public and private companies
and has the goal to promote the use of bicycles to
move in a sustainable way by providing economic in-
centives. We present the software platform, the mo-
bile app, and the interactive web maps, that have been
implemented to support the Mobility Managers and
the employees throughout the campaign and to un-
derstand the progress and the impact of the running
initiative. After the first 8 Months of campaign’s ex-
ecution, some initial results have been obtained and
reported. We will continue running the campaign for
the next two years (till December 2023). Future works
will be focused on a thorough and systematic analysis
of the quantitative and qualitative data we collected,
both in terms of the achieved environmental impact
and in terms of user experience.
10
http://metropolidipaesaggio.it/progetti-pilota/
mappa-tragitti-cittadini/
SMARTGREENS 2022 - 11th International Conference on Smart Cities and Green ICT Systems
154
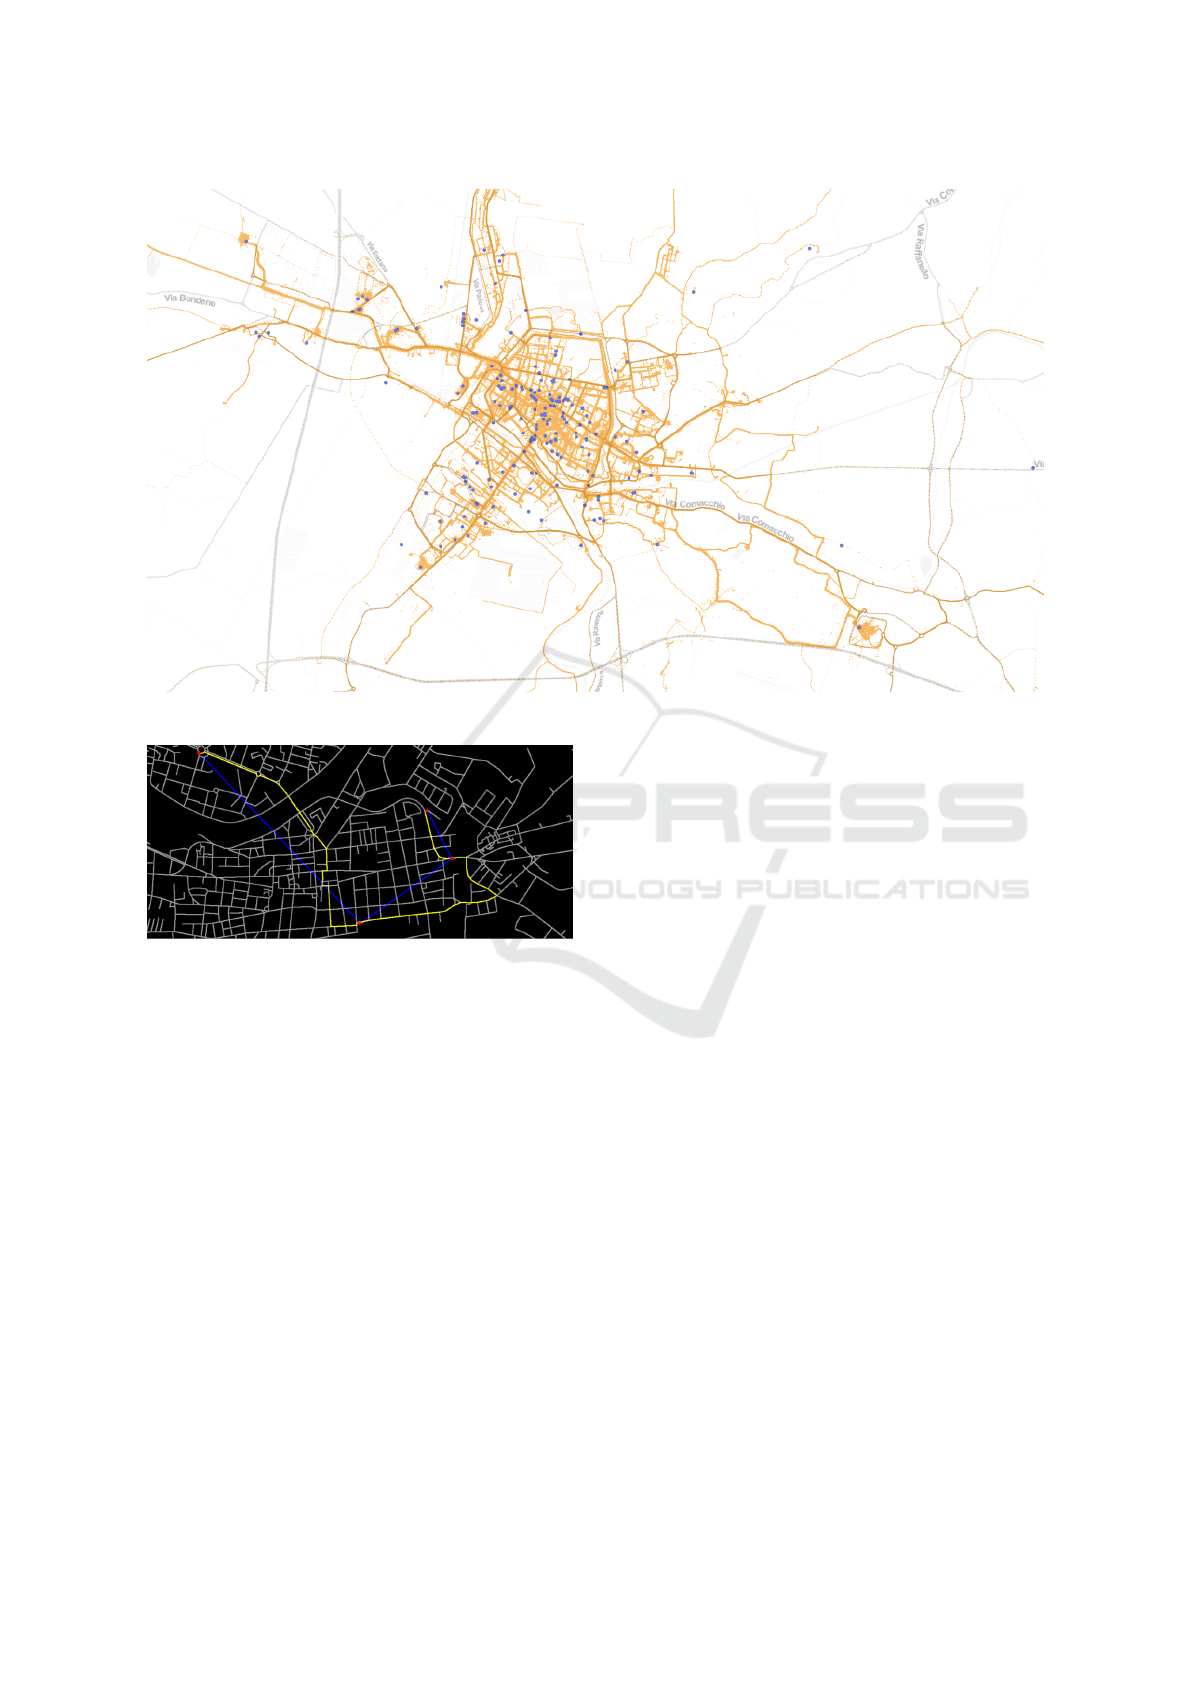
Figure 10: GPS logs (in orange) and companies locations (in blue) from Ferrara Play&Go.
Figure 11: A typical map-matching case.
ACKNOWLEDGEMENTS
This work is supported by the AIR-BREAK project
funded through the ERDF Urban Innovation Actions
2020 UIA 05-177.
REFERENCES
(2020). Chapter 14 - behavioral interventions for sus-
tainable transportation: an overview of programs and
guide for practitioners. In Zhang, J., editor, Transport
and Energy Research, pages 315–371. Elsevier.
(2021). The motivations for using bike sharing during
the covid-19 pandemic: Insights from lisbon. Trans-
portation Research Part F: Traffic Psychology and Be-
haviour, 82:378–399.
Al-Thawadi, F. E., Banawi, A.-A. A., and Al-Ghamdi, S. G.
(2021). Social impact assessment towards sustain-
able urban mobility in qatar: Understanding behav-
ioral change triggers. Transportation Research Inter-
disciplinary Perspectives, 9:100295.
Anagnostopoulou, E., Urbancic, J., Bothos, E., Magoutas,
B., Bradesko, L., Schrammel, J., and Mentzas, G.
(2020). From mobility patterns to behavioural change:
leveraging travel behaviour and personality profiles
to nudge for sustainable transportation. J. Intell. Inf.
Syst., 54(1):157–178.
Badii, C., Bellini, P., Cenni, D., Difino, A., Paolucci, M.,
and Nesi, P. (2017). User engagement engine for smart
city strategies. In 2017 IEEE International Confer-
ence on Smart Computing (SMARTCOMP), pages 1–
7.
Bergantino, A. S., Intini, M., and Tangari, L. (2021). In-
fluencing factors for potential bike-sharing users: an
empirical analysis during the covid-19 pandemic. Re-
search in Transportation Economics, 86:101028.
Cruz, S. S. and Paulino, S. R. (2021). Experiences of inno-
vation in public services for sustainable urban mobil-
ity. Journal of Urban Management.
Gallo, M. and Marinelli, M. (2020). Sustainable mobility:
A review of possible actions and policies. Sustainabil-
ity, 12(18).
Gartner, T., Titov, W., and Schlegel, T. (2021). Identifying
mobility pattern of specific user types based on mo-
bility data. In Stephanidis, C., Antona, M., and Ntoa,
S., editors, 23rd HCI International Conference, HCII
2021, volume 1498 of Communications in Computer
and Information Science, pages 527–534. Springer.
Giesecke, R., Surakka, T., and Hakonen, M. (2016). Con-
ceptualising mobility as a service. In 2016 Eleventh
International Conference on Ecological Vehicles and
Renewable Energies (EVER), pages 1–11.
BIKE2WORK: A Shift Towards Sustainable Mobility
155
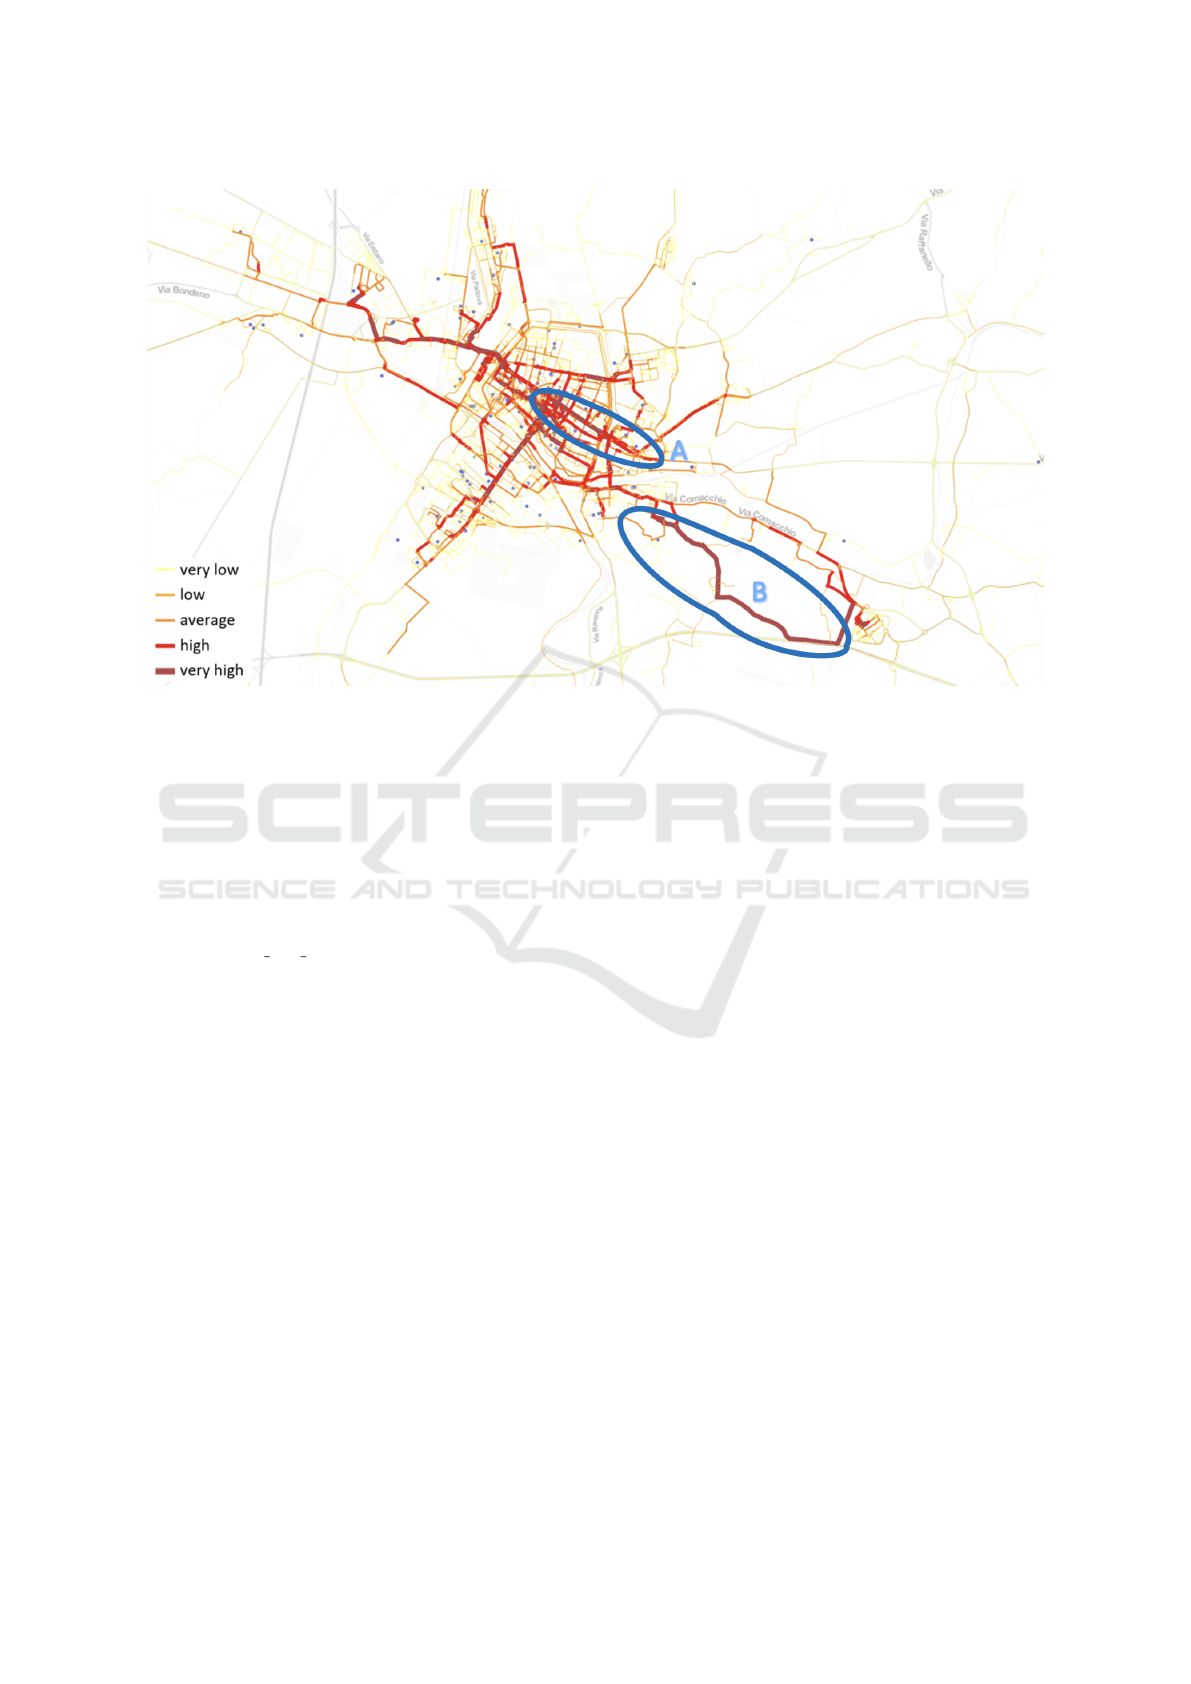
Figure 12: Map of BIKE2WORK commuters in Ferrara (at December 2021).
Giffinger, R. (2019). Smart city: The importance of inno-
vation and planning. In 8th International Conference,
SMARTGREENS 2019, volume 1217 of Communica-
tions in Computer and Information Science, pages 28–
39. Springer.
Giovannini, L. (2011). A Novel Map-Matching Pro-
cedure for Low-Sampling GPS Data with Ap-
plications to Traffic Flow Analysis. PhD dis-
sertation, Alma Mater Studiorum - Universit
´
a
di Bologna. http://amsdottorato.unibo.it/3898/1/
giovannini luca tesi.pdf.
Haarstad, H. (2017). Constructing the sustainable city: ex-
amining the role of sustainability in the ‘smart city’
discourse. Journal of Environmental Policy & Plan-
ning, 19(4):423–437.
Hiselius, L. W. and Rosqvist, L. S. (2016). Mobility man-
agement campaigns as part of the transition towards
changing social norms on sustainable travel behavior.
Journal of Cleaner Production, 123:34–41.
Kazhamiakin, R., Loria, E., Marconi, A., and Scanagatta,
M. (2021). A gamification platform to analyze and
influence citizens’ daily transportation choices. IEEE
Trans. Intell. Transp. Syst., 22(4):2153–2167.
Klecha, L. and Gianni, F. (2018). Designing for sustain-
able urban mobility behaviour: A systematic review
of the literature. In Mealha,
´
O., Divitini, M., and
Rehm, M., editors, Citizen, Territory and Technolo-
gies: Smart Learning Contexts and Practices, pages
137–149, Cham. Springer International Publishing.
K
¨
onig, D., Eckhardt, J., Aapaoja, A., and Sochor,
J.and Karlsson, M. (2016). Business and operator
models for Mobility as a Service (MaaS). Deliverable
3 to the MAASiFiE project, Brussels -Belgium.
Lam, D. and Head, P. (2011). Sustainable urban mobility,
volume 9781447127178.
Lyons, G. (2018). Getting smart about urban mobility
– aligning the paradigms of smart and sustainable.
115:4–14.
Marconi, A., Schiavo, G., Massa, P., Mencarini, E., and
Deppieri, G. (2021). From sustainable mobility to
good deeds: Supporting school participation during
COVID-19 emergency through a playful education
platform. In IDC ’21: Interaction Design and Chil-
dren, Athens, Greece, 24-30 June, 2021, pages 80–86.
ACM.
Quddus, M. A., Ochieng, W. Y., and Noland, R. B. (2007).
Current map-matching algorithms for transport appli-
cations: State-of-the art and future research directions.
Transportation Research Part C-emerging Technolo-
gies, 15:312–328.
Scorrano, M. and Danielis, R. (2021). Active mobility in an
italian city: Mode choice determinants and attitudes
before and during the covid-19 emergency. Research
in Transportation Economics, 86:101031.
Torrisi, V., Garau, C., Ignaccolo, M., and Inturri, G. (2020).
”sustainable urban mobility plans”: Key concepts and
a critical revision on sumps guidelines. In Compu-
tational Science and Its Applications - ICCSA 2020,
volume 12255 of Lecture Notes in Computer Science,
pages 613–628. Springer.
Vesco, A. and Ferrero, F. (2015). Handbook of Research on
Social, Economic, and Environmental Sustainability
in the Development of Smart Cities.
SMARTGREENS 2022 - 11th International Conference on Smart Cities and Green ICT Systems
156
