
Intersection-centric Urban Traffic Flow Clustering for Incident Detection
in Organic Traffic Control
Ingo Thomsen
a
and Sven Tomforde
b
Intelligent Systems, Christian-Albrechts-Universit
¨
at zu Kiel, 24118 Kiel, Germany
Keywords:
Traffic Management, Organic Traffic Control, Traffic Flow Analysis, Traffic Incident Detection.
Abstract:
The current trend of high and even increasing traffic volumes in urban areas is unbroken. This puts high strain
on urban road networks, which is aggravated by unforeseen traffic incidents. To mitigate this, the Organic
Traffic Control offers a resilient, decentralised traffic management system. With the additional ability to
take incidents into under consideration, its performance could increase. To promote this we have previously
presented a density-based approach for clustering traffic flows in order to detect traffic disturbances. In this
work we assess this approach in more detail. However, the fundamental shortcomings could not be refuted.
1 INTRODUCTION
The trend of high volumes of publication transporta-
tion and individual traffic is unbroken. These de-
mands can lead to congestion and subsequent travel
delays as well as additional costs. Up to the year
2020, the Urban Mobility Report (Schrank et al.,
2021) presents increasing “wasted fuel” (3.5 billion)
and hours of travel delay (8.7 billion). And although
these values were roughly halved in 2020 due to the
COVID-19 pandemic, the trends from early 2021 sug-
gest a return of these congestion problems. This
puts high demands on traffic management systems,
as time-dependent volume changes within urban road
networks are aggravated by unforeseen traffic inci-
dents, which impedes the ongoing traffic assessment
and subsequent managing measures. Existing ap-
proaches range from fully centralised to locally act-
ing management systems. Generally, these systems
are reactive towards changes in traffic flows but do
not categorise the type of the underlying disturbance.
Perspectively, this information can be useful to deter-
mine appropriate measures. With the goal of an au-
tomated incident detection and classification, we pre-
sented as a preliminary work a decentralised detec-
tion approach from the viewpoint of intersections. It
is based upon clustering detected traffic flows of ad-
jacent road sections. In this work we expand this con-
cept in several ways: Additional types of traffic inci-
a
https://orcid.org/0000-0002-0850-4786
b
https://orcid.org/0000-0002-5825-8915
dents are taken into account as well as another cluster-
ing algorithm. This is then evaluated in a more com-
plex urban road network with varying traffic demands.
Also, the validation of any detected disturbances has
to solely rely on locally gathered measurements, as
it is to be used in the context of a self-adaptive and
self-organised Organic Traffic Control system.
The remainder of this article is organised as fol-
lows: The next Section 2 gives a brief overview over
urban networks and incident detection in the context
of self-organised traffic control. Section 3 then sum-
marises the traffic network and demand assumptions
as well as the incidents under consideration. Section 4
describes the detection approach with its extension
and Section 5 outlines its evaluation. This is followed
by the presentation of the results in Section 6 and con-
cluded with an outlook and summary in Section 7.
2 BACKGROUND
2.1 Urban Road Networks
Urban networks typically feature intersections – often
equipped with traffic light controllers (TLC) – that are
connected by road sections of varying extent. These
are similar in terms of privilege and do not boast one
main arterial road. The traffic may vary within the
network and during the day (“rush hour”). All this
sets urban networks apart from highways as well as
rural roads and makes incident detection challenging.
410
Thomsen, I. and Tomforde, S.
Intersection-centric Urban Traffic Flow Clustering for Incident Detection in Organic Traffic Control.
DOI: 10.5220/0011085400003191
In Proceedings of the 8th International Conference on Vehicle Technology and Intelligent Transport Systems (VEHITS 2022), pages 410-417
ISBN: 978-989-758-573-9; ISSN: 2184-495X
Copyright
c
2022 by SCITEPRESS – Science and Technology Publications, Lda. All rights reserved
2.2 Traffic Incident Detection
Unforeseen incidents, such as accidents, road block-
ages, or forced speed reductions, often require prompt
management reactions. The efforts to at least partly
automate this go back decades. Research into Auto-
mated Incident Detection (AID) started in the seven-
ties. For example, the California Algorithm (Payne,
1975) uses decision trees and thresholds. Like other
approaches, it relies on induction loop detectors,
which were later used for AID in the context of time-
series analysis (Ahmed and Cook, 1980) or mathe-
matical models for traffic flows (Lin and Daganzo,
1997). More recent approaches also consider other
sensor data, such as video feeds (Shehata et al.,
2008). All these approaches are restricted in some
way, though, be it that they are designed solely for
highways or do not try to assess the type of the under-
lying incident. Furthermore, these are no integrated
traffic solutions which take this information as a basis
for measures or route recommendations.
Our previous work (Thomsen. et al., 2021) pre-
sented a decentralised approach for detection, based
on (simulated) induction loop counts. Traffic flows
derived from these are then clustered to identify sig-
nificant flow changes. It was shown that well pro-
nounced road closures can be detected. In this paper
we present an extended assessment of the approach.
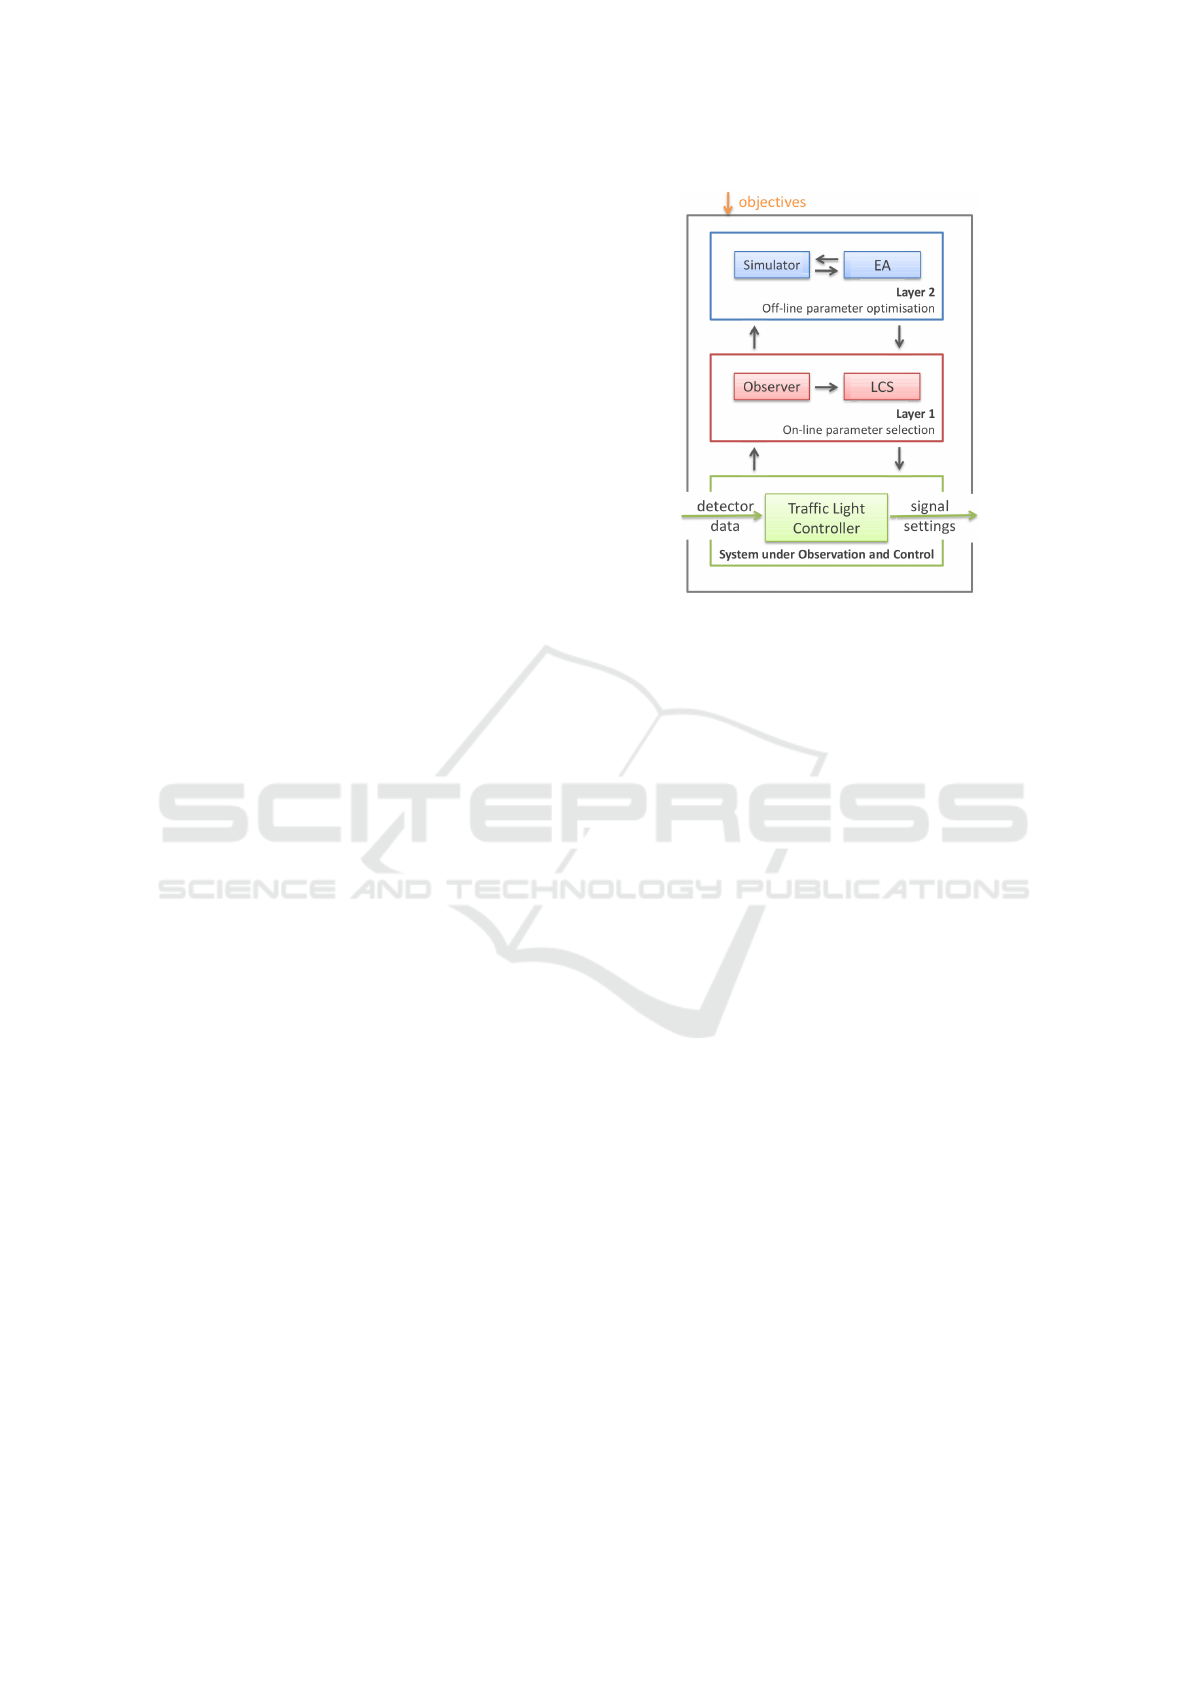
2.3 Organic Traffic Control
An area of application for AID is Organic Traf-
fic Control (OTC) (Prothmann et al., 2009), a self-
adaptive and self-organised traffic management sys-
tem. It follows the principles of Organic Comput-
ing (M
¨
uller-Schloer and Tomforde, 2017): Creation
of technical systems that exhibit “life-like” behaviour,
often by transferring design-time decisions to run-
time. Other methods are Reinforcement Learning,
self adaptation, or applying the Observer/Controller
design pattern. Figure 1 shows the pattern as a multi-
level O/C architecture in OTC. The system offers sev-
eral abilities: Management of traffic light signalisa-
tion, route guidance for drivers as described in (Som-
mer et al., 2016), and formation of progressive signal
systems (“green waves”), here as a decentralised, dis-
tributed approach (Tomforde et al., 2008a).
3 TRAFFIC NETWORK MODEL
The same traffic simulator (Aimsun SLU, 2010) as
with the OTC in Section 2.3 is used to model the
road networks, the traffic demands, and incurring in-
Figure 1: Multilevel OTC architecture from (Tomforde
et al., 2008b): The System under Observation and Con-
trol (SuOC), the rule-based control layer 1 which features a
Learning Classifier System (LCS), and the layer 2 for creat-
ing new rules with the help of evolutionary algorithms (EA).
cidents. For the assessment of the approach several
assumptions are made regarding these elements.
3.1 Simulated Network
As depicted in Figure 2, the regular Manhattan road
network under consideration consists of 21 junctions.
The connecting double-lane sections of 150m each
have a dedicated turning lane for vehicles going to
the left (see Figure 3 for more details) as well as a
detector at the beginning and end of each road sec-
tion. These simulated induction loops count the pass-
ing vehicles per simulation step of 1s. Furthermore,
each incoming road section of a junction is equipped
with a traffic light controllers (TLC), which follow
a phase-based signalisation schedule. These 4 fixed
non-conflicting signal groups – “vertical to left” (10s),
“vertical to right and straight on” (25s), “horizontal to
left” (10s), and “horizontal to right and straight on”
(25s) – are synchronised and the same for all junc-
tions. The outer junctions are connected to centroids
through which the simulated vehicles enter and leave
the network. Our previous work (Thomsen. et al.,
2021) points to a fringe effect, where traffic and the
resulting flow measurements are atypical: Vehicles
randomly enter the network – independent from any
traffic light phase. This would not typically be the
case in an urban road network. Therefore, we only
consider the inner 9 intersections, while the others act
as kind of buffer and enqueue the vehicles into the
“regularly phased traffic”.
Intersection-centric Urban Traffic Flow Clustering for Incident Detection in Organic Traffic Control
411
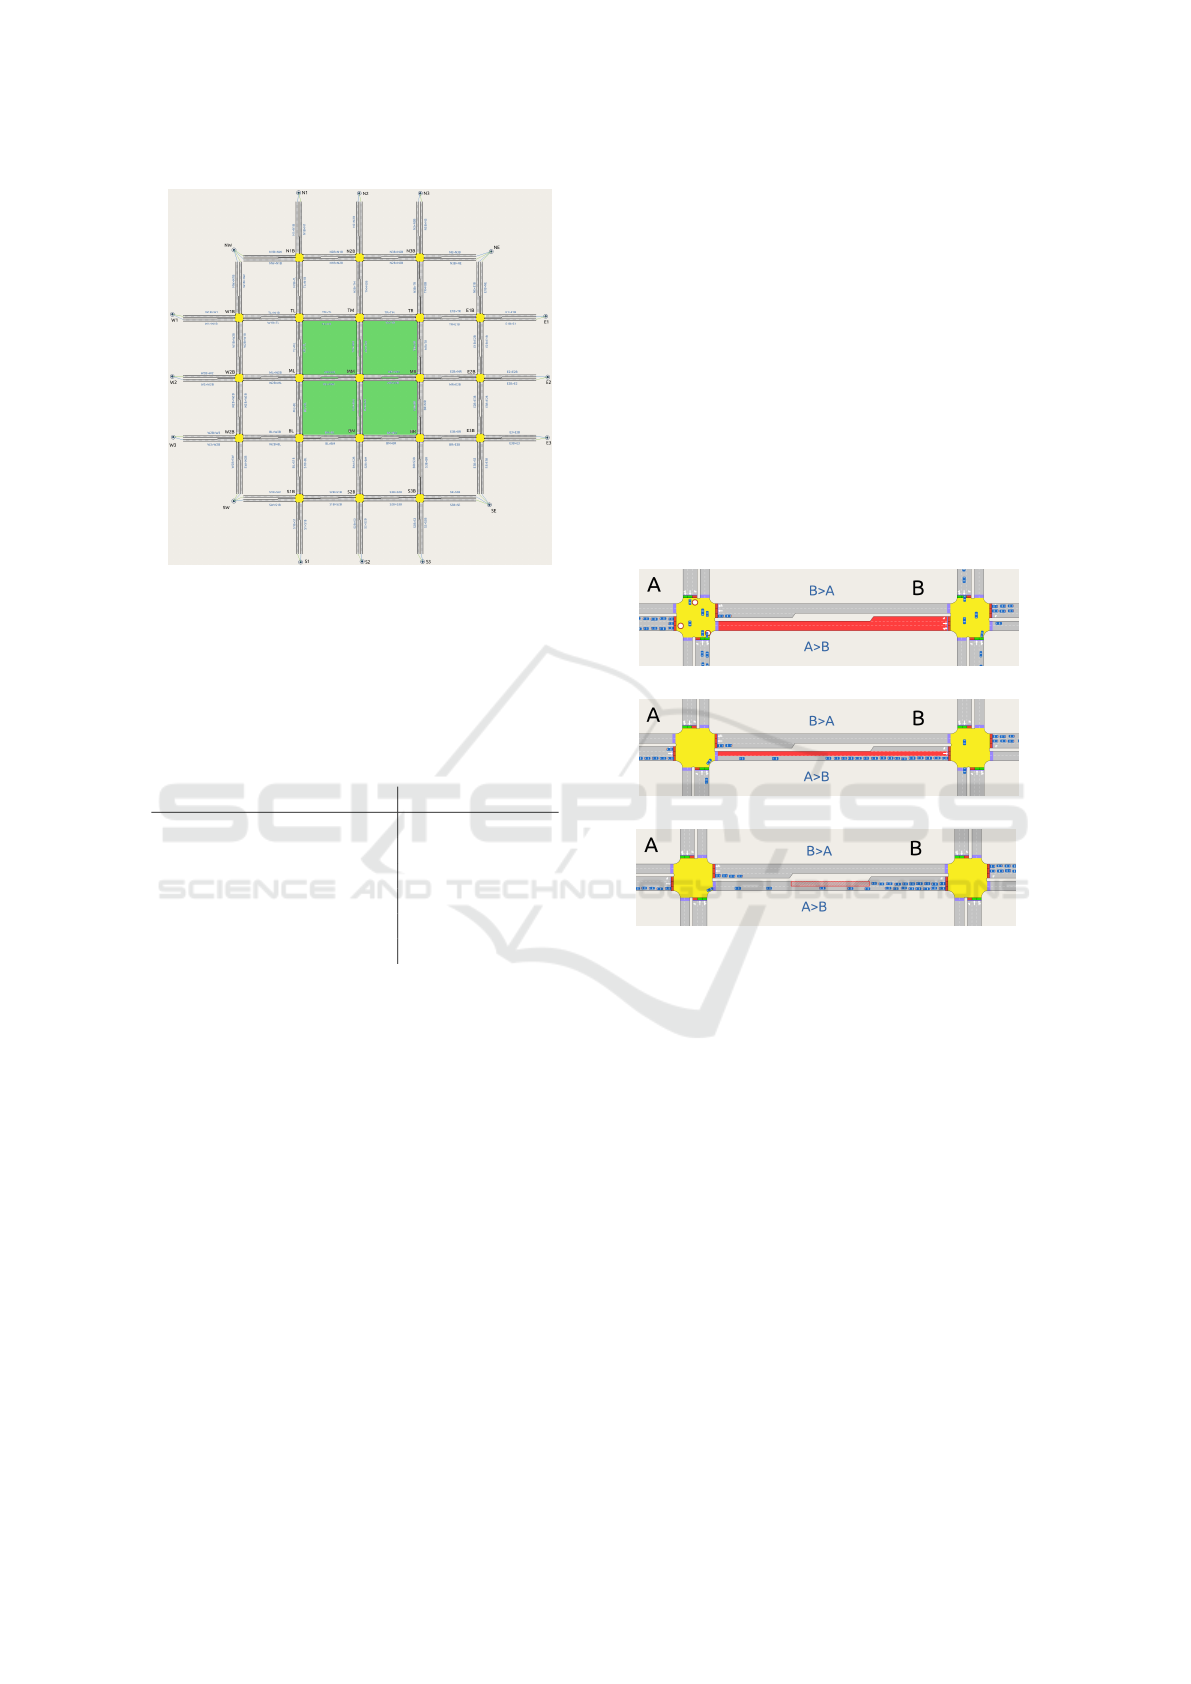
Figure 2: Embedded 3x3 network: The highlighted inner 9
junctions – “top left” (TD) via “middle middle” (MM) to
“bottom right” (BR) – are investigated. The others are con-
nected to the centroids (traffic producer/consumer) and act
as “buffer” so the traffic enters the inner grid synchronised.
Table 1: Normal Traffic Demand of 4000 vehicles/h: A pri-
mary (eastward), a secondary (westward) traffic demand as
well as tertiary demands in both north-south directions and
two low diagonal demands between the corner centroids.
O/D centroids vehicles per hour
W1, W2, W3 → E1, E2, E3 200 each
E1, E2, E3 → W1, W2, W3 100 each
N1, N2, N3 → S1, S2, S3 50 each
S1, S2, S3 → N1, N2, N3 50 each
SW ↔ NE 100
NW ↔ SE 100
3.2 Traffic Demand
A common approach to describe traffic volumes in
road networks are origin-destination (O/D) matrices,
which specify the number of vehicles, that traverse
from each entry point to each exit point. O/D matri-
ces can be layered and/or combined to model complex
and time-variant traffic volumes. The static demand
used in this work is detailed in Table 1. It varies along
the general directions. These primary, secondary, and
tertiary demands enable the simulation of diverse traf-
fic volumes within the road network.
3.3 Incident Types
A traffic incident is a one-time event which alters a
roads capacity and can trigger changes in traffic vol-
umes. It can be characterised in various ways with re-
gard to severity, location and temporal aspects. Here,
we consider three static incidents which are confined
to incoming and outgoing roads. Section 3.3 depicts
how they are modelled using the traffic simulator.
Section Closure. A common incident (e.g. due to an
accident or planned roadworks) is the total block-
age of all lanes of a road in one direction. Vehicles
are then prohibited to enter such a section.
Lane Closure. In road sections with multiple lanes,
one or more lanes can be blocked, while the re-
maining ones can be used normally. Also, to-
wards the end of that section near the junction ve-
hicles might be permitted to cross a blocked lane
to reach a left-turning lane.
Partial Lane Closure. Unlike lane closures, only (a
variable length) of a lane is closed.
Section closure
Lane closure
Partial lane closure
Figure 3: Incidents in a road section from a junction A to B
as simulated in (Aimsun SLU, 2010). In case of the section
closure, the simulation can end up in a deadlock situation,
when after the incident activation, cars already within the
intersection have to change their direction. Therefore, addi-
tional turn closures are activated which prevent in time the
respective cars entering the junction in the first place.
4 DETECTION PROCEDURE
The detection of incidents is intersection-centric and
takes only the adjacent detectors of the “sensor hori-
zon” into account. The traffic flows based on the de-
tector counts are then clustered and used for detection.
4.1 Traffic Flows
The detector counts are collected for each simula-
tion step. As the intersections are also equipped with
TLCs that use a phase-based signalisation schedule,
VEHITS 2022 - 8th International Conference on Vehicle Technology and Intelligent Transport Systems
412

there are obviously times with no detector counts in
each section: red light phases. To compensate for this,
the flow per section is computed with regard to the 90s
duration of the control cycle:
flow =
3600 × counts
90s
4.2 Clustering
Traffic state estimation using sensors results in poten-
tially n-dimensional time series data. Here, we rely
on single detector stations that signalise per-lane oc-
cupancy. Based on that, feature extraction can de-
scribe the time-dependent behaviour and derive sta-
tistical statements. The basic assumption of our work
is that the behaviour of these detector-based time se-
ries responds to different types of incidents.
To turn this into a window-based analysis means
comparing known flow patterns with those that do not
match the already seen behaviour. Technically, we
approach this using clustering: The usual traffic be-
haviour with its different demands is expected to form
re-occurring feature samples in the n-dimensional
state space – while incidents produce significantly dif-
ferent samples. The detection is achieved by finding
structure in the data – those regions that are covered
by more dense observations are grouped together and
newly occurring groups can indicate incidents.
We focus on the distance and density aspect. The
field of unsupervised learning comes with a vari-
ety of different techniques (Xu and Wunsch, 2005;
Hastie et al., 2009) – but for the aspect of distance-
and density-based clustering, OPTICS and DBSCAN
are most commonly applied. They have advan-
tages for high dimensions, unknown number of clus-
ters, uneven cluster shapes and unbalanced data and
are almost parameter-free compared to other solu-
tions (Campello et al., 2020). Both methods are used.
DBSCAN
In line with our previous work, we apply DBSCAN
– Density Based Spatial Clustering of Applications
with Noise (Ester et al., 1996) in conjunction with
the Euclidean measure to calculate the distance be-
tween two points (time/flow values here). DBSCAN
uses this distances to calculate the density of data
points. The method requires only two parameters –
radius ε and minPts – to identify clusters based on
“density-reachability”: The ε-neighbourhood N
p
of a
point p contains all points within that radius. If there
are at least minPts of these points, they are “density-
reachable” and the first of three kinds of points:
core points. directly density-reachable points
density-reachable. points at the edge of a cluster that
are reachable form a core point
noise points. residual points that belong to no cluster
A cluster then contains at least one core point and
all is directly or indirectly reachable points – at least
minPts points in total.
OPTICS
A method closely related to DBSCAN is OPTICS
– Ordering Points To Identify the Clustering Struc-
ture (Ankerst et al., 1999). It requires the same pa-
rameters, although the main effect of selecting ε is to
reduce the algorithm’s complexity.
In contrast to DBSCAN, it aims at processing high
density points first: For each point p, the “core dis-
tance” CD
p
is calculated, which is the minimal radius
to encompass minPts − 1 other points. Furthermore,
the “reachability-distance” of p to another point q is
defined as max(CD
p
,dist(p,q)), with dist being the
real distance between p and q. Starting with a ran-
dom point, OPTICS continuously adds points from
the ε neighbourhood, based on the best reachability-
distance and assembles a cluster. Using this ordering,
it is even possible to find nested clusters.
4.3 Detection
The simulation is assumed not to start with an inci-
dent. A newly appearing cluster of flows is then re-
garded as an incident candidate. As we pursue an
intersection-centric approach in this context, we only
have information about the adjacent sections. Con-
sequently, we cannot rely on the validation strategies
from (Thomsen. et al., 2021), as they require infor-
mation about incidents of sections further away.
5 EVALUATION
The detection approach in Section 4 suggests a con-
siderable effort to determine the clustering settings
manually. Therefore, an automated parameter grid
search was applied. The evaluation of the approach
was mainly conducted using the Scikit-learn frame-
work (Pedregosa et al., 2011). The detector values
from the simulations in Aimsun Next where gathered
using a plug-in which was written for that purpose.
5.1 Incidents
Three representative incidents – a section closure, a
lane closure (left lane closed off), and a partial lane
Intersection-centric Urban Traffic Flow Clustering for Incident Detection in Organic Traffic Control
413
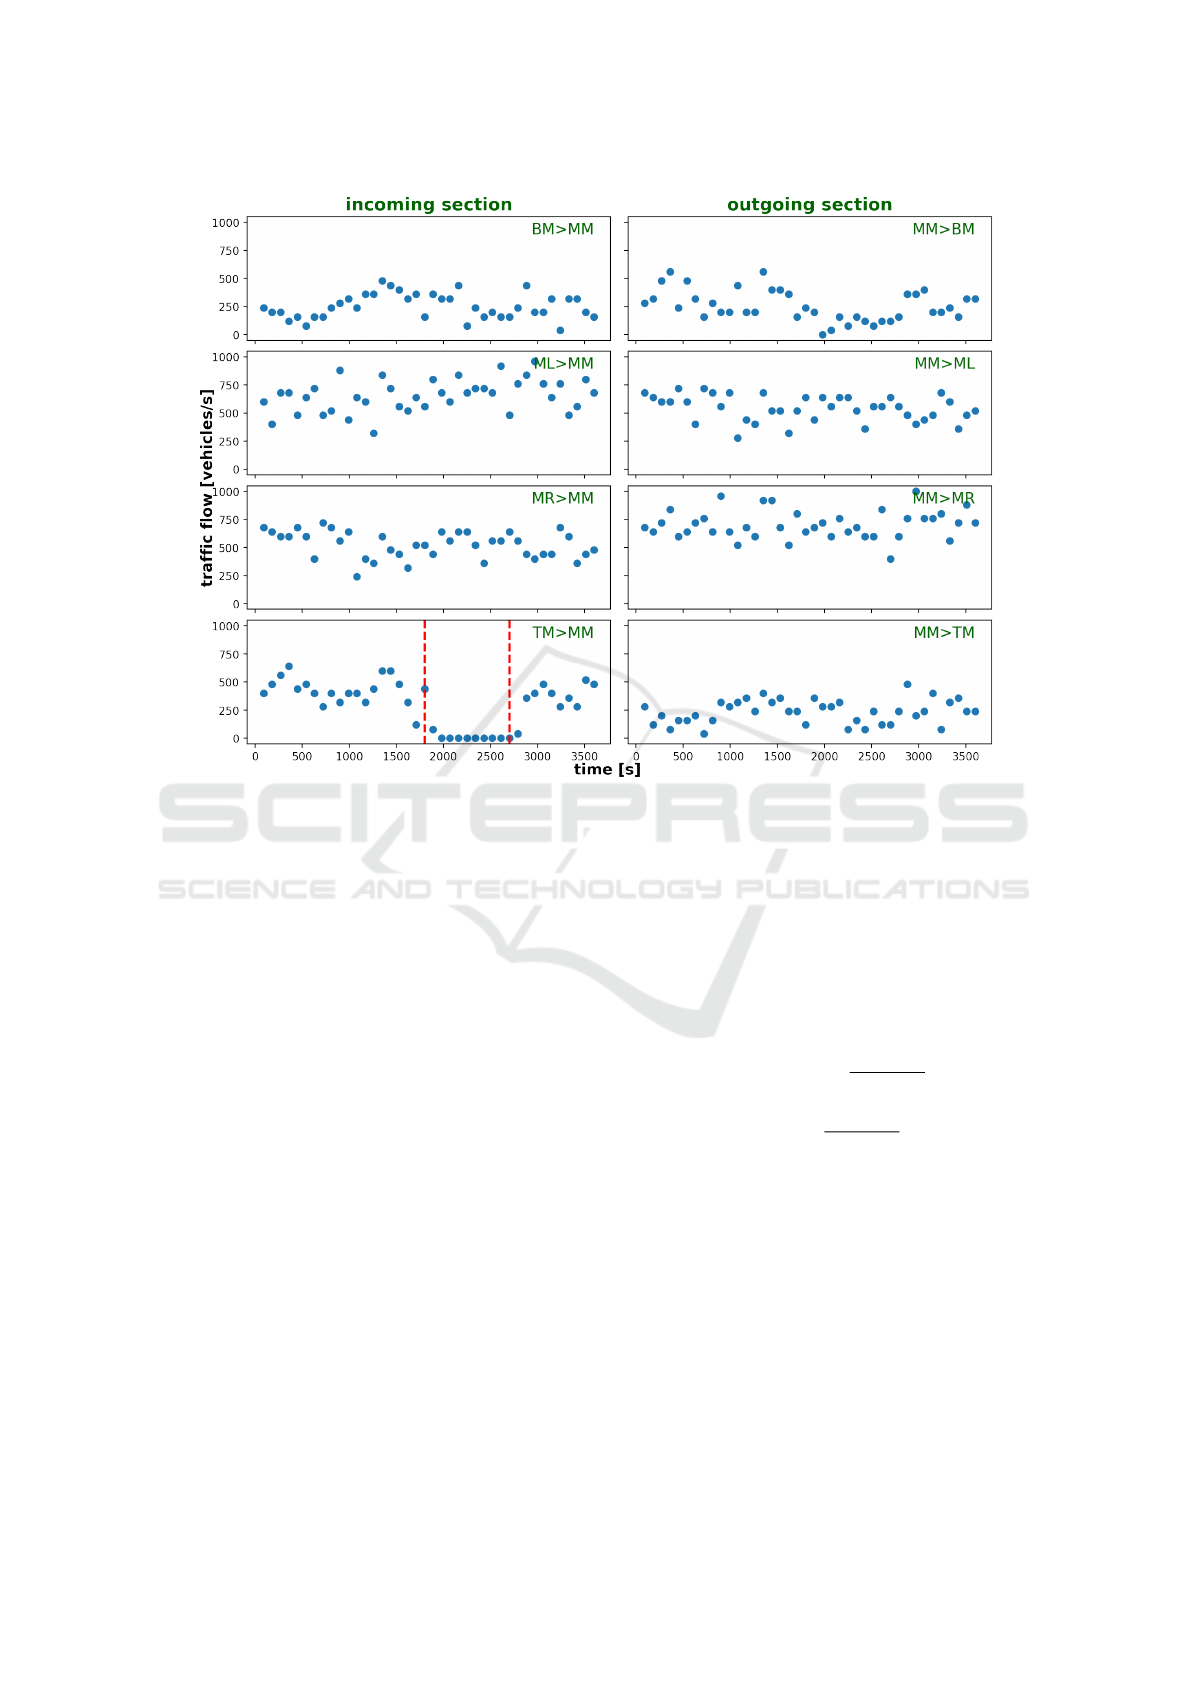
Figure 4: Traffic flows in vehicles/hour, which are compiled from the point of view of the MM intersection. The higher
primary and secondary demands are discernible in the flows involving the ML, MM, and MR sections, compared to the
tertiary demands in north-south direction. The incoming TM>MM section features a full section closure from 0:30 – 0:45,
which is apparent due to the drop in traffic flow.
closure (left lane closed off from 50m to 100m) –
were set up with 3 different durations (all starting af-
ter half an hour): 5, 15 and 30 minutes. These com-
binations of incidents and times were situated in ev-
ery section, which implies one separate simulation
each. This also means that any one incident is as-
sessed twice: once in an incoming section for one in-
tersection, and once in an outgoing section from the
point of view of the other junction. Due to the di-
versified vehicle loads described in Section 3.2, all
incidents are observed under varying traffic demands.
5.2 Simulations
All simulations lasted for 60 minutes each and were
conducted twice with different traffic volumes: The
normal demand outlined in Table 1 and a high de-
mand featuring twice that volume. Finally, all these
simulations were carried out 5 times. These “repli-
cations” in Aimsun Next are based upon varying
(pseudo) random numbers and provide similar distri-
butions of vehicle counts for each simulation.
5.3 Criteria
Based on the counts of true and false positives respec-
tively negatives (T P, FP, T N, and T P), we consider
two criteria: the false positive rate FPR and the true
positive rate T PR (detection rate DR in this context):
DR = T PR =
T P
T P + FN
FPR =
FP
FP + T N
5.4 Parameter Search
For DBSCAN and OPTICS, regularly distributed pa-
rameter sets are used. The upper and lower limits for
these are based on our previous findings (Thomsen.
et al., 2021) and manual exploration. For DBSCAN,
combinations of ε and the minPts parameter are eval-
uated with regard to DR and FPR, while for the OP-
TICS clustering only mitPts is varied. The Euclidean
distance measure is used in both algorithms.
VEHITS 2022 - 8th International Conference on Vehicle Technology and Intelligent Transport Systems
414

6 RESULTS
Section 5 outlines the different demand and inci-
dent combinations. As each incident is rated twice,
720 samples are analysed from the point of view of
the 9 intersections. After applying both clustering
methods in combination with 240 parameter sets, the
intersection-centric detection is calculated, taking all
8 sections into account. For example, a correct iden-
tification, with respect to Section 5.3, results in one
TP and 7 TN. For an identification, the true and the
detected time intervals must overlap by at least 50%.
In the following, the best parameter sets are shown.
They all have a 100% detection rate.
6.1 Section Closures
As expected, the flow decrease is most pronounced
in case of section closures. Sometimes, this even re-
sults in only one single cluster for all sections (see
Figure 3). Hence, as a straightforward approach, ex-
actly one flow cluster is requisite for the detection.
Table 2 shows the respective settings with very low
false positive rates.
Table 2: Best performing clustering for section closures.
DBSCAN exhibits low false positive rate for normal traffic
demands, which increases in case of high demand – even
more so if the incidents with the short duration of 5 minutes
are included (denoted by *). OPTICS shows a high FPR.
method demand ε minPts FPR
normal 0.3 7 0.01
DBSCAN high 0.3 7 0.38
normal* 0.4 5 0.57
high* 0.7 4 0.60
normal – 7 0.93
OPTICS high – 7 0.97
normal* – 7 0.93
high* – 7 0.96
6.2 Lane Closures
In the case of lane closures, the changes in traffic
flows are less strong, even in case of high demands.
Table 3 shows the higher false positive rates. Also,
there is minimal difference in performance when the
incidents with a short duration are included.
6.3 Partial Lane Closures
Similar to the lane closures, the traffic flow changes
are weak and the false positive rates are similar (see
Table 4). Again, OPTICS shows a very high FPR.
Table 3: Best performing clustering for lane closures. Com-
pared to the section closures, DBSCAN shows higher false
positive rates, yet still outperforms OPTICS. The inclusion
of the short 5-minute incidents is denoted by *.
method demand ε minPts FPR
normal 0.4 5 0.49
DBSCAN high 0.8 2 0.52
normal* 0.4 5 0.50
high* 0.8 7 0.58
normal – 7 0.90
OPTICS high – 7 0.95
normal* – 7 0.91
high* – 7 0.94
Table 4: Best performing clustering (partial lane closures).
The inclusion of the 5-minute incidents is denoted by *.
method demand ε minPts FPR
normal 0.3 7 0.46
DBSCAN high 0.3 7 0.43
normal* 0.4 5 0.48
high* 0.7 4 0.47
normal – 5 0.96
OPTICS high – 7 0.95
normal* – 5 0.97
high* – 7 0.96
6.4 Observations
Some high demand simulations show the occurrence
of subsequent incidents: Figure 6 suggests that due to
a section closure, additional congestions build up in
other sections. It also shows the overlapping clusters
of varying density produced by OPTICS, while the
DBSCAN clustering corresponds to a proper segmen-
tation. This makes the detection with OPTICS chal-
lenging and results in the high FPRs described above.
7 CONCLUSIONS
The results from Section 6 strengthen our previous
insight that traffic flow clustering works for section
closures, but is challenging for other incident types.
Also, some limits become apparent. For example, in-
cluding short incidents tends to increase the false pos-
itive rates. And due to the minimal number of points
necessary to form a cluster, shorter incidents (e. g.
less than two signalisation cycles) cannot be detected.
The simulated road network, combined with varied
traffic demands is more complex than in our previous
work. However, with the assumptions from Sections 3
to 4, the simulations are still far from real-life: Traf-
Intersection-centric Urban Traffic Flow Clustering for Incident Detection in Organic Traffic Control
415
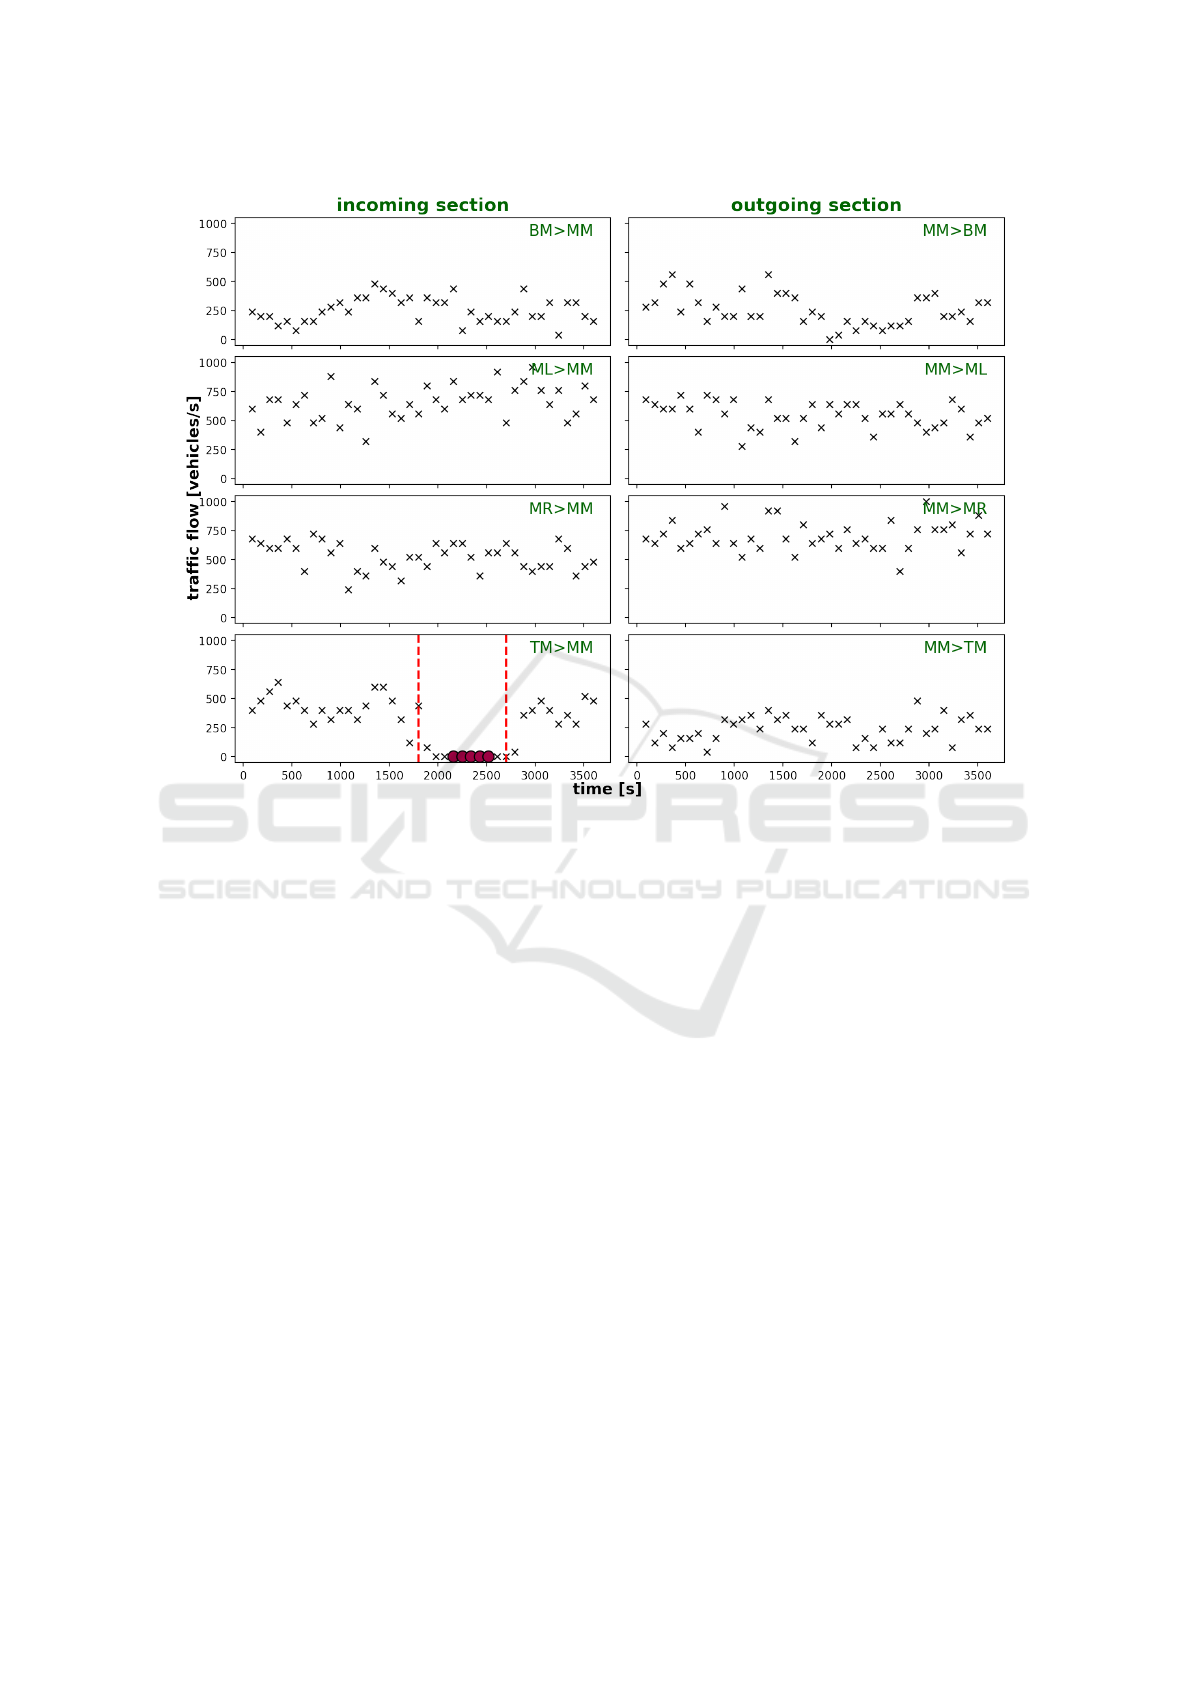
Figure 5: Exemplary DBSCAN clustering (minPts = 5,ε = 0.2) of normal traffic flows from Figure 4 in combination with the
section closure. These settings results in one single cluster of reduced flows, while all others are treated as noise by DBSCAN.
fic demands and concurrent incidents cause more dy-
namic situations. Combined with more complex net-
works, a complete or even an exhaustive simulation
of traffic situations using this approach is impossible.
Therefore, future work is planned to go into two
directions: First, the concept of traffic flows as the
base for detection is relinquished. Instead, the detec-
tor counts are used directly to define features, while
ML methods such as Random Forests, Support Vector
Machines, and Artificial Neural Networks are adopted
as classifiers. Second, the intersection-centric ap-
proach is improved by a collaborative validation: Rel-
evant upstream and downstream neighbours are con-
tacted about their information about disturbances or
additional detector readings. Subsequently, these re-
sponses are used to validate locally detected incidents.
ACKNOWLEDGEMENTS
This research was supported by the Deutsche
Forschungsgemeinschaft, DFG, in the context of the
project “Zwischenfall-bewusstes resilientes Verkehrs-
management f
¨
ur urbane Straßennetze (InTURN)”
(grant TO 843/5-1). We acknowledge this support.
REFERENCES
Ahmed, S. and Cook, A. (1980). Time series models for
freeway incident detection. Transp. Eng. J of the Am.
Soc. of Civ. Eng., 106(6):731–745.
Aimsun SLU (2010). Aimsun Next Professional, Version 22.
Barcelona, Spain.
Ankerst, M., Breunig, M. M., Kriegel, H.-P., and Sander, J.
(1999). OPTICS. In Proceedings of the 1999 ACM
SIGMOD international conference on Management of
data - SIGMOD ’99, New York, New York, USA.
ACM Press.
Campello, R. J., Kr
¨
oger, P., Sander, J., and Zimek, A.
(2020). Density-based clustering. Wiley Interdisci-
plinary Reviews: Data Mining and Knowledge Dis-
covery, 10(2):e1343.
Ester, M., Kriegel, H.-P., Sander, J., and Xu, X., editors
(1996). A Density-Based Algorithm for Discovering
Clusters in Large Spatial Databases with Noise, vol-
ume 96.
Hastie, T., Tibshirani, R., and Friedman, J. (2009). Unsu-
pervised learning. In The elements of statistical learn-
ing, pages 485–585. Springer.
VEHITS 2022 - 8th International Conference on Vehicle Technology and Intelligent Transport Systems
416
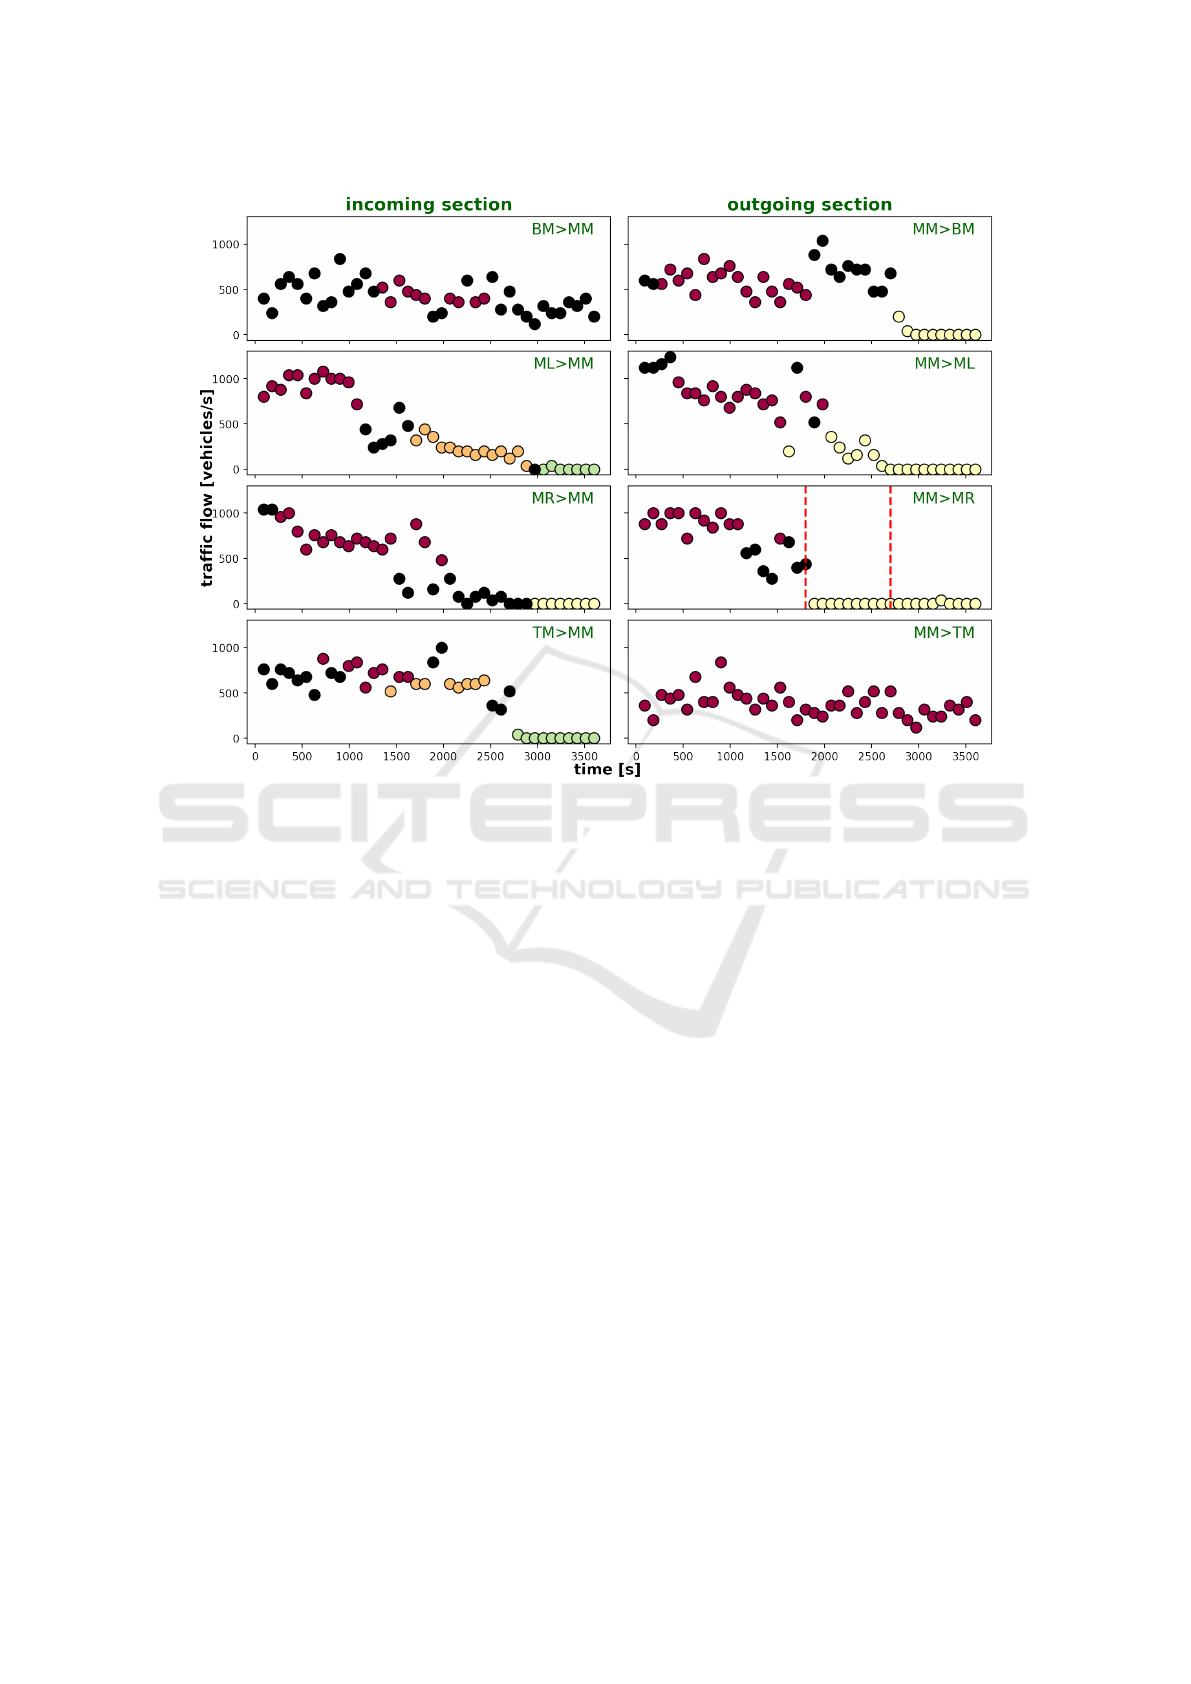
Figure 6: OPTICS clustering of high demand flows. Each colour represents one of the overlapping clusters. A section closure
after 30 minutes triggers subsequent congestions in other sections.
Lin, W. and Daganzo, C. (1997). A simple detection scheme
for delay-inducing freeway incidents. Transp. Res.
Part A: Policy and Practice, 31(2):141–155.
M
¨
uller-Schloer, C. and Tomforde, S. (2017). Organic
Computing-Technical Systems for Survival in the Real
World. Springer.
Payne, H. J. (1975). Freeway incident detection based upon
pattern classification. In Proc. of IEEE Conf. on Deci-
sion and Control, volume 14, pages 688–692. IEEE.
Pedregosa, F., Varoquaux, G., Gramfort, A., Michel, V.,
Thirion, B., Grisel, O., Blondel, M., Prettenhofer,
P., Weiss, R., Dubourg, V., Vanderplas, J., Passos,
A., Cournapeau, D., Brucher, M., Perrot, M., and
Duchesnay, E. (2011). Scikit-learn: Machine learning
in Python. Journal of Machine Learning Research,
12:2825–2830.
Prothmann, H., Branke, J., Schmeck, H., Tomforde, S.,
Rochner, F., H
¨
ahner, J., and M
¨
uller-Schloer, C.
(2009). Organic traffic light control for urban road net-
works. Int. J. Auton. Adapt. Commun. Syst., 2(3):203–
225.
Schrank, D., Eisele, B., and Lomax, T. (2021). Urban Mo-
bility Report 2021.
Shehata, M., Cai, J., Badawy, W., Johannesson, R., and
Radmanesh, A. (2008). Video-based automatic inci-
dent detection for smart roads: The outdoor environ-
mental challenges regarding false alarms. IEEE Trans.
on Int. Transp. Sys., 9(2):349–360.
Sommer, M., Tomforde, S., and H
¨
ahner, J. (2016). An Or-
ganic Computing Approach to Resilient Traffic Man-
agement. In Autonomic Road Transport Support Sys-
tems, pages 113 – 130. Birkh
¨
auser, autonomic systems
edition.
Thomsen., I., Zapfe., Y., and Tomforde., S. (2021). Urban
traffic incident detection for organic traffic control:
A density-based clustering approach. In Proceedings
of the 7th International Conference on Vehicle Tech-
nology and Intelligent Transport Systems - VEHITS,,
pages 152–160. INSTICC, SciTePress.
Tomforde, S., Prothmann, H., Rochner, F., Branke, J.,
H
¨
ahner, J., M
¨
uller-Schloer, C., and Schmeck, H.
(2008a). Decentralised Progressive Signal Systems
for Organic Traffic Control. In Proc. of 2nd IEEE
Int. Conf. on Self-Adaption and Self-Organisation
(SASO’08), pages 413–422.
Tomforde, S., Prothmann, H., Rochner, F., Branke, J.,
H
¨
ahner, J., M
¨
uller-Schloer, C., and Schmeck, H.
(2008b). Decentralised Progressive Signal Systems
for Organic Traffic Control. In Proc. of 2nd IEEE
Int. Conf. on Self-Adaption and Self-Organisation
(SASO’08), pages 413–422.
Xu, R. and Wunsch, D. (2005). Survey of clustering al-
gorithms. IEEE Transactions on neural networks,
16(3):645–678.
Intersection-centric Urban Traffic Flow Clustering for Incident Detection in Organic Traffic Control
417
