
Predicting and Avoiding SLA Violations of Containerized Applications
using Machine Learning and Elasticity
Paulo Souza
1 a
, Miguel Neves
2 b
, Carlos Kayser
1 c
, Felipe Rubin
1 d
, Conrado Boeira
2 e
,
Jo
˜
ao Moreira
1
, Bernardo Bordin
1 f
and Tiago Ferreto
1 g
1
School of Technology, Pontifical Catholic University of Rio Grande do Sul, Porto Alegre, Brazil
2
Faculty of Computer Science, Dalhousie University, Halifax, Canada
Keywords:
Cloud Computing, Containers, Service Level Agreement, Deep Learning, Time Series Forecasting.
Abstract:
Container-based virtualization represents a low-overhead and easy-to-manage alternative to virtual machines.
On the other hand, containers are more prone to performance interference and unpredictability. Consequently,
there is growing interest in predicting and avoiding performance issues in containerized environments. Ex-
isting solutions tackle this challenge through proactive elasticity mechanisms based on workload variation
predictions. Although this approach may yield satisfactory results in some scenarios, external factors such
as resource contention can cause performance losses regardless of workload variations. This paper presents
Flavor, a machine-learning-based system for predicting and avoiding performance issues in containerized
applications. Rather than relying on workload variation prediction as existing approaches, Flavor predicts
application-level metrics (e.g., query latency and throughput) through a deep neural network implemented
using Tensorflow and scales applications accordingly. We evaluate Flavor by comparing it against a state-of-
the-art resource scaling approach that relies solely on workload prediction. Our results show that Flavor can
predict performance deviations effectively while assisting operators to wisely scale their services by increas-
ing/decreasing the number of application containers to avoid performance issues and resource underutilization.
1 INTRODUCTION
Cloud computing has become the default environ-
ment for running enterprise applications, being used
by young startups and mature organizations. The pos-
sibility of using resources on demand and paying only
for the amount used has brought flexibility and agility
to innovate (Armbrust et al., 2010). However, in the
last years, we have seen a shift in how companies
use the cloud. Instead of migrating traditional mono-
lithic applications from their on-premises data centers
to public clouds, companies are building applications
that are specifically made to be executed on the cloud
from day one (Balalaie et al., 2018). We call this new
form of using the cloud as Cloud-Native.
a
https://orcid.org/0000-0003-4945-3329
b
https://orcid.org/0000-0002-6586-2846
c
https://orcid.org/0000-0001-5459-2134
d
https://orcid.org/0000-0003-1612-078X
e
https://orcid.org/0000-0002-6519-9001
f
https://orcid.org/0000-0002-8406-7573
g
https://orcid.org/0000-0001-8485-529X
Cloud-native uses container-based virtualization
to execute highly distributed applications based on
microservices (Gannon et al., 2017). The containers
that belong to an application are managed by a special
platform called orchestrator responsible for the appli-
cation’s lifecycle, high availability, and elasticity. The
utilization of a microservices architecture facilitates
the distribution of application development between
different teams. Each team becomes responsible for
a specific characteristic implemented into a microser-
vice, which is deployed in one or more containers.
Development teams can implement enhancements to
their microservices and instantiate a new microservice
release independently from other development teams.
Another significant benefit of using microservices
on containers is the possibility to quickly adapt the
number of allocated resources to meet a specific de-
mand by increasing or decreasing the number of con-
tainers. This characteristic increases application re-
siliency and guarantees the application responsive-
ness for users even during utilization spikes. Or-
chestrator platforms, such as Kubernetes, usually pro-
74
Souza, P., Neves, M., Kayser, C., Rubin, F., Boeira, C., Moreira, J., Bordin, B. and Ferreto, T.
Predicting and Avoiding SLA Violations of Containerized Applications using Machine Learning and Elasticity.
DOI: 10.5220/0011085100003200
In Proceedings of the 12th International Conference on Cloud Computing and Services Science (CLOSER 2022), pages 74-85
ISBN: 978-989-758-570-8; ISSN: 2184-5042
Copyright
c
2022 by SCITEPRESS – Science and Technology Publications, Lda. All rights reserved

vide tools to scale horizontally by adding/removing
containers or vertically by increasing/decreasing con-
tainer capacity. These tools monitor a metric on the
containers and, when a specific threshold is reached,
it automatically scales the number or capacity of con-
tainers.
With the automation of resource scalability, appli-
cations can be provided with predefined guarantees in
terms of performance. These guarantees are normally
included in a Service Level Agreement (SLA). SLAs
are contracts between providers and consumers that
define each party’s responsibilities regarding a spe-
cific service (Patel et al., 2009). They include de-
tailed information, such as the specific metrics used
for service estimation, how these metrics are mea-
sured, thresholds indicating the minimum quality of
service, and penalties applied to the provider when
the thresholds are not met. Auto-scaling tools can be
configured to avoid SLA violations, guaranteeing that
enough resources will be provisioned to attend to the
specified threshold.
However, most common solutions (e.g., Kuber-
netes Horizontal Pod Autoscaler) are based on a re-
active approach. The metrics are periodically moni-
tored, and when its value surpasses the threshold de-
fined in the SLA, the auto-scaling tool starts increas-
ing the capacity of the resources. Depending on the
monitoring frequency, defined thresholds, and delay
to scale resources, an SLA violation may occur, which
will penalize both the consumer and provider. In
order to avoid this situation, machine learning tech-
niques are being used to forecast these metrics based
on previous utilization (Imdoukh et al., 2019; Rossi
et al., 2019; Toka et al., 2020; Goli et al., 2021).
Such an approach ensures that enough resources will
be available when a predicted spike happens. How-
ever, existing strategies based on machine learning
methods strive to predict workload variations, relying
on the assumption that peak workloads are the only
reason for performance issues in containerized appli-
cations, ignoring that external factors such as perfor-
mance and interference can also undermine applica-
tions’ performance.
This paper presents Flavor, a machine-learning-
based system for predicting and avoiding SLA vi-
olations of containerized applications. Flavor uses
Long Short-Term Memory (LSTM), a recurrent neu-
ral network model, to predict service performance us-
ing past observations. Unlike other approaches, Fla-
vor uses specific application performance metrics and
resource utilization to train a forecasting model. Our
experiments show that this approach increases Fla-
vor’s accuracy to detect variations in performance
metric values, which may lead to an SLA violation.
Flavor also implements a scaling strategy to define
when and how the number of allocated resources
should be increased or decreased, using information
from the forecasting model. We present an exten-
sive analysis of Flavor’s behavior compared to a tradi-
tional scaling strategy (based on a reactive approach)
and a state-of-the-art proactive strategy. Results show
that Flavor overcome the other approaches, avoiding
most SLA violations even when environment interfer-
ence is present. In summary, we make the following
contributions in this paper:
• We conduct an extensive set of experiments that
demonstrate the challenges of predicting SLA vi-
olations of containerized applications;
• We introduce Flavor, a solution that employs a
machine learning model that predicts SLA viola-
tions several minutes ahead based on performance
metrics in time to avoid them through appropriate
elasticity plans;
• We fine-tune Flavor parameters through an in-
depth sensitivity analysis;
• We validate Flavor through a performance evalua-
tion that shows how it outperforms a state-of-the-
art strategy that relies on workload prediction.
This paper is organized as follows. Section 2 pro-
vides an overview of the cloud-native ecosystem, es-
pecially regarding the relation between microservices
and containers. This section also presents the com-
plexities involved in implementing an accurate fore-
casting model and performing resource scaling. Sec-
tion 3 presents Flavor architecture, detailing its main
modules: KPI Monitor, SLA Violation Predictor, and
Elasticity Manager. Section 4 describes how we eval-
uated Flavor, and compared it with traditional reactive
mechanisms (Kubernetes Horizontal Pod Autoscaler)
and a state-of-the-art proactive approach. In Sec-
tion 5, we present a discussion on our findings based
on Flavor’s evaluation. Section 6 presents other re-
search works related to Flavor. Finally, Section 7 con-
cludes the paper presenting our key takeaways and di-
rections for future work.
2 BACKGROUND
2.1 Cloud-native Ecosystem
Cloud services have recently undergone a major shift
from complex monolithic designs to hundreds of in-
terconnected microservices (Gannon et al., 2017).
The microservice abstraction is specially appealing
due to its modularity and flexibility. For example, a
Predicting and Avoiding SLA Violations of Containerized Applications using Machine Learning and Elasticity
75

programmer can write a microservice in her preferred
language (e.g., Ruby or Python) and easily compose
it with other microservices written by third parties
in a different framework (e.g., Java). Microservices
are typically packaged in lightweight containers (e.g.,
Docker
1
, LXC
2
) and deployed and managed using
automated container orchestration tools (e.g., Kuber-
netes
3
, Swarm
4
). Unless stated otherwise, we focus
on Docker and Kubernetes in this work.
Containers are a form of OS-level virtualization
(in contrast to hardware-level virtualization such as
virtual machines - VMs). Each container includes the
application executable, libraries, and system tools on
which the application depends (Zhang et al., 2018).
System administrators can allocate resources to a con-
tainer dynamically (e.g., using control groups), and a
certain level of isolation is provided among contain-
ers (though weaker than that for VMs) through tools
like namespaces.
Kubernetes (also known as k8s) is a platform to
orchestrate the placement and execution of containers
across a computer cluster. A k8s cluster consists of
a control plane (or master) and one or more worker
nodes (e.g., a VM or server). Each worker node runs:
i) a Kubelet agent that manages the node resources
and interacts with the control plane; and ii) a con-
tainer runtime engine to manage the container lifecy-
cle (e.g., creation, pausing). The smallest deployable
units in k8s are pods. A pod is a group of one or more
containers with shared storage and network resources
(e.g., filesystem volumes and namespaces) and that is
meant to run an instance of a given service or appli-
cation. Pods are scheduled by the k8s master.
In addition to container management and provi-
sioning, k8s also has automatic scaling mechanisms.
The Vertical Pod Autoscaler (VPA) makes scaling
decisions by dynamically allocating more, or less,
computer resources (e.g., CPU or memory) to ex-
isting pods. The Horizontal Pod Autoscaler (HPA),
performs scaling actions by adding, or reducing, the
number of pods in a cluster, being triggered by simi-
lar metrics as the VPA, using only CPU and memory
usage, or any other custom metric chosen by the user.
This new cloud architecture brings significant
challenges to operators such as mitigating perfor-
mance bottlenecks caused by containers’ lack of iso-
lation. The high degree of dependency among mi-
croservices in large-scale deployments amplifies this
concern, as a single misbehaving microservice may
trigger cascading SLA violations over the entire ap-
1
https://www.docker.com/
2
https://linuxcontainers.org/
3
https://kubernetes.io/
4
https://docs.docker.com/engine/swarm/
plication. In that scenario, reactive measures become
impractical as performance degradation propagates
across dependent microservices very fast. Therefore,
predicting performance issues becomes essential to
ensure SLA requirements (Gan et al., 2019).
2.2 The Complexity of Interpreting
Resource Utilization
Most cloud providers offer extensive monitoring so-
lutions to track the health of service instances in real
time. Their solutions include meters for CPU utiliza-
tion, memory utilization, number of TCP/IP connec-
tions, pages accessed from disk, among others (An-
war et al., 2015). While resource-based meters can
be directly used for detecting or predicting SLA vio-
lations, it turns out to be challenging to adopt them in
practice for a few reasons.
First, it may not be easy to tune a set of meters
to catch the specific requirements of an application.
SLAs are usually established in terms of application-
level metrics (e.g., query latency), but resource-based
meters actually reflect the system’s state. For exam-
ple, a meter based on CPU utilization would not de-
tect imminent latency-related SLA violations result-
ing from a memory bottleneck. Second, meter thresh-
olds are usually fixed values lasting for the lifetime of
an application. As a result, they may not cope with the
dynamics of cloud applications if the threshold value
is too high or lead to significant resource underuti-
lization otherwise (i.e., a low threshold may cause re-
sources to scale up often). Finally, prediction models
based on resource usage are likely to become useless
if the hardware changes.
2.3 Workload Prediction Issues
Many state-of-the-art approaches like (Imdoukh et al.,
2019; Cruz Coulson et al., 2020; Ma et al., 2018)
try to overcome the challenges of adopting resource-
based meters to detect (or predict) SLA violations
by focusing on predicting a service workload and its
characteristics. Although workload predictions may
yield satisfactory results in certain cases, they are usu-
ally based on the assumption that services will have
similar performance whenever they receive analogous
workloads. Nevertheless, there are multiple factors
that can affect the performance of a cloud service even
when it runs the same workload on top of equivalent
resources (e.g., a given set of containers).
To illustrate our points, we perform two experi-
ments. First, we set up the same cloud environment
(i.e., a virtual machine with 16 CPU cores, 32 GB
of memory and 64 GB of disk running Ubuntu Live
CLOSER 2022 - 12th International Conference on Cloud Computing and Services Science
76
Server 18.04) on two different servers, namely S
1
and
S
2
. S
1
is a Dell PowerEdge R720 with a Xeon E5-
2650 processor and 64 GB DDR3 RAM while S
2
is a
Dell PowerEdge R730 with a Xeon E5-2650 v4 pro-
cessor and 256 GB DDR4 RAM. The VM executes
Minikube version 1.16.0
5
and deploys a MySQL ser-
vice with 4 pods which we stress using the Bustracker
workload (Ma et al., 2018) (see Section 4.1 for more
details on the workload).
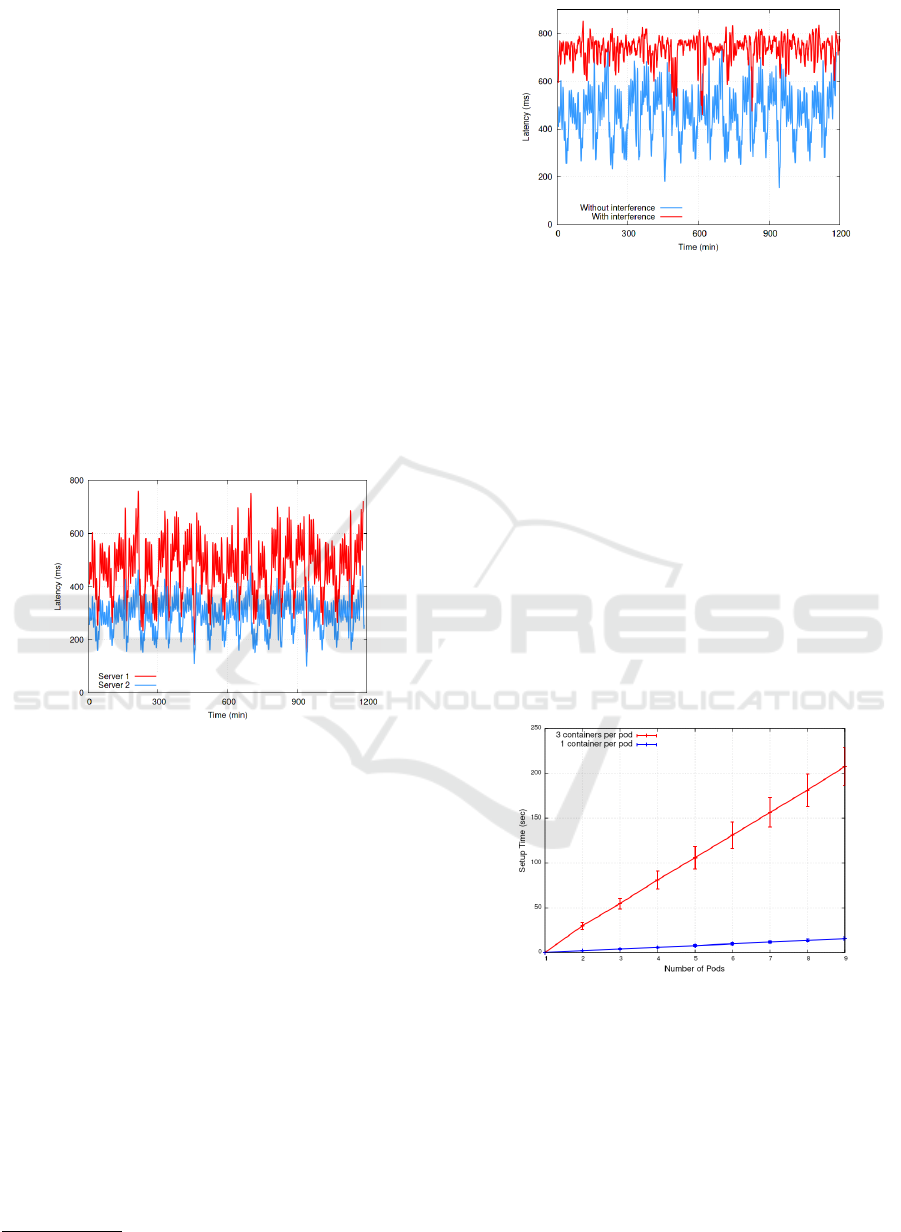
Figure 1 shows the resulting latency for each
server. Although the latency on both servers dis-
plays a similar pattern of peaks and valleys, we can
clearly see that the same service is slower in S
1
than in
S
2
. For example, the average query latency is around
290ms in S
2
while it achieves more than 450ms in S
1
.
Moreover, the peak latency is about 50% higher in S
1
(871ms against 584ms in S
2
). These results indicate
that a service could violate a latency SLA in S
1
but
not in S
2
depending on the values accorded between
the client and the cloud provider.
Figure 1: Latency for a MySQL service running the Bus-
tracker benchmark on two different servers.
In the second experiment, we tested the effect of
interference in the latency experienced by a service.
In this test, we instantiated two new MySQL instances
in S
1
(each instance has 4 pods and runs the same
BusTracker workload), and evaluated their effect on
the original one (called the reference instance). Figure
2 shows the latency for the reference instance with
and without interference from other services.
There is a significant increase in latency when
there are multiple service instances running on the
same Kubernetes node. For example, the average la-
tency was around 470 and 730 ms without and with
interference, respectively (more than 55% higher in
the latter). Likewise, peak latencies also face a sub-
stantial increase (from 871 to 932 ms in our case). To-
gether with the previous experiment, our results show
that detecting SLA violations based on workload pre-
dictions can be misleading depending on where the
workload runs and whether it runs in isolation or not.
5
https://minikube.sigs.k8s.io/docs/
Figure 2: Latency for a MySQL service running the Bus-
tracker benchmark with and without interference.
2.4 Fairly Long Pod Setup Times
Even when a cloud monitor or workload predictor can
provide very accurate estimates, there is still a chance
the monitored (or predicted) service could violate its
SLA due to the time it takes to k8s to set up a new
pod. To show this point, we perform an experiment
where we scale up the number of pods in a MySQL
service from n units (n varies from 1 to 8) and mea-
sure the pod setup time (i.e., the time span that cov-
ers the entire scaling process until the new instances
are ready to serve requests). We repeat this experi-
ment 100 times for each scenario and show the aver-
age setup time for pods containing both one and three
containers (pods containing three containers run a hot
backup and a metrics exporter in addition to the orig-
inal MySQL service). Figure 3 shows the results.
Figure 3: Time needed for scaling from 1 to a specific num-
ber of pods in Kubernetes using a MySQL service with 3
containers per pod and another with 1 container per pod.
In both cases, the set up time scales linearly with
the number of new pods. Interestingly, pods contain-
ing three containers took significantly longer times
to be set up compared to pods running only a sin-
gle one. This difference comes mainly from the time
the container runtime takes to instantiate a new con-
tainer (Fu et al., 2020). More importantly, the set up
time can be as long as 3 minutes for the scenarios we
Predicting and Avoiding SLA Violations of Containerized Applications using Machine Learning and Elasticity
77

tested, clearly indicating that a resource scaler should
act well in advance to avoid an SLA violation.
3 FLAVOR DESIGN
This section presents Flavor, a solution for predicting
and avoiding SLA violations in cloud services. We
start by giving an overview of Flavor’s architecture.
Flavor comprises three main components: (i) a
Key Performance Indicator (KPI) Monitor; (ii) an
SLA Violation Predictor; and (iii) an Elasticity Man-
ager. Figure 4 depicts its architecture. Given a cloud
platform with available services and monitoring solu-
tions, Flavor first triggers its KPI Monitor to gather
key statistics (e.g., latency, throughput) about the run-
ning services and save such information in a time se-
ries database (steps 1-3).
With service KPIs at hand, the SLA Violation
Predictor component comes into the scene. At this
stage, collected KPIs feed a machine learning model
that forecasts the performance of a service and detect
whether SLA violations are likely to occur (steps 4-
5). Finally, Flavor uses the forecasted performance
to trigger the Elasticity Manager module, which pro-
cesses the performance predictions and defines an
elasticity plan capable of balancing performance and
resource efficiency (steps 6-7). The following sec-
tions describe each Flavor component in detail.
3.1 KPI Monitor
The KPI Monitor comprises a lightweight, pod-level
monitoring system that collects raw metrics from
cloud services. Each pod takes a monitoring agent
that can report multiple metrics at different timescales
— such flexibility is vital for ensuring efficient moni-
toring of services that work differently. For instance,
we may define query latency as a performance indi-
cator for database services (e.g., MySQL, MongoDB)
and throughput for message-passing services (e.g.,
RabbitMQ). In possession of monitoring data, the KPI
Monitor aggregates raw metrics into low-order statis-
tics (e.g., average and variance among pods and/or
time intervals) to preserve data richness while opti-
mizing storage space.
3.2 SLA Violation Predictor
The SLA Violation Predictor module is responsible
for determining beforehand whenever a service will
not reach its expected performance (so-called SLA
violation). To that end, it uses historical data as in-
put for tracking trends and determining the service’s
future performance alongside indications of whether
SLA violations are likely to occur. Since this pro-
cess involves making predictions from data points in-
dexed in time order, we turn our attention to time
series forecasting models, more specifically, Autore-
gressive (AR) models and Recurrent Neural Network-
based (RNN) models.
Autoregressive models (e.g., ARIMA and VAR-
MAX) make predictions using a linear combination
of past observations from a variable of interest. Gen-
erally speaking, AR models rely on feedforwarding,
making them cheaper than those that allow cyclic be-
havior, such as RNNs.
Recurrent Neural Network-based models assume
a temporal dependency among the inputs. Each unit
within the network includes a memory mechanism
with information from prior computations that in-
fluence the output. Such a strategy makes RNNs
more adaptable than AR models, which must be re-
trained quite often as new data comes in. This paper
uses a RNN model called Long Short-Term Memory
(LSTM) (Hochreiter and Schmidhuber, 1997), which
introduces a forget-gate that allows the network to un-
derstand how long past information is relevant for the
current prediction. Figure 5 depicts the architecture
of the chosen LSTM model.
Unlike most state-of-the-art approaches, our
model takes performance metrics alongside capacity
information in the training phase. Whereas perfor-
mance metrics (e.g., average query latency) help pre-
dicting upcoming SLA violations, capacity informa-
tion (e.g., number of pods) gives insights on the ca-
pacity/performance correlation. We collect this in-
formation by benchmarking the target service using
a requests generation script that simulates user access
patterns.
The training dataset must comprise observations
across different situations to ensure the model’s ac-
curacy as the environment changes. For instance, we
may benchmark the service running with different ca-
pacity configurations to ensure the model’s adaptabil-
ity as the database is scaled up/down. Additionally,
benchmarking the service with neighbor applications
sharing physical resources enables accurate predic-
tions that consider performance interference.
Rather than training multiple models to predict
each significant change in the environment, we train
a single model with shuffled observations from mul-
tiple datasets. As a result, the model knows the best
course of action even when the environment changes
at runtime. Despite that, significant variations can still
deteriorate the model’s performance in the long term.
In that case, integrating automatic model re-training
mechanisms could deal with the problem while re-
CLOSER 2022 - 12th International Conference on Cloud Computing and Services Science
78
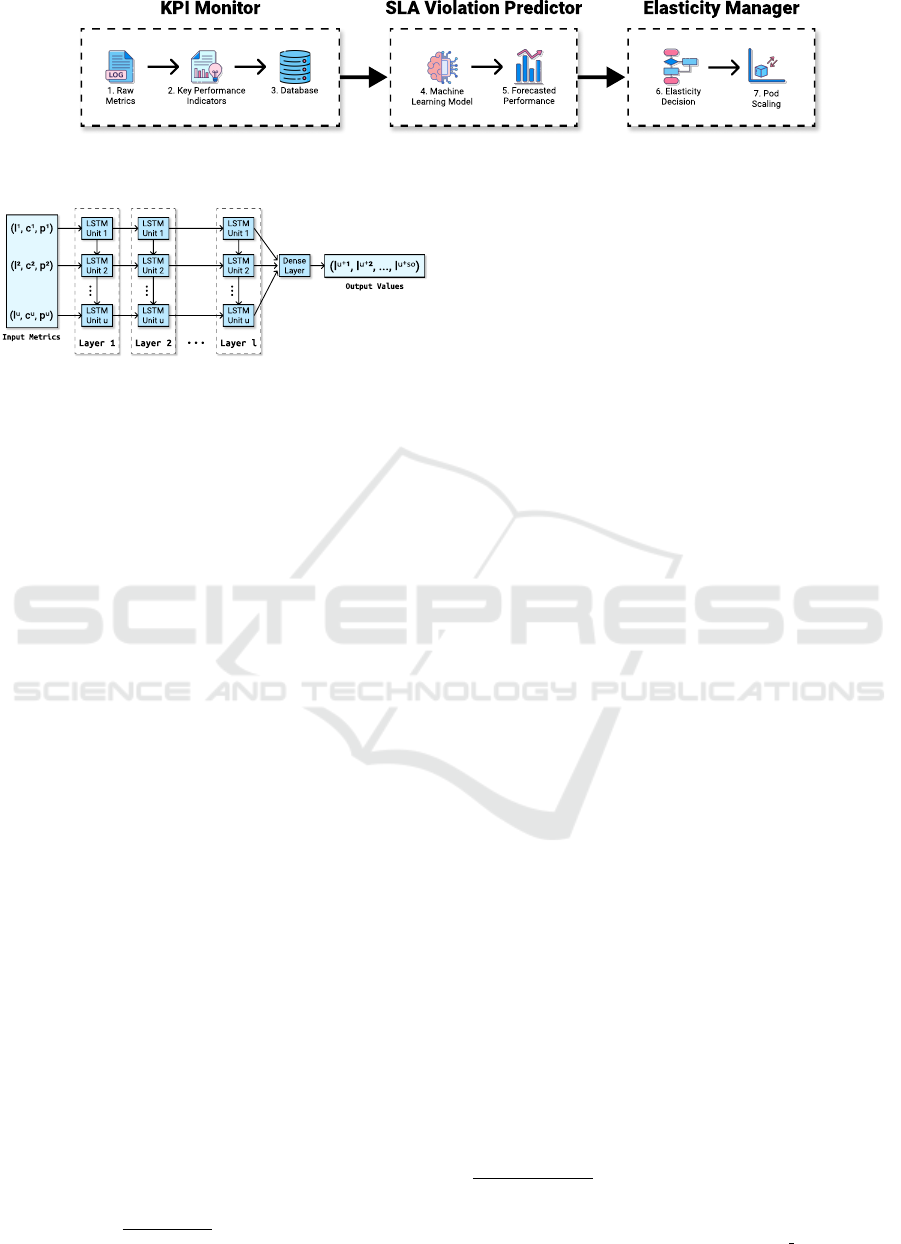
Figure 4: Flavor architecture.
Figure 5: Architecture of the proposed LSTM model. The
input metrics consist of previous values of latency (l), CPU
usage (c) and number of pods (p) of the service. The data
goes through l layers of u units and produces an output of
so latency predictions points.
quiring just minor changes to Flavor’s architecture.
3.3 Elasticity Manager
The Elasticity Manager takes performance predic-
tions from the SLA Violation Predictor and defines
appropriate provisioning levels. During model train-
ing, the Elasticity Manager is restricted from perform-
ing scaling decisions to prevent the Elasticity Man-
ager from undermining prediction accuracy with scal-
ing decisions unknown to the ML model.
Whenever predictions indicate upcoming SLA vi-
olations, the Elasticity Manager scales up the service
to the subsequent capacity configuration known by
the ML model. Conversely, the Elasticity Manager
awaits n votes to perform a scale down, where any
different scaling suggestion within the voting resets
the counting. This policy prevents precipitated scal-
ing decisions that may lead to SLA violations due to
the lack of resources.
Scale down voting occurs whenever Equation 1
is satisfied, and the monitored KPI drops to a point
where a smaller capacity configuration known by the
model could meet the demand without violating the
SLA. In Equation 1, n
curr
depicts the current num-
ber of service replicas, l
max
represents the worse up-
coming KPI value predicted, and n
lower
denotes the
number of replicas from the smaller capacity config-
uration. A safety interval α prevents scaling down the
service to a set of replicas that keeps the KPI too close
to the SLA limit.
n
curr
× l
max
n
lower
< SLA − α (1)
4 PERFORMANCE EVALUATION
We now present an evaluation of Flavor’s ability to
predict SLA violations of containerized applications.
We implemented and trained an LSTM model using
TensorFlow
6
version 2.2.0 and Python version 3.6.9.
We first describe our setup (§4.1), including a de-
tailed analysis of a real-world trace we used in our
experiments. We then perform an extensive investiga-
tion of Flavor’s hyperparameters to evaluate its accu-
racy and find the best possible configuration (§4.2).
Next, we compare Flavor against a state-of-the-art
cloud scaling approach based on workload prediction
(§4.3). Finally, we demonstrate the benefits of Fla-
vor over the reactive k8s Horizontal Pod Autoscaler
(§4.4).
4.1 Experimental Setting
Testbed. We evaluate Flavor in a testbed comprised
of a Kubernetes cluster provisioned over two physical
machines: (1) PowerEdge R720 with a Xeon E5-2650
v2 processor, 128GB of DDR3 main memory; and
(2) PowerEdge R730 with a Xeon E5-2650 v3 pro-
cessor, 224GB of DDR4 RAM. Both of them using
the VMware ESXi 7.0.0 hypervisor.
The application used to evaluate the SLA viola-
tion predictor was the standard MySQL version 5.7
deployment for Kubernetes. In our implementation,
we used Prometheus
7
version 2.26.0 and Prometheus
SQL Exporter
8
placed in each pod with the MySQL
container to collect all the necessary metrics, which
were stored in a time series database. We also used
a small Node.js application to apply the Bustracker
workload (detailed below) on the MySQL instance.
Workload. We used the BusTracker (Ma et al.,
2018) dataset to generate the workload for the exper-
iments. This dataset contains a random sampling of
the queries executed from a mobile phone application
to a PostgreSQL database during a period of 57 days,
between November 2016 and January 2017. Users of
the application could track live information about bus
6
https://www.tensorflow.org/
7
https://prometheus.io/
8
https://hub.docker.com/r/githubfree/sql exporter
Predicting and Avoiding SLA Violations of Containerized Applications using Machine Learning and Elasticity
79
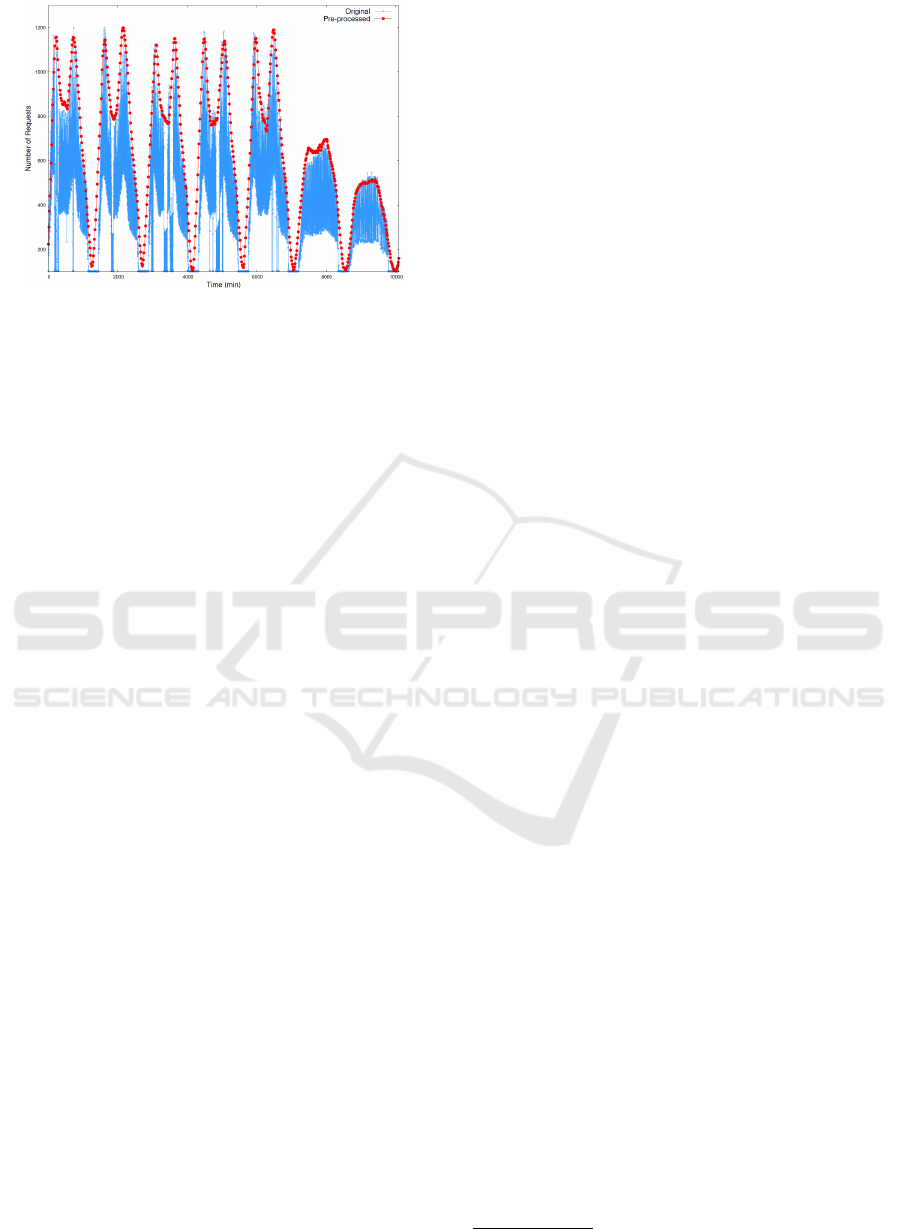
Figure 6: BusTracker before and after pre-processing.
locations, find nearby bus stops and get information
about routes. The requests of the BusTracker dataset
trace have a well defined seasonal pattern, varying ac-
cording to the hour of the day and day of the week. In
(Ma et al., 2018), it is discussed that approximately
98% of the total requests from BusTracker are SE-
LECT statements, which shows that the majority of
operations performed in the application’s database are
read operations. The BusTracker data provided has
missing periods of information, and the authors state
that it contains a 2% random sampling from the com-
plete 57 days period. Still the data presents important
seasonal patterns of requests.
Since we are interested in reproducing the overall
request patterns, we applied a set of pre-processing
steps to facilitate its execution in a short period of
time, while preserving the workload’s main charac-
teristics. First, we removed all queries that are not
SELECT statements. The data is provided in the
form of requests per second for the whole period, so
we decided to aggregate the number of requests per
minute, which reduces the data volume but preserves
its characteristics. Then, as the data presents a strong
weekly-repeating pattern, we selected just the first
complete week (Monday to Sunday) in the dataset.
We applied an initial sampling to this single-
week pattern of requests, selecting a point every
six data points. Then, we generated a set of 632
points equally-spaced in the time axis, by perform-
ing a piecewise linear interpolation of the points from
the initial sampling. The piecewise interpolation is
convenient since it allows generating a set of arbi-
trary size which approximate the curve formed by
the points being interpolated. We tested different
amounts of generated points by the interpolation, and
decided for a value that results in a small workload to
be reproduced, although preserving the original data
characteristics. The result is shown in Figure 6.
The workload was used to simulate the requests
pattern to the MySQL service deployed on Kuber-
netes. We performed three simulations with 2, 4, and
8 replicas in order to generate the datasets that will be
used in the LSTM training process.
4.2 Prediction Performance
We start detailing Flavor’s performance for differ-
ent hyperparameter configurations. Our goals are
twofold: first, we want to understand how important
each hyperparameter is to the quality of Flavor’s pre-
dictions; and second, we want to identify good val-
ues for these hyperparameters. Since Flavor takes a
sequence of performance measurements (rather than
the workload demand itself) as input, we begin by
running the Bustracker workload on the testbed de-
scribed in Section 4.1 to generate a working dataset.
More specifically, we run the workload for different
numbers of serving pods (i.e., pods running instances
of the MySQL service) and background services caus-
ing interference while measuring the latency for each
query.
Once we have the working dataset, we use it to
train and test Flavor under different hyperparameter
configurations. We run these experiments in a third
server apart from the testbed described in Section 4.1.
The server has 8 CPUs, 64 GB of RAM and 200 GB
of disk. It runs Ubuntu 18.04.4 LTS and is equipped
with an NVIDIA Tesla V100 GPU with 16 GB of
memory, which we use to train our machine learn-
ing models. Unless stated otherwise, we trained all
models for 100 epochs with batches of 64 units us-
ing an Adam optimizer
9
and a dropout of 0.2. We
apply a randomized 4-fold cross-validation method
(Cerqueira et al., 2020) to the models and assess their
performance by calculating the Mean Squared Error
(MSE). We also measured the coefficient of determi-
nation (R
2
), but decided to omit these results from the
paper due to space contraints. The coefficient was
above 0.95 for all the models we tested.
Figure 7 shows the MSE for different combina-
tions of number of layers and units per layer in our
LSTM implementation. We fix the prediction hori-
zon and lag interval to 225 and 675 seconds in these
experiments, respectively. As we can see, one hid-
den layer is usually enough to obtain good predictions
and adding additional layers does not necessarily im-
prove the results as the model begins to overfit. Sim-
ilar behavior has also been reported in other domains
(e.g., image captioning (Soh, 2016)). Regarding the
number of units per layer, we can observe that higher
numbers of units tend to perform better. This is in
9
We use Adam with the default specs from TensorFlow.
CLOSER 2022 - 12th International Conference on Cloud Computing and Services Science
80
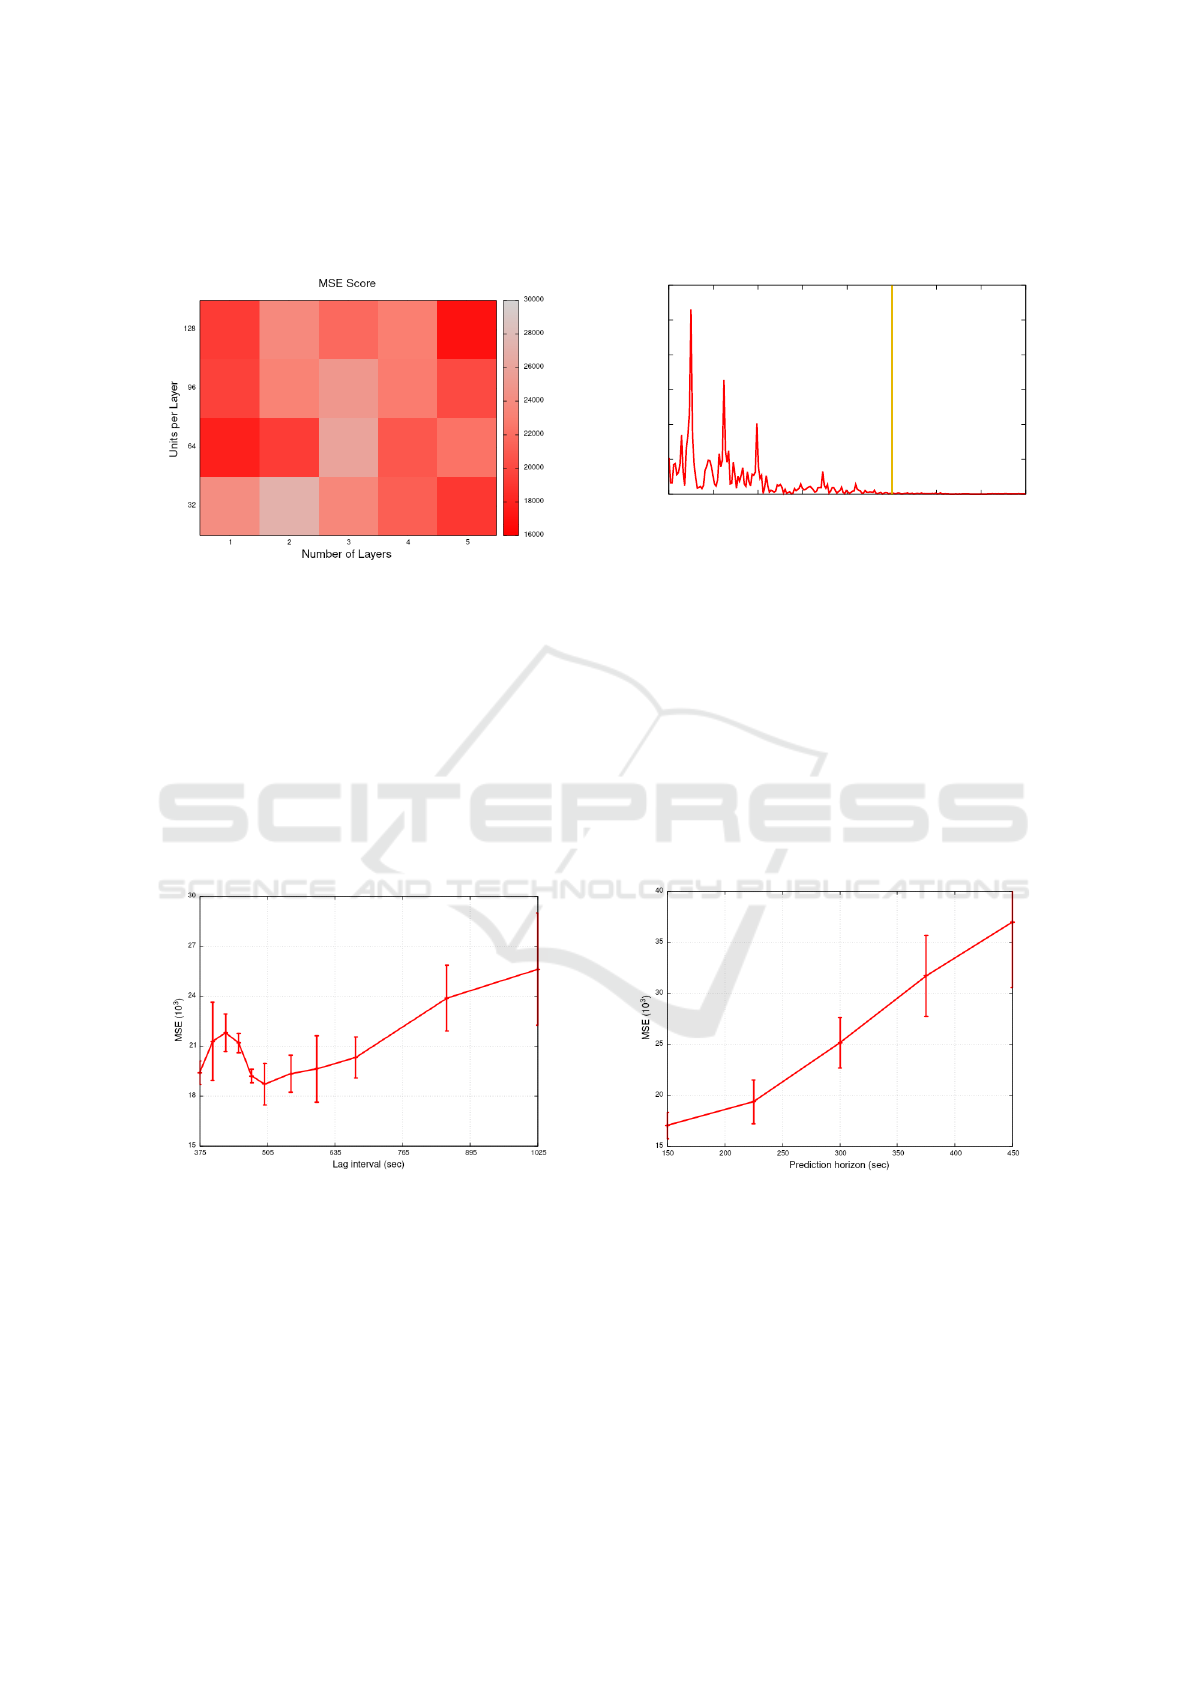
line with the literature and reflects the fact that a big-
ger hidden state can store more information about the
data (Rotman and Wolf, 2020).
Figure 7: MSE for each combination of number of layers
and units per layer.
We also measure the MSE as we vary the lag in-
terval (or number of past observations) adopted by our
neural network. Figure 8 shows the results. We con-
sider a single-layer LSTM with 64 units and a pre-
diction horizon of 225 seconds in these experiments.
As we can observe, the MSE typically increases as
we increase the lag interval, which is explained by
recent findings showing that LSTMs have issues to
learn long-term dependencies on data (though they
still do that better than ordinary RNNs (Zhao et al.,
2020)).
Figure 8: MSE for time intervals used model inputs.
Interestingly, the MSE decreased for lag times be-
tween 425 and 505 seconds. We believe that is due
to intrinsic characteristics of our dataset. In particu-
lar, Figure 9 shows that the time series we used in our
experiments has frequency components that are more
prominent up to 2.5 mHz (i.e., have periods longer
than 400 seconds), which may impact the ability of
Flavor’s LSTM to identify temporal dependencies on
the data for higher frequencies (shorter periods)(Tang
and Shwartz, 2012). Indeed, there seems to be a trade-
off between Flavor’s ability to detect long-term de-
pendencies and the lag intervals needed to identify the
existing dependencies on the data.
0
0.5
1
1.5
2
2.5
3
0 0.5 1 1.5 2 2.5 3 3.5 4
Amplitude (x10
6
)
Frequency (mHz)
Figure 9: Frequency analysis of Flavor’s input time series.
The vertical line indicates a period of 400 seconds.
Finally, we varied the prediction horizon from 150
seconds up to 450. We spaced each interval measured
by 75 seconds and repeated each test 4 times. As
can be seen in Figure 10, the MSE steadily increases
whenever the model attempts to predict points further
away in the future. Thus, defining a trade-off between
longer predictions and more accurate ones. However,
we need to take into account the consideration made
in Section 2.4. Therefore, we avoid using prediction
horizons smaller than 200 seconds, as that is the time
needed to perform the most costly scaling operation
(from 1 to 9 pods).
Figure 10: MSE for different prediction horizons.
4.3 Comparison with Existing Methods
In order to compare Flavor with another proactive
method, we implemented the strategy proposed by
Imdoukh et al. (Imdoukh et al., 2019), which con-
sists of making predictions over a single metric: the
workload itself. An LSTM model is used to forecast
the incoming amount of queries for the next minute.
The number of pods is adjusted by the ratio of queries
Predicting and Avoiding SLA Violations of Containerized Applications using Machine Learning and Elasticity
81
predicted and the amount of workload a single pod
can sustain, a value that is obtained by performing a
stress test. By comparing Flavor’s approach, we want
to demonstrate that in a scenario where a system is
suffering interference, forecasting only the workload
would not be suited for a good performance.
Both models were trained over regular workload
data, which where the amount of queries for the
model from Imdoukh et al. and the collected perfor-
mance metrics for Flavor. A stress test showed that a
value of 690 queries to the amount of workload for a
pod would be enough to not violate SLA’s test set at
1000ms. With all set, a test was performed in an en-
vironment with two MySQL services as interference,
each receiving a uniformly chosen random amount
between 10 and 100 requests per second.
As demonstrated in Figure 11, the strategy used
for comparison exhibited a greater amount of SLA
violations than Flavor’s. Also, resulting in a greater
average latency over time. By taking real-time per-
formance metrics, Flavor is able to predict, and best
scale the number of pods, to overcome the interfer-
ence being suffered. We note that Flavor presented a
period in the sixth day (Saturday) where the latency
observed was above the SLA limit, reaching a peak
slightly less than 1.5 seconds.
0
0.5
1
1.5
2
0 30 60 90 120 150
Latency (s)
Time (hours)
Imdoukh et al.
Flavor
Figure 11: Comparison between Flavor and Imdoukh et al.
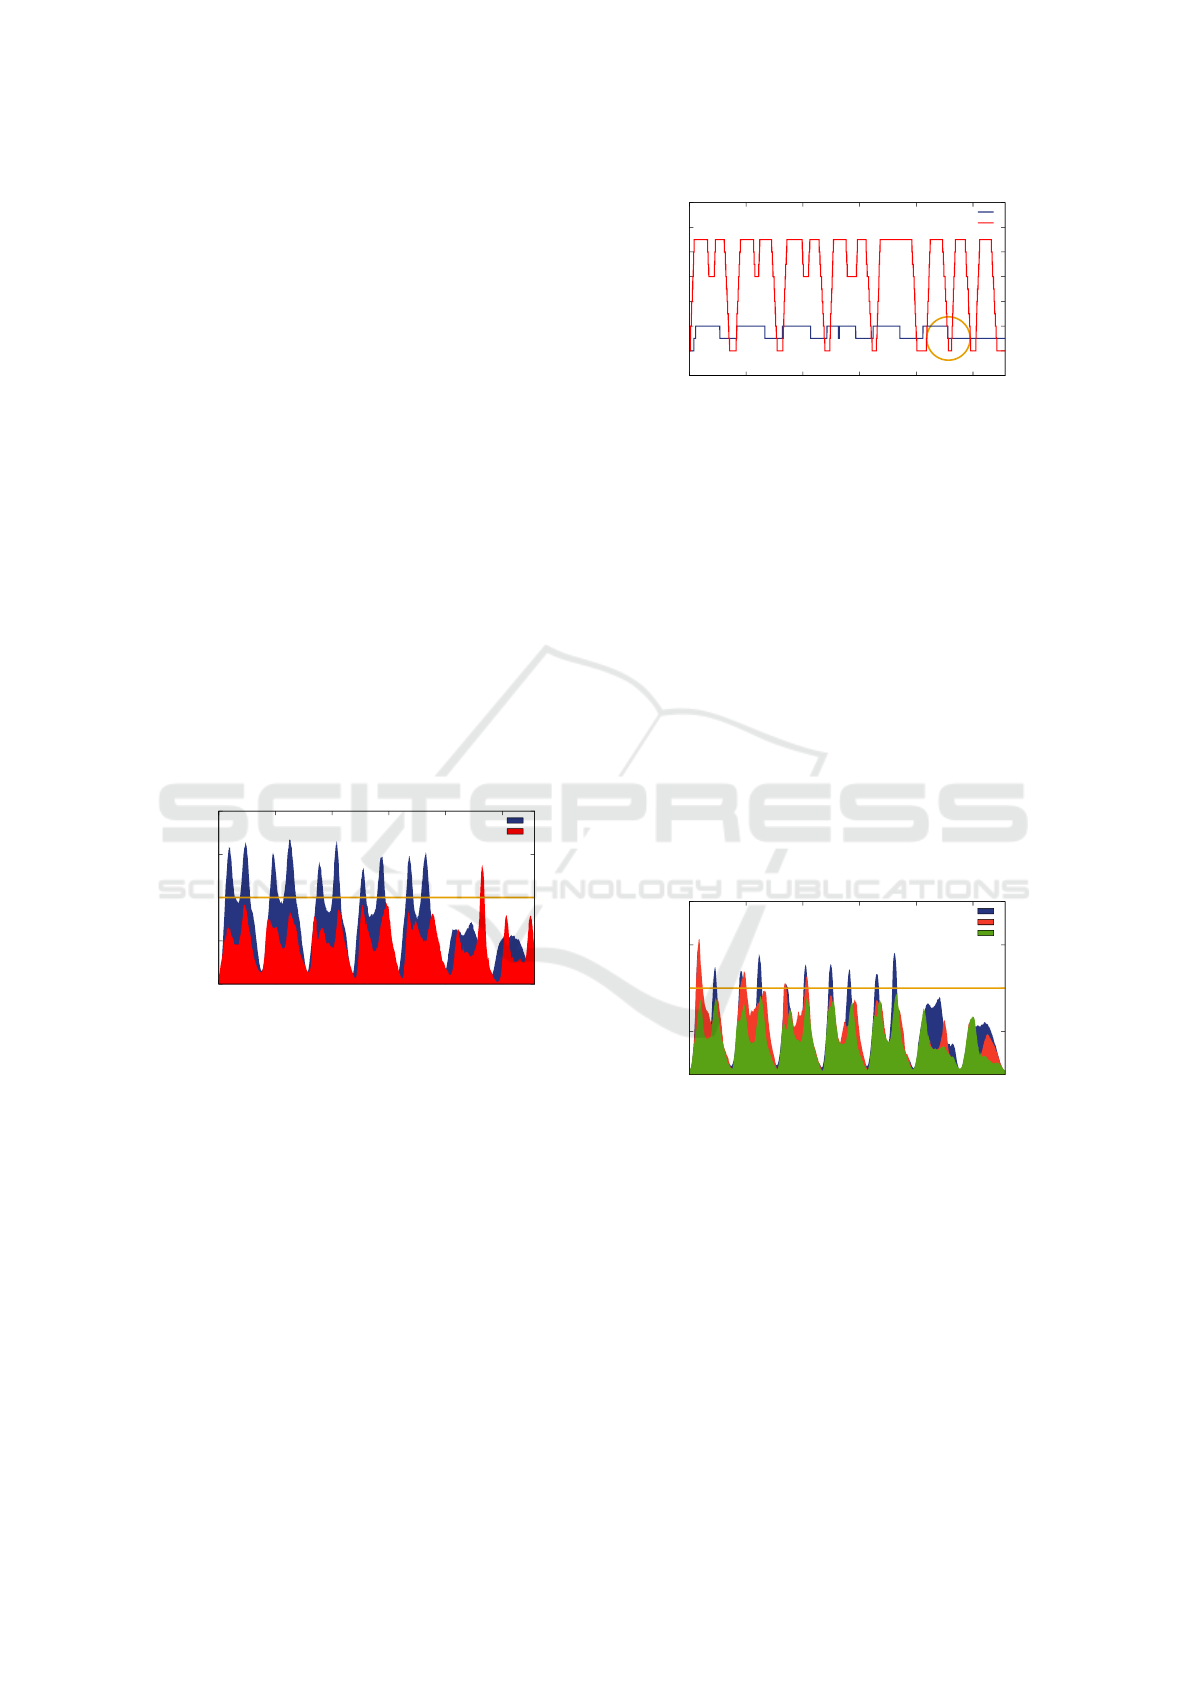
Figure 12 shows the number of pods used by Fla-
vor and Imdoukh et al. strategy during the same exe-
cution period corresponding to one week. In the sixth
day, we can identify the cause of such raise in the
latency: the Flavor scaling policy reduced twice the
number of replicas (indicated by the circle), resulting
in a fall from 11 to 2, but in sequence it had to in-
crease the number of replicas again, without time to
do it before an SLA violation happened. This case
illustrates that Flavor can also suffer SLA violations,
for example, when the voting policy based on the la-
tency predicted decides that it is safe to reduce the
number of replicas, however a sudden increase in the
number of requests happens next.
0
2
4
6
8
10
12
14
0 30 60 90 120 150
Number of Pods
Time (hours)
Imdoukh et al.
Flavor
Figure 12: Resource utilization by Flavor. The circle shows
an excessive downscale that results in an SLA violation.
4.4 Proactive Scaling
To demonstrate the benefits of Flavor’s long-term
prediction horizon to avoid SLA violations, we also
compare its performance with the reactive scaling
approach from the k8s Horizontal Pod Autoscaler
(HPA). The HPA automatically scales the number of
pods, by adding or removing pod replicas based on
system or performance metrics and defined thresh-
olds. We configured the Kubernetes auto-scaler to
monitor the database average query latency with a
threshold of 450ms, and after that with 800ms. The
upper and lower limits for the number of pods that
can be set by the Kubernetes auto-scaler were 8 and
2. The latency results of our experiments are shown
in Figure 13. In all experiments we are considering a
database query latency SLA of 1000ms.
0
0.5
1
1.5
2
0 30 60 90 120 150
Latency (s)
Time (hours)
HPA 800ms
HPA 450ms
Flavor
Figure 13: Average latency for MySQL service running the
Bustracker benchmark managed by HPA and Flavor.
The HPA with a threshold of 450ms presented less
SLA violations compared to the HPA with a threshold
of 800ms, due to the fact that this configuration is
more latency sensitive. In contrast, our proposal
solution presents a significant reduction in the overall
database query latency and less violations compared
to the HPA reactive approach due to its proactive
behavior. The reactive behavior of HPA evidently
presented a delay in the decision-making even with
different threshold configurations because, unlike our
CLOSER 2022 - 12th International Conference on Cloud Computing and Services Science
82

approach, the HPA only acts after or during the
appearance of a peak.
Next, we analyze the resource utilization of Flavor
and HPA. Table 1 shows the total amount of pods per
hour for the comparison of Flavor and HPA, whose
latency is illustrated in Figure 13, for a single week
of workload execution. The values are computed as
the sum of the number of pods, over the entire exe-
cution period, aggregated per hour using average and
maximum.
Table 1: Comparison of Flavor with the HPA in terms of
total number of pods used per hour.
Mechanism Average Maximum
Flavor 1217.21 1256
HPA (450ms) 1155.17 1206
HPA (800ms) 990.13 1029
HPA configured with a lower latency threshold of
450ms presents higher utilization in terms of the num-
ber of replicas per hour than the higher latency thresh-
old configuration due to its latency sensitivity, which
means that this configuration makes the HPA increase
the number of pods more frequently and sooner than
with the threshold of 800ms. Moreover, due to the
proactive behavior of Flavor, the resource utilization
was a little higher than the HPA with 450ms, because
it forecasts and tries to avoid peaks of latency mo-
ments before it occurs. We see that although Flavor
presented a higher level of resources utilization, its
capacity to manage the provisioning levels was effi-
cient in reducing the latency and avoiding SLA viola-
tions compared to the HPA strategy.
5 DISCUSSION
Other Machine Learning Models. Flavor uses an
LSTM model to predict upcoming SLA violations.
LSTM usually performs better than simpler models
such as ARIMA on time-series forecasting (Siami-
Namini et al., 2018). It achieves that with an in-
ternal memory that stores long-term dependencies
and understands how this information remains rele-
vant for making decisions. LSTM requires more re-
sources than other RNNs like the Gated Recurrent
Unit (GRU), which also handles long-term dependen-
cies, but implements fewer gates. On the other hand,
LSTM is more accurate in large datasets (Shewalkar,
2019). In such cases, significant performance differ-
ences mostly rely on training strategy and hyperpa-
rameter tunning rather than on the models’ architec-
ture.
Prediction Generalization. Generalization refers to
the ability of a model to adapt properly to new, previ-
ously unseen data (Barbiero and Tonda, 2020). Even
though we have trained Flavor using performance
metrics collected from multiple execution scenarios
(e.g., using different numbers of pods and interfer-
ing services), that is certainly not enough to create
a single model that is able to fit all possible cloud
scenarios. In particular, different applications may
have completely different usage patterns. We envi-
sion cloud providers to run multiple instances of Fla-
vor in practice, each one specialized in a given service
type (e.g., a database or web service). In addition,
further generalizations targeted at machine learning
models for time series forecasting are possible (e.g.,
(Borovykh and Boht
´
e, 2019), (Godfrey and Gashler,
2017)). We leave exploring them as future work.
Other Elasticity Approaches. Flavor immediately
scales up services whenever the model predicts that
service KPIs will exceed the SLA threshold, while
it uses a voting-based scale-down approach that re-
duces service instances gradually to avoid overprovi-
sioning. This heuristic lacks flexibility compared to
other approaches when the model itself outputs the
ideal number of service instances (Toka et al., 2020).
On the other hand, the voting scheme avoids precip-
itated scaling decisions that may lead to SLA viola-
tions in scenarios with workload spikes. Besides, Fla-
vor’s scaling decision-making relies on KPI predic-
tion rather than workload forecasting. Consequently,
it avoids misleading decisions on scenarios contain-
ing performance interference (see Section II-C for a
concrete example).
6 RELATED WORK
Workload Prediction. In addition to the work of Im-
doukh et al. (Imdoukh et al., 2019), which we detailed
in Section 4.3, a few other researches also propose to
tackle the SLA violation problem by predicting an ap-
plication workload.
Toka et al. (Toka et al., 2020) proposes an exten-
sion for the Horizontal Pods Autoscaler (HPA), the
native scaling mechanism from Kubernetes. They aim
to perform proactive scaling decisions by converting
the prediction of the arrival request rate to a desired
number of instances of the application. To do this,
they use three different strategies combined, an au-
toregressive (AR) model, an LSTM, and an unsuper-
vised learning method called Hierarchical Temporal
Memory (HTM). Constant evaluation of these models
is done during the execution of the system in order to
decide which one is currently performing better. The
best performing model is then used to predict the fu-
ture request rate. If all models are performing below a
Predicting and Avoiding SLA Violations of Containerized Applications using Machine Learning and Elasticity
83

Table 2: Comparison between Flavor and related studies.
Proposal ML Technique Model Output Scaling
(Rossi et al., 2019) Q-learning, Dyna-Q, model-based approach CPU usage Horizontal/Vertical
(Imdoukh et al., 2019) LSTM Request arrival Horizontal
(Cruz Coulson et al., 2020) LSTM, Regression models Request arrival NA
(Toka et al., 2020) Ensemble (AR, LSTM, HTM) Request arrival Horizontal
(Goli et al., 2021) Random Forest, Linear Regression, SVR CPU usage, request arrival Horizontal
This Work (Flavor) LSTM Service KPIs Horizontal
threshold, the standard HPA is used. Next, the authors
map the predicted request rate to a number of desired
pods based on a resource profile for the application,
built beforehand by stressing the application.
Coulson et al. (Cruz Coulson et al., 2020) propose
an auto-scaling system for web applications based on
microservices architecture, which uses a hybrid ma-
chine learning model consisting of a stacked LSTM
and a regression model. LSTM is used to predict
the requests mix for the application’s microservices
in the near future, and this information is used by
the regression model to predict the average request
response time. The goal is to recommend scaling ac-
tions based on which microservice should be scaled at
the moment. Different regression models were evalu-
ated, including linear, ridge, lasso, and random forest
regression.
Container Performance Prediction. Rossi et al.
(Rossi et al., 2019) focus on controlling the horizontal
and vertical elasticity of container-based applications.
The authors present solutions based on reinforcement
learning techniques like Q-Learning, Dyna-Q and a
proposed model-based reinforcement learning tech-
nique that exploits what is known or estimated about
the system dynamics. The main objective was to cope
with varying applications workloads from small vari-
ations to sudden workload peaks as well as to avoid
wastage of computational resources. They evaluated
the proposed policies by comparing the three models,
performing horizontal or vertical scaling (5-action),
and performing jointly the two dimensions of scale
(9-action) with prototype-based experiments. Consid-
ering the violation of response time, the best result for
the 5-action model was 12.10% and for the 9-action
model was 24.11% for the model-based in both cases.
However, we have not used this paper for the state-of-
the-art comparison as we focus on horizontal scaling,
to make full use of the fast deployment and deletion
of pods that Kubernetes provide. We also focus on
forecasting a possible SLA violation moments before
it happen.
Goli et al. (Goli et al., 2021) propose a new
auto-scaling approach for containerized microser-
vices called Waterfall. The proposed solution aims
to reduce overprovisioning while avoiding perfor-
mance issues caused by a lack of resources. For this,
Waterfall uses machine learning models (i.e., Lin-
ear Regression, Random Forest, and Support Vec-
tor Regressor) to predict CPU usage and request ar-
rival rate for microservices. Based on this informa-
tion, the resource capacity provisioned for microser-
vices is proactively adjusted using a horizontal scal-
ing scheme. Although this work also performs pre-
dictions to avoid performance issues and waste of re-
sources, we do not focus on containerized microser-
vices management in this paper. For this reason, we
do not compare their solutions against ours in the
evaluation section.
Our Contributions. In summary, all related stud-
ies use machine learning techniques to predict SLA
violations, proactively triggering scaling mechanisms
to avoid such performance issues. What sets Flavor
apart from these solutions is the information used to
predict SLA violations. Prior studies infer SLA viola-
tions based on workload variations, relying on the cor-
relation between workload variations and SLA viola-
tions, leading to inaccurate predictions when SLA vi-
olation are caused by external factors such as perfor-
mance interference issues. Flavor avoids that kind of
issue by predicting SLA violations based on upcom-
ing variations in the performance metrics that make
up the SLAs. Table 2 compares Flavor to the existing
works discussed in this section.
7 CONCLUSIONS
This paper presents Flavor, a machine learning-based
system capable of predicting SLA violations of con-
tainerized applications. Unlike existing strategies that
rely on workload prediction, Flavor uses a deep neu-
ral network to identify upcoming SLA violations by
predicting service performance metrics, preventing
SLA violations that are not caused by workload spikes
from going unnoticed.
We evaluate Flavor against other proactive and re-
active approaches through experiments using work-
load patterns based on datasets from a real appli-
cation. The results obtained from the experiments
demonstrate that Flavor could avoid most SLA vio-
lations even in environments where there is interfer-
ence, unlike other approaches based on workload pre-
diction. As future work, we intend to investigate dif-
ferent policies for scaling services with Flavor.
CLOSER 2022 - 12th International Conference on Cloud Computing and Services Science
84

ACKNOWLEDGEMENTS
This work was supported by the PDTI Program,
funded by Dell Computadores do Brasil Ltda (Law
8.248 / 91). The authors acknowledge the High-
Performance Computing Laboratory of the Pontifical
Catholic University of Rio Grande do Sul for provid-
ing resources for this project.
REFERENCES
Anwar, A., Sailer, A., Kochut, A., and Butt, A. R. (2015).
Anatomy of cloud monitoring and metering: A case
study and open problems. In Proceedings of the 6th
Asia-Pacific Workshop on Systems, pages 1–7.
Armbrust, M., Fox, A., Griffith, R., Joseph, A. D., Katz,
R., Konwinski, A., Lee, G., Patterson, D., Rabkin, A.,
Stoica, I., et al. (2010). A view of cloud computing.
Communications of the ACM, 53(4):50–58.
Balalaie, A., Heydarnoori, A., Jamshidi, P., Tamburri,
D. A., and Lynn, T. (2018). Microservices migra-
tion patterns. Software: Practice and Experience,
48(11):2019–2042.
Barbiero, Pietro, G. S. and Tonda, A. (2020). Modeling
generalization in machine learning: A methodological
and computational study. In arXiv:2006.15680.
Borovykh, Anastasia, C. W. O. and Boht
´
e, S. M. (2019).
Generalization in fully-connected neural networks for
time series forecasting. In Journal of Computational
Science 36.
Cerqueira, V., Torgo, L., and Mozeti
ˇ
c, I. (2020). Evaluating
time series forecasting models: An empirical study on
performance estimation methods. Machine Learning,
109(11):1997–2028.
Cruz Coulson, N., Sotiriadis, S., and Bessis, N. (2020).
Adaptive microservice scaling for elastic applications.
IEEE Internet of Things Journal, 7(5):4195–4202.
Fu, S., Mittal, R., Zhang, L., and Ratnasamy, S. (2020).
Fast and efficient container startup at the edge via de-
pendency scheduling. In 3rd {USENIX} Workshop on
Hot Topics in Edge Computing (HotEdge 20).
Gan, Y., Zhang, Y., Hu, K., Cheng, D., He, Y., Pancholi, M.,
and Delimitrou, C. (2019). Seer: Leveraging big data
to navigate the complexity of performance debugging
in cloud microservices. In Proceedings of the twenty-
fourth international conference on architectural sup-
port for programming languages and operating sys-
tems, pages 19–33.
Gannon, D., Barga, R., and Sundaresan, N. (2017). Cloud-
native applications. IEEE Cloud Computing, 4(5):16–
21.
Godfrey, L. B. and Gashler, M. S. (2017). Neural decompo-
sition of time-series data for effective generalization.
In IEEE transactions on neural networks and learning
systems.
Goli, A., Mahmoudi, N., Khazaei, H., and Ardakanian, O.
(2021). A holistic machine learning-based autoscaling
approach for microservice applications. In Interna-
tional Conference on Cloud Computing and Services
Science (CLOSER), pages 190–198.
Hochreiter, S. and Schmidhuber, J. (1997). Long short-term
memory. Neural computation, 9(8):1735–1780.
Imdoukh, M., Ahmad, I., and Alfailakawi, M. G. (2019).
Machine learning-based auto-scaling for container-
ized applications. Neural Computing and Applica-
tions, pages 1–16.
Ma, L., Van Aken, D., Hefny, A., Mezerhane, G., Pavlo,
A., and Gordon, G. J. (2018). Query-based workload
forecasting for self-driving database management sys-
tems. In Proceedings of the 2018 International Con-
ference on Management of Data, pages 631–645.
Patel, P., Ranabahu, A. H., and Sheth, A. P. (2009). Service
level agreement in cloud computing.
Rossi, F., Nardelli, M., and Cardellini, V. (2019). Hori-
zontal and vertical scaling of container-based appli-
cations using reinforcement learning. In 2019 IEEE
12th International Conference on Cloud Computing
(CLOUD), pages 329–338. IEEE.
Rotman, M. and Wolf, L. (2020). Shuffling recurrent neural
networks. In arXiv:2007.07324.
Shewalkar, A. (2019). Performance evaluation of deep neu-
ral networks applied to speech recognition: Rnn, lstm
and gru. Journal of Artificial Intelligence and Soft
Computing Research, 9(4):235–245.
Siami-Namini, S., Tavakoli, N., and Namin, A. S. (2018). A
comparison of arima and lstm in forecasting time se-
ries. In 2018 17th IEEE International Conference on
Machine Learning and Applications (ICMLA), pages
1394–1401. IEEE.
Soh, M. (2016). Learning cnn-lstm architectures for image
caption generation. In Dept. Comput. Sci., Stanford
Univ.
Tang, Liang, T. L. and Shwartz, L. (2012). Discovering
lag intervals for temporal dependencies. In 18th ACM
SIGKDD.
Toka, L., Dobreff, G., Fodor, B., and Sonkoly, B. (2020).
Adaptive ai-based auto-scaling for kubernetes. In
2020 20th IEEE/ACM International Symposium on
Cluster, Cloud and Internet Computing (CCGRID),
pages 599–608. IEEE.
Zhang, Q., Liu, L., Pu, C., Dou, Q., Wu, L., and Zhou, W.
(2018). A comparative study of containers and vir-
tual machines in big data environment. In 2018 IEEE
11th International Conference on Cloud Computing
(CLOUD), pages 178–185. IEEE.
Zhao, J., Huang, F., Lv, J., Duan, Y., Quin, Z., Li, G., and
Tian, G. (2020). Do rnn and lstm have long memory.
In ICML.
Predicting and Avoiding SLA Violations of Containerized Applications using Machine Learning and Elasticity
85
