
An Experimental Study on Usability and User Experience Evaluation
Techniques in Mobile Applications
Eduardo A. Jesus
1 a
, Guilherme C. Guerino
2 b
, Pedro Valle
3 c
, Walter Nakamura
4 d
,
Ana Oran
5 e
, Renato Balancieri
1 f
, Thiago Coleti
6 g
, Marcelo Morandini
7 h
,
Bruna Ferreira
8 i
and Williamson Silva
9 j
1
Universidade Estadual do Paraná (UNESPAR - Apucarana), Av. Minas Gerais, 5021, Apucarana, Paraná, Brazil
2
Universidade Estadual de Maringá (UEM), Avenida Colombo, 5790, Maringá, Paraná, Brazil
3
Universidade Federal de Juiz de Fora (UFJF), Rua José Lourenço Kelmer - Martelos, Juiz de Fora, Minas Gerais, Brazil
4
Instituto Federal do Amazonas (IFAM), BR 230, KM 7, Zona Rural, Humaitá, Amazonas, Brazil
5
Universidade Federal do Amazonas (UFAM), Av. General Rodrigo Octavio, 1200, Manaus, Amazonas, Brazil
6
Universidade Estadual do Norte do Paraná (UENP), Rodovia BR-369 Km 54, Bandeirantes, Paraná, Brazil
7
Universidade de São Paulo (USP-EACH), Av. Arlindo Bettio, 1000, Sao Paulo, São Paulo, Brazil
8
Pontifícia Universidade Católica do Rio de Janeiro (PUC-Rio), Rua Marquês de São Vicente, 225, Rio de Janeiro, Brazil
9
Universidade Federal do Pampa (UNIPAMPA), Avenida Tiarajú, 810, Ibirapuitã, Alegrete, Rio Grande do Sul, Brazil
Keywords:
Usability, User Experience, Usability and UX Evaluation, Human-Computer Interaction.
Abstract:
Usability and User Experience (UX) are two quality attributes of Human-Computer Interaction (HCI) relevant
to the software development process. Thus, to verify the quality of a system, researchers and developers
investigate this area, resulting in different Usability and UX evaluation techniques to improve the quality of
applications. However, most of them verify only one of these criteria, being necessary, in many cases, to use
more than one technique to evaluate an application in both aspects. Therefore, this research aims to present
an experimental study to compare the efficiency, effectiveness, and acceptance of two inspection techniques,
Userbility and UX-Tips, which jointly evaluate the Usability and UX of mobile applications. In this way, 99
volunteer participants used the techniques to identify defects in two mobile applications. After the evaluation,
the participants answered an acceptance questionnaire about the techniques used. The quantitative comparison
results show that the techniques have no significant difference regarding efficiency and effectiveness. However,
in terms of participant acceptance, Userbility achieved higher rates of usefulness and future usage intentions,
while UX-Tips achieved better rates related to ease of use.
a
https://orcid.org/0000-0002-6010-3269
b
https://orcid.org/0000-0002-4979-5831
c
https://orcid.org/0000-0002-6929-7557
d
https://orcid.org/0000-0001-5451-3109
e
https://orcid.org/0000-0002-6446-7510
f
https://orcid.org/0000-0002-8532-2011
g
https://orcid.org/0000-0002-1078-4334
h
https://orcid.org/0000-0001-5402-9544
i
https://orcid.org/0000-0000-0000-0000
j
https://orcid.org/0000-0003-1849-2675
1 INTRODUCTION
With the expansion of interactive systems nowa-
days, two quality criteria of Human-Computer In-
teraction (HCI) have become important in the soft-
ware development process: Usability and User Ex-
perience (UX). Usability is defined as “the capa-
bility of the software product to be understood,
learned, operated, attractive to the user, and com-
pliant to standards/guidelines, when used under spe-
cific conditions” (ISO25010, 2011). Furthermore,
Usability brings as a principle that, by easily us-
ing an application, the user will never forget how
340
Jesus, E., Guerino, G., Valle, P., Nakamura, W., Oran, A., Balancieri, R., Coleti, T., Morandini, M., Ferreira, B. and Silva, W.
An Experimental Study on Usability and User Experience Evaluation Techniques in Mobile Applications.
DOI: 10.5220/0011083000003179
In Proceedings of the 24th International Conference on Enterprise Information Systems (ICEIS 2022) - Volume 2, pages 340-347
ISBN: 978-989-758-569-2; ISSN: 2184-4992
Copyright
c
2022 by SCITEPRESS – Science and Technology Publications, Lda. All rights reserved

to use it, without frustrations that affect his judg-
ment (Nielsen, 1994). Thus, Usability is reflected by
performance and user satisfaction when using an ap-
plication. Although Usability is essential for accept-
ing technologies, its application challenges industry
and academia, which refers to evaluating the accep-
tance of these applications from an emotional user
perspective (da Silva Franco et al., 2019).
In this sense, UX emerged as an area that stud-
ies the experience generated by users. According to
ISO9241-210 (2011), UX is “a person’s perceptions
and responses that result from the use and/or antic-
ipated use of a product, system, or service.” Has-
senzahl (2008) comments that UX evaluates soft-
ware quality from two perspectives: pragmatic (con-
cerned with the effectiveness and efficiency of using
an application) and hedonic (concerned with the emo-
tions/feelings of users during interaction with the ap-
plication).
Usability and UX evaluations allow software pro-
fessionals to perceive the developed system and, from
the results, they can make improvements and evalu-
ations. Thus, the evaluations help to identify, clas-
sify, and mitigate problems in order to make the in-
terface more friendly since it allows the verification
of characteristics in the applications that are not yet
well understood by users, which can cause discom-
fort, frustration, and insecurity when using the de-
sired product (Sharp et al., 2019). From the re-
sults of Rivero and Conte (2017), we realized that
there are still too few experimental studies that com-
pare these techniques and methodologically discover
which technique is more feasible, more efficient, and
in which situation they are effective.
Therefore, this paper presents a comparative study
between two Usability and UX evaluation techniques
focused on mobile applications: (1) the Userbil-
ity (Nascimento et al., 2016a); and (2) the UX-Tips
(Marques et al., 2019). We selected these techniques
because both are based on heuristics/guidelines that
support the identification of Usability and UX prob-
lems. Besides, both techniques enable users to report
their emotions and feelings when using the mobile ap-
plication. To guide this research, we propose the fol-
lowing Research Questions (RQ):
• RQ1: Is there difference in the efficiency and ef-
fectiveness of Userbility and UX-Tips for Usabil-
ity and UX evaluation of mobile devices?
• RQ2: What are the participants’ perceptions of
Userbility and UX-Tips based on ease of use, use-
fulness, and intention to use indicators?
In this study, 99 volunteer participants used both
techniques to evaluate the Usability and UX of the
TripAdvisor and Airbnb apps. In order to analyze
the performance of each technique, we measure and
compare them in terms of effectiveness and effi-
ciency. Also, participants expressed their percep-
tions about ease of use, usefulness, and intention to
use each method through a Technology Acceptance
Model (TAM) adapted (Venkatesh and Davis, 2000).
The remainder of this paper is organized as fol-
lows: Section 2 presents the theoretical background
on Usability and UX evaluation techniques, as well as
on the two evaluation techniques used in this study;
Section 3 describes the methodology of the experi-
mental study; Section 4 presents the results obtained
and the discussion; Section 5 shows the conclusion
and future perspectives.
2 USABILITY AND UX
EVALUATION TECHNIQUES
Usability and UX assessments are important steps in
verifying the quality of applications. Usability evalu-
ation is related to functional metrics of the system,
such as effectiveness, efficiency, and user satisfac-
tion (ISO9241-210, 2011). Besides the pragmatic
aspects related to functional metrics, UX evaluation
also assesses subjective (hedonic) aspects, focusing
on the user’s feelings, emotions, and motivations (im-
portant attributes to define a good UX) (Guerino et al.,
2021). Usability and UX evaluation techniques de-
termine the balance point between the goals of the
application and the users’ needs by identifying is-
sues (Nascimento et al., 2016a). However, devel-
opers need to adopt different techniques to evaluate
the Usability and UX of a mobile application since
they are usually concepts addressed separately by the
techniques. In this sense, researchers have developed
techniques to evaluate Usability and UX jointly (usu-
ally called UUX), whose goal is to integrate the evalu-
ation of attributes of these two criteria, namely: User-
bility (Nascimento et al., 2016a); and UX-Tips (Mar-
ques et al., 2021). These two techniques were se-
lected because both techniques: (a) can be used by
experienced and non-experienced users in UUX eval-
uations; (b) allow users to report subjective aspects
(emotions, feelings) perceived during the use of the
application; (c) they are not generic techniques, they
evaluate the UUX taking into consideration also the
specific aspects of mobile applications (limited pro-
cessing capability and power, battery life and other).
An Experimental Study on Usability and User Experience Evaluation Techniques in Mobile Applications
341

2.1 Userbility
Userbility is a technique proposed by Nascimento
et al. (2016a) that integrates Usability with UX eval-
uation in mobile applications, assisting evaluators
with little experience in HCI (Nascimento et al.,
2016a,b). Userbility is composed of: (1) twelve Us-
ability heuristics for mobile applications; (2) Usabil-
ity check items with examples for each item; (3-
4) two UX questions for each Usability heuristic,
and (5) a satisfaction evaluation item. Usability has
been evolved experimentally and adopted to evalu-
ate different applications. Nascimento et al. (2016b)
evaluated an educational application (“In the Tip of
the Tongue”) using Userbility. The results showed
that Userbility allows identifying fewer false positives
(discrepancies pointed out by users but not defects)
and more unique problems and improvement sugges-
tions for the applications.
2.2 UX-Tips
UX-Tips is a technique proposed by Marques et al.
(2019) to identify UX problems by evaluating the sub-
jective and specific aspects of software applications
during inspections (expert evaluations) or user testing.
UX-Tips can be used in applications still in the devel-
opment phase or even in applications already consol-
idated in the market. UX-Tips allows evaluating the
adequacy of the applications to the items of the tech-
nique, validating if the application provides a positive
experience to the users. UX-Tips has 13 dimensions
that evaluate UX and 29 evaluative items (Marques
et al., 2021). The items present in each dimension
assist evaluators in identifying specific problems that
hinder UX. As Userbility, UX-Tips have been evolv-
ing and improving. Marques et al. (2021) conducted
two experimental studies in the most recent study, one
in academic and the other in an industry context. The
results showed that UX-Tips performed better in ef-
fectiveness and efficiency in identifying defects. The
results also enabled the researchers to understand the
leading causes of negative UX.
3 EXPERIMENTAL STUDY
We used the guidelines proposed by Wohlin et al.
(2012) to perform planning.
3.1 Context
We selected two mobile apps to be objects evaluated
by the two techniques: TripAdvisor and Airbnb. Both
apps have similar characteristics and functions fo-
cused on the travel segment, have a sizeable monthly
user base, and are available in the leading app stores,
both for iOS and Android. TripAdvisor is a search
service based on reviews from travelers who enter
their comments about a particular place or attraction.
Airbnb is an app that allows individuals to rent out all
or part of their own homes as a form of extra accom-
modation. The study was conducted remotely with
undergraduate students (second semester 2020), who
served as novice inspectors, from four different insti-
tutions: Universidade Estadual do Paraná, Universi-
dade Estadual do Norte do Paraná, Universidade Es-
tadual de Maringá e Universidade de São Paulo.
3.2 Hypotheses
The study was planned and conducted in order to test
the following hypotheses (null and alternative, respec-
tively):
• H
01
: There is no difference between Userbility
and UX-Tips concerning the efficiency.
• H
A1
: There is difference between Userbility and
UX-Tips concerning the efficiency.
• H
02
: There is no difference between Userbility
and UX-Tips concerning the effectiveness.
• H
A2
: There is difference between Userbility and
UX-Tips concerning the effectiveness.
3.3 Participants
A total of 99 students voluntarily participated in this
study. All participants turned in defect reports for
both techniques, participated in the second day of
the study, and filled the consent form. The partici-
pants answered the profile characterization question-
naire that assessed their experience in app use in gen-
eral and use of the Airbnb and TripAdvisor apps.
Regarding experiences, this was a self-classification,
i.e., participants classified themselves according to
the number and type of previous experiences. Re-
garding the use of apps, the answers could be: (1) I
do not use a tablet and/or mobile; I only access them
through the computer; (2) I only use a tablet and/or
mobile, but not frequently; (3) I use a tablet and/or
mobile, on average, three and four hours a day dur-
ing the week; (4) I use a tablet and/or mobile more
than four hours a day during the week. Regarding the
level of knowledge on Airbnb and TripAdvisor apps,
participants could classify themselves into (i) never
heard of nor used these apps; (ii) have heard of both
apps (Airbnb and TripAdvisor), but never used them;
ICEIS 2022 - 24th International Conference on Enterprise Information Systems
342
(iii) have used the Airbnb app, but never used the Tri-
pAdvisor app; (iv) have used the TripAdvisor app, but
never used the Airbnb app, or (v) have used both apps
(Airbnb and TripAdvisor).
Regarding the participants’ responses, 95 reported
that they had previous experience with mobile apps,
while four did not answer this question. Regarding
the use of the Airbnb and TripAdvisor apps: 14 had
never heard of the apps (Airbnb and TripAdvisor); 59
had heard of both apps (Airbnb and TripAdvisor) but
had never used them; 18 had used the Airbnb app
but had never used the TripAdvisor app; only 5 had
used both apps (Airbnb and TripAdvisor). Finally,
no participant claimed to have ever used the TripAd-
visor app but never used the Airbnb app. The data
collected also shows that three of the participants did
not answer the pre-assessment questionnaire. All data
participants can be found in the online spreadsheet
1
.
3.4 Experimental Design
Participants were divided into two groups, Group 01
and Group 02. Participants were assigned to each
group using a completely randomized design. Group
1 consisted of 50 participants, and Group 2 consisted
of 49 participants. On the first day of the study, Group
1 participants used the Userbility technique, and on
the second day, they used UX-Tips. For Group 2,
the process was reversed. They used the UX-Tips on
the first day, and on the second day, Userbility. Both
groups evaluated the TripAdvisor app on the first day
and the Airbnb app on the second day.
3.5 Indicators
The independent variables of this study are the UUX
evaluation techniques (Userbility and UX-Tips), and
the dependent variables are the indicators of effi-
ciency, effectiveness, usefulness, ease of use, and in-
tention to use. In this study, the definitions of effi-
ciency and effectiveness were based on Valentim et al.
(2015), where: efficiency was calculated as the ra-
tio between the number of defects detected and the
time spent in the inspection process; and effective-
ness was calculated as the ratio between the num-
ber of defects detected and the total number of exist-
ing (known) defects, respectively. After participants
used each evaluation technique, they completed on-
line post-inspection questionnaires based on the Tech-
nology Acceptance Model (TAM) (Venkatesh and
Davis, 2000). The TAM is based on three indica-
tors (Venkatesh and Davis, 2000): Perceived ease
of use, the degree to which individuals perceive how
1
https://bit.ly/tableiceis2022paper148
easy it is to use the technology; Perceived usefulness,
the subjective perception of users where they believe
that using certain technologies can improve their job
performance; Intention to use, reflects the user’s de-
sire to use the technology in the future. Based on their
use of the techniques, participants selected their de-
gree of agreement with the statements defined on the
questionnaire. Each questionnaire item was answered
on a five-point Likert scale based on Chyung et al.
(2017) with the following response options: Strongly
Disagree, Partially Disagree, Neutral, Partially Agree,
and Strongly Agree. Table 1 presents the statements
based on the indicators of the TAM.
Table 1: Post-inspection questionnaire items.
Perceived usefulness
U01 Using the technique improves my performance when
reporting my experience with the application.
U02 Using the technique improves my productivity by re-
porting my experience with the application.
U03 Using the technique allows me to fully report on as-
pects of my experience.
U04 I find the technique useful in reporting my experience
with the application.
Perceived Ease of Use
E01 The technique was clear and easy to understand.
E02 Using the technique did not require much mental ef-
fort.
E03 I find this is an easy technique to use.
E04 I find it easy to report my experience with an applica-
tion using the technique.
Intention to use
S01 Assuming I have access to the technique, I intend to
use it to evaluate my experience with an application.
S02 Given that I have access to the technique, I predict that
I would use it to evaluate my experience with an appli-
cation.
S03 I plan to use the technique to evaluate my experience
with an application in the future.
3.6 Instrumentation
Several online artifacts were used to support the ex-
periment: the consent form, the questionnaire for
the participant experience characterization, the docu-
ments with study preparation scripts and instructions
for the evaluation of the applications, presentation
with a tutorial on how to use the techniques, the adap-
tation of both techniques (Userbility and UX-Tips) to
online forms, post-inspection questionnaire, and on-
line rooms for conducting the experiment.
3.7 Preparation
Before the study, for each group, a 15-minute pre-
sentation on using the technique was shown. Simi-
lar examples of using the technique to identify UUX
problems were shown for both groups. Afterward, the
An Experimental Study on Usability and User Experience Evaluation Techniques in Mobile Applications
343

authors answered the doubts of the participants. The
authors ensured that all doubts were resolved for bet-
ter experiment execution.
3.8 Execution
As mentioned earlier, due to the pandemic caused by
COVID-19, the study was conducted remotely via on-
line meetings with each class via Google Meet. The
study was conducted in six classes from four differ-
ent universities on different days for each class. One
week before the execution of each study, we sent the
participants the consent and profile characterization
forms. After this, the participants were assigned to
each technique using completely randomized design:
Group 1 and Group 2. To avoid bias during the exper-
iment and allow all students to attend the training and
perform the UUX assessment using the correct tech-
nique, specific online rooms were created for each
one. On the first day, each participant received the
artifacts described in Subsection 3.6. Then, they eval-
uated the TripAdvisor app (Group 1 with the User-
bility technique and Group 2 with the UX-Tips tech-
nique). On the second day, both groups evaluated the
Airbnb app. However, the order of technique use was
reversed, i.e., Group 1 used the UX-Tips technique,
and Group 2 used the Userbility technique. Each par-
ticipant performed five tasks in each app. The tasks
to be performed in the Airbnb app are: (1) Search for
and add three experiences to a saved list; (2) Search
for a stay for the trip; (3) Search for and add three
restaurants to the trip itinerary/plan on different days;
(4) Invite a friend to the stay and experience list; (5)
Invite a friend to the itinerary. The tasks performed
in the TripAdvisor application are: (1) Check the top
five attractions in a city you are interested in visiting;
(2) Choose one of the attractions to consider reviews;
(3) Find a restaurant near the attraction you chose and
view restaurant details such as average price, meals,
and hours of operation; (4) Create a trip to somewhere
of your choice; (5) Edit the trip created and add dates.
At the end of each evaluation day, participants
submitted files via email containing all of the evalua-
tion information (participant name, list of UUX prob-
lems identified, and time spent performing the tasks).
In addition, after each evaluation, all participants
completed a TAM-based online post-inspection ques-
tionnaire, which assessed the ease of use, usefulness,
and future use intent of each technique employed dur-
ing the inspection. After that, the researchers involved
grouped the individual discrepancies of all the par-
ticipants into a single list. The researchers removed
the names of the subjects and added a reference ID to
each one. Finally, the list was evaluated by a group
of six Usability and UX expert researchers, who de-
cided which of the discrepancies noted on the list
were unique and/or duplicate (equivalent discrepan-
cies noted by more than one inspector). After that, the
researchers grouped the reported discrepancies into
genuine defects or false positives.
4 RESULTS AND DISCUSSIONS
4.1 Efficiency and Effectiveness Results
(RQ1)
In total, summing the evaluations of the two apps us-
ing both techniques (UX-Tips and Userbility), partic-
ipants reported 764 discrepancies related to possible
UUX problems in the two mobile apps. After the dis-
crimination pooling, 269 UUX problems were arrived
at in the two apps. Table 2 presents the number of
main problems for each evaluation.
Table 2: Number of main problems found.
Main Problems by Application
Techniques TripAdvisor Airbnb Total
Userbility 59 77 136
UX-Tips 78 55 133
The participants who used Userbility identified
between 1 and 11 defects and spent on average about
0.08 to 2.43 hours, presenting an average evaluation
time of 0.63 hours. As for the evaluators who used
UX-Tips, we note that they identified between 1 and
26 defects and took between 0.07 and 2.6 hours, with
an average time of 0.43 hours. One cause for the
average inspection time of Userbility may have been
longer than that of UX-Tips, may be related to the fact
that Userbility has more check items, which can get in
the way and take longer for the evaluator to fill in, as
reported in Nascimento et al. (2016b).
Initially, we conducted a normality test,
Kolmogorov-Smirnov with α=0.05 (Wohlin et al.,
2012), and the results showed that effectiveness
and efficiency values are not a normal distribution
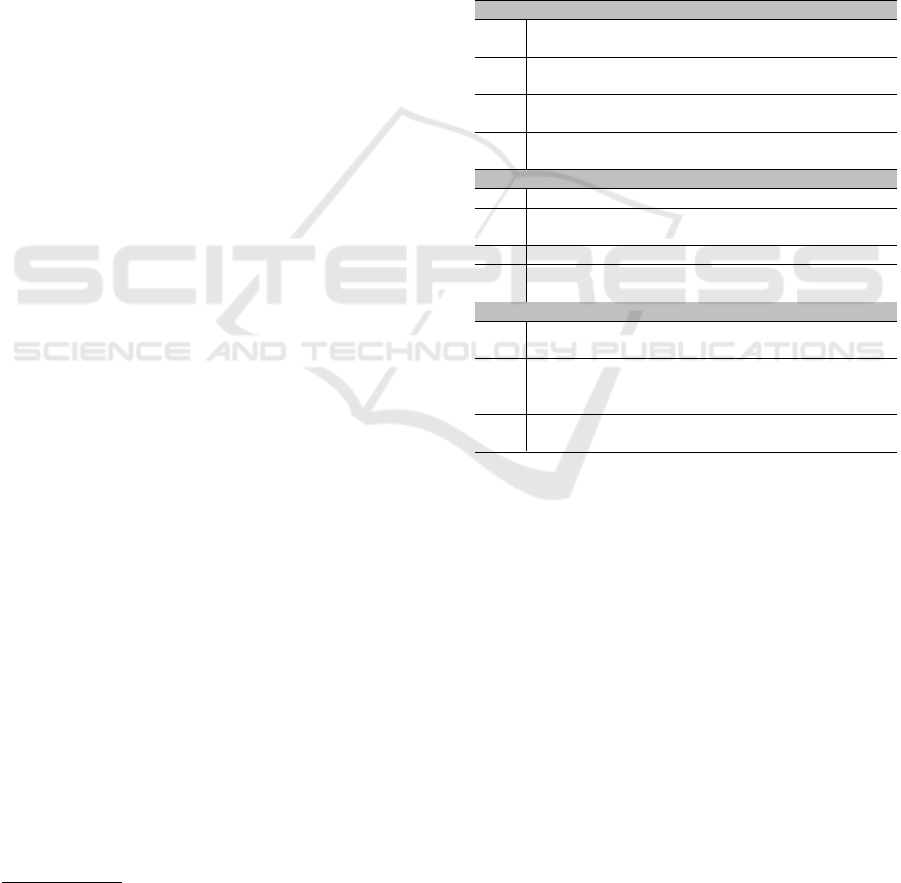
for both groups. Figure 1 shows the boxplot with
the distribution of efficiency and effectiveness by
technique.
We noted that the median efficiency for the two
groups is similar (Userbility=7.2 defects per hour;
UX-Tips=6.0 defects per hour). When we compared
the two samples using the Mann-Whitney test (non-
parametric test) showed that there is no statistically
significant difference between the groups (p = 0.234).
These results support H
01
. The same analysis was ap-
plied to determine if there was any significant differ-
ICEIS 2022 - 24th International Conference on Enterprise Information Systems
344
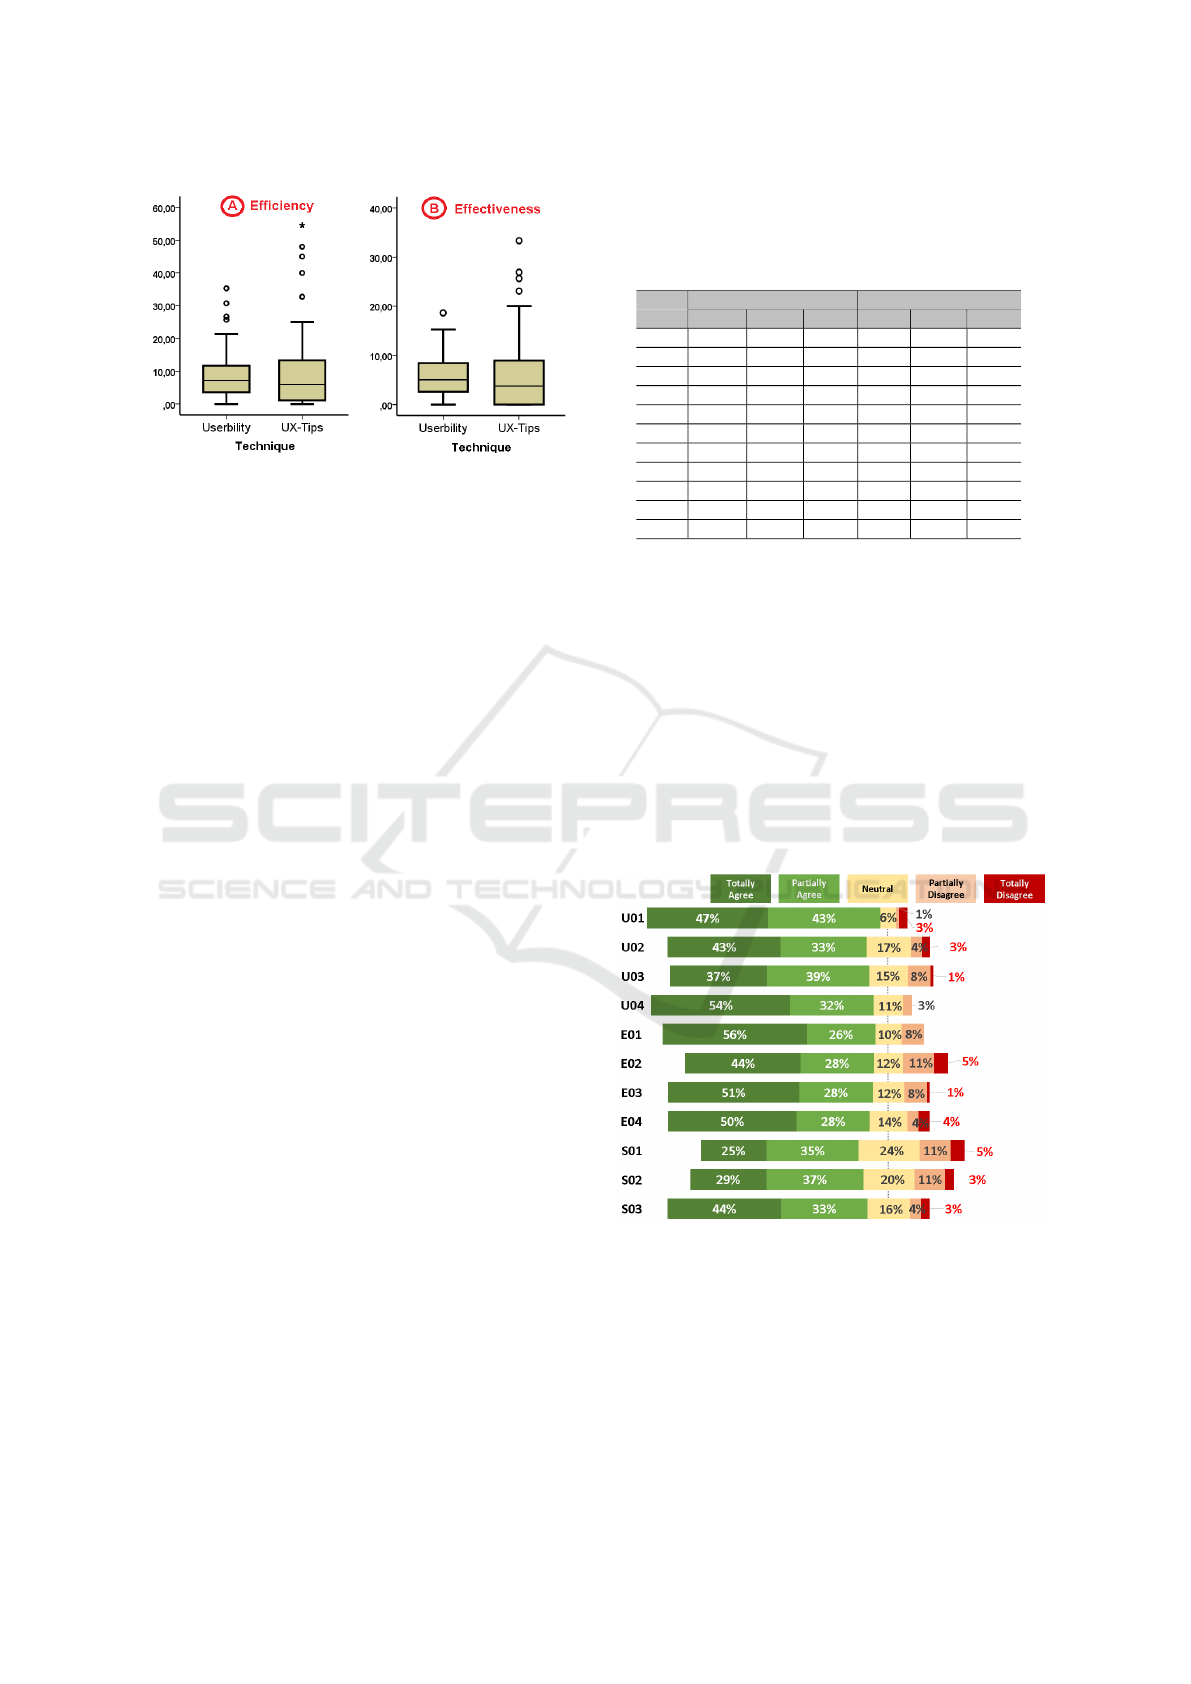
Figure 1: Boxplots with the efficiency and effectiveness.
ence comparing the effectiveness indicator of the two
techniques in detecting UUX defects. The boxplot
shows that the median of the group that used User-
bility (5.08) is slightly higher than the median of the
group that used UX-Tips (3.74). However, the result
of the Mann-Whitney test did not identify a statisti-
cally significant difference between the two groups (p
= 0.083). Thus, these results support H
02
.
Analyzing the quantitative results, we conclude
that both techniques show similar abilities for detect-
ing UUX problems in mobile applications. Partici-
pants who evaluated TripAdvisor reported more main
problems using the UX-Tips technique (78 defects).
For Airbnb, the result was inverted, with the Userbil-
ity technique having a higher number of main prob-
lems (77 defects). Even so, the number of main de-
fects found, summing the evaluation of the two appli-
cations (Airbnb and TripAdvisor), was higher using
the Userbility technique (in total, 136 defects). As for
the UX-Tips side, the total amount of defects was 133
main defects. The quantitative results show a slight
advantage for the Userbility. Even so, there is not a
considerable difference to state precisely which of the
techniques is more efficient and effective.
4.2 Participants’ Perceptions (RQ2)
After the quantitative analysis, the researchers ana-
lyzed the post-inspection questionnaires with the par-
ticipants’ acceptance regarding usefulness, ease of
use, and intentions to use per technique. Before, we
checked the reliability and factor validity. To assess
reliability, we generated the Cronbach’s Alpha co-
efficient (Carmines and Zeller, 1979). Our results
showed that for each of the TAM items, the coef-
ficient values were above 0.86 (Userbility) and 0.88
(UX-Tips), indicating the reliability of the items. In
turn, we check factor validity employing factor anal-
ysis (each item needs to have a minimum loading
threshold of 0.7) (Laitenberger and Dreyer, 1998). We
found that almost all questionnaire items met the min-
imum value, except for items U02 and E04 of both
questionnaires (see Table 3).
Table 3: Factor validity for TAM’s indicators.
Userbility UX-Tips
Usef. Ease Self. Us. Ease Self.
U01 0.73 0.73
U02 0.66 0.59
U03 0.77 0.78
U04 0.71 0.82
E01 0.83 0.81
E02 0.83 0.88
E03 0.89 0.90
E04 0.63 0.69
S01 0.84 0.83
S02 0.78 0.74
S03 0.85 0.89
We established a comparison parameter based on
the participants’ perception of the techniques. The
graphs presented in Figure 2 and Figure 3 present the
level of agreement of the participants for the items of
the Userbility and UX-Tips techniques, respectively.
To present a better discussion on the acceptance of
each technique, we grouped the “Totally Disagree”
and “Partially Disagree” responses for each item in
the questionnaire to show that the participants had
some difficulty and did not accept the technique well.
Similarly, the “Totally Agree” and “Partially Agree”
responses were grouped to show that the students had
good acceptance for one of the techniques.
Figure 2: Graph of participants’ agreement on Userbility.
Regarding usefulness, the aggregate positive
agreement results on Userbility are ranked between
78% (U03) to 91% (U01), with an average of 83.5%
acceptance on this item. While for UX-Tips, they are
ranked between 63% (U03) to 76% (U01) acceptance,
with an average of 71.75%. We noticed that there are
participants remaining neutral and/or disagreeing in
An Experimental Study on Usability and User Experience Evaluation Techniques in Mobile Applications
345
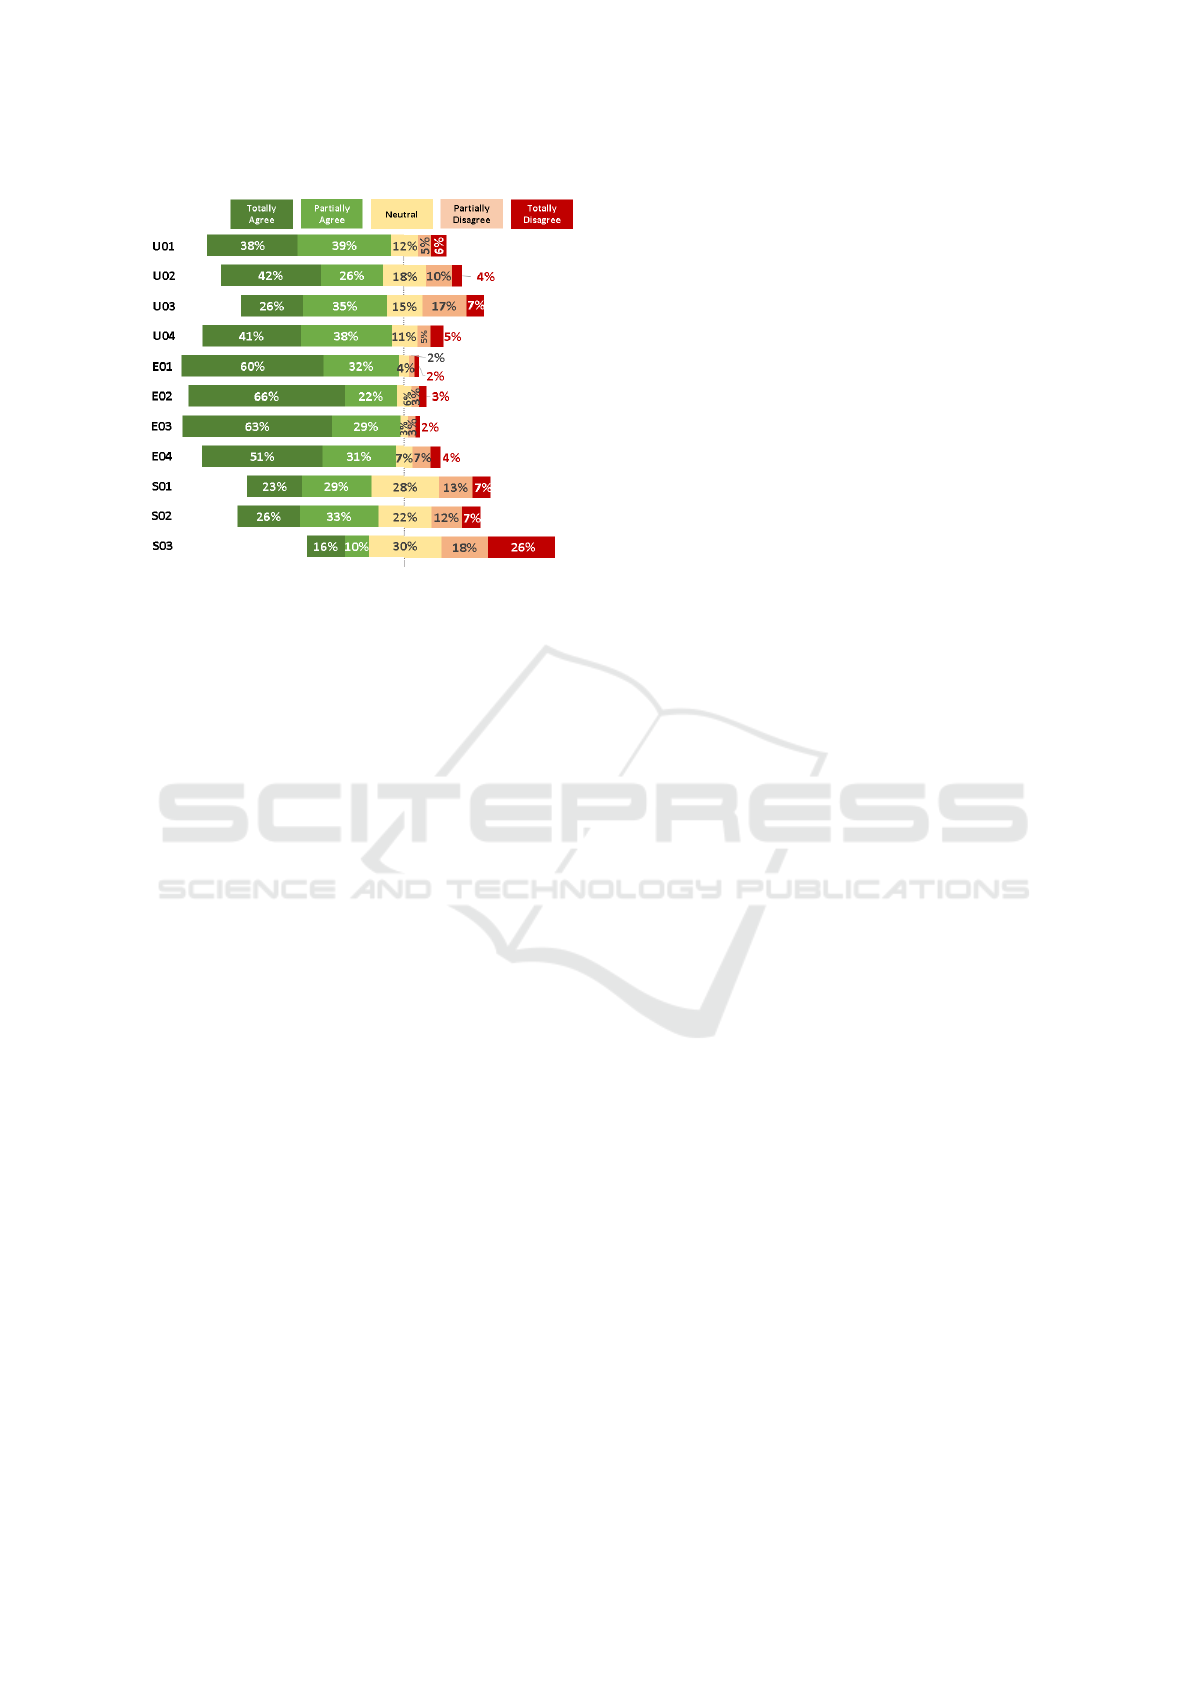
Figure 3: Graph of participants’ agreement on UX-Tips.
both techniques. We detected a higher disagreement
from participants in the item that evaluates whether
the technique allows participants to fully report as-
pects of their experience (U03), with 23% for UX-
Tips and 9% for Userbility. Despite this, we can con-
clude that most participants found the techniques use-
ful for performing UUX inspections and that the User-
bility technique obtained the highest average accep-
tance by the participants.
Regarding ease of use, there was a higher rate of
positive agreement for the UX-Tips technique, rang-
ing from 81% (E04) to 89% (E03). As for Userbility,
we noticed that the positive agreement varied from
73% (E02) to 81% (E01). The average acceptance for
this indicator was 86.5% for UX-Tips and 78.25% for
Userbility. We also noticed that more participants re-
mained neutral and disagreed with the Userbility tech-
nique. The item that evaluated if the technique did
not require much mental effort (E02) obtained 16%
disagreement for the Userbility technique and only
7% for UX-Tips. Based on the results, we can con-
clude that most of the participants considered both
techniques easy to use and that the participants more
accepted the UX-Tips technique.
Finally, for the future use intention indicator, most
inspectors had a higher level of agreement for the
Userbility. In this indicator, the positive acceptance
ranged from 62% (S01) to 78% (S03) for Userbil-
ity, with an average of 69.3%. For UX-Tips, we no-
ticed a very low variation compared to other survey
responses, from 27% (S03) to 58% (S02), with an av-
erage response of only 45.6%. On each item, we no-
ticed that 22% and 21% of the UX-Tips respondents
disagreed with items S01 and S02, respectively. For
Userbility, the disagreement values were below 17%
on these two items. We also noted that in item S03
(I intend to use the technique to evaluate my experi-
ence with an application in the future), we detected a
disagreement of 45% of the respondents concerning
UX-Tips and only 7% in Userbility.
We observed that, based on the participants’ per-
ceptions, the Userbility was more useful and more
likely to be used in future inspections than UX-
Tips. This result may be related to the Userbility
aspects that guided the UUX inspection. For exam-
ple, its level of detail and explanation of each item
was higher, besides counting on examples, experience
evaluation with descriptive and visual questions, al-
lowing a more accurate complete evaluation. On the
other hand, the UX-Tips was easier to use. This re-
sult may be related to the low complexity of the UX-
Tips, i.e., with more punctual and precise check items,
providing a less tiring evaluation experience for the
participants. After the study was conducted, some of
the students provided this feedback to the researchers.
These results motivated us to conduct observational
studies to collect more qualitative data for this re-
search, such as the positives, negatives, difficulties,
and suggestions for using both techniques.
5 FINAL CONSIDERATIONS
This paper presents a comparative experimental study
between two techniques for evaluating UUX in mo-
bile applications. We compared the techniques in
terms of effectiveness and efficiency and collected
participants’ perceptions of each technique using the
TAM questionnaire. Both techniques were effective
when used by non-HCI expert evaluators in identi-
fying UUX defects. The amount of UUX problems
found by the participants was very similar (Userbility
= 136; UX-Tips = 133). Furthermore, when we com-
pared the two samples using the Mann-Whitney test,
no significant difference was found between the two
groups. Regarding efficiency (ratio of problems found
to time spent), the average efficiency of the partici-
pants using Userbility was 7.44 defects/hour, while
the average efficiency using UX-Tips was 10.30 de-
fects/hour. However, despite the results being consid-
erably different, the statistical tests we conducted re-
tain a null hypothesis, thus confirming no statistically
significant difference between the two techniques. By
collecting the participants’ perceptions through the
TAM, we evidenced that the Userbility technique was
considered more useful and more likely to be used
in future inspections than UX-Tips. Also, the re-
sults showed that the participants considered the UX-
Tips easier to use. Finally, we can infer that both
techniques fulfill the goal of helping users evaluate
ICEIS 2022 - 24th International Conference on Enterprise Information Systems
346

the UUX of mobile applications, especially inspectors
with no experience in HCI.
We also identified some threats that can affect the
validity of the results, and we tried to mitigate them.
The main are: (i) there could be a training effect if
the training of one of the techniques was of lower
quality than the training of the other, but we con-
trolled this risk by preparing equivalent training for
both groups and with the same examples; (ii) the or-
der of application may have caused bias to students,
however, all participants used both techniques, and
the order of application was reversed on the second
day; we consider the metrics used as a threat (effi-
ciency and effectiveness), however, these metrics are
commonly adopted in experimental studies that eval-
uate usability and UX in applications (Marques et al.,
2019; Nascimento et al., 2016a); and the main threat
was the data collection since we had to conduct the
study remotely due to social isolation, but we tried to
minimize this bias by applying the same study proce-
dure to all classes to extract the data. As future work,
we intend to execute new experimental studies to (a)
evaluate the differences in the results of experienced
(industry) and non-experienced HCI inspectors em-
ploying the two techniques; (b) qualitatively identify
the difficulties, facilities, and improvement sugges-
tions perceived by the participants in using each of
the techniques; and (c) propose a new Usability and
UX evaluation technique, focusing on mobile appli-
cations, considering the limitations identified in this
study.
REFERENCES
Carmines, E. G. and Zeller, R. A. (1979). Reliability and
validity assessment. Sage publications.
Chyung, S. Y., Roberts, K., Swanson, I., and Hankinson,
A. (2017). Evidence-based survey design: The use of a
midpoint on the likert scale. Performance Improvement,
56(10):15–23.
da Silva Franco, R. Y., Santos do Amor Divino Lima, R.,
Paixão, M., Resque dos Santos, C. G., Serique Meiguins,
B., et al. (2019). Uxmood—a sentiment analysis and in-
formation visualization tool to support the evaluation of
usability and user experience. Information, (12).
Guerino, G. C., Silva, W. A. F., Coleti, T. A., and Valen-
tim, N. M. C. (2021). Assessing a technology for usabil-
ity and user experience evaluation of conversational sys-
tems: An exploratory study. In Proceedings of the 23rd
International Conference on Enterprise Information Sys-
tems (ICEIS 2021), volume 2, pages 461–471.
Hassenzahl, M. (2008). User experience (ux) towards an
experiential perspective on product quality. In Proceed-
ings of the 20th Conference on l’Interaction Homme-
Machine, pages 11–15.
ISO25010 (2011). Iso/iec 25010: Systems and software
engineering – square – software product quality require-
ments and evaluation – system and software quality mod-
els.
ISO9241-210 (2011). Iso / iec 9241-210: Ergonomics of
human-system interaction – part 210: Human-centred
design for interactive systems.
Laitenberger, O. and Dreyer, H. M. (1998). Evaluating the
usefulness and the ease of use of a web-based inspec-
tion data collection tool. In Proceedings Fifth Interna-
tional Software Metrics Symposium. Metrics (Cat. No.
98TB100262), pages 122–132. IEEE.
Marques, L., Matsubara, P., Nakamura, W., Wiese, I.,
Zaina, L., and Conte, T. (2019). Ux-tips: A ux evaluation
technique to support the identification of software appli-
cation problems. In Proceedings of the XXXIII Brazilian
Symposium on Software Engineering, pages 224–233.
Marques, L., Matsubara, P. G., Nakamura, W. T., Ferreira,
B. M., Wiese, I. S., Gadelha, B. F., Zaina, L. M., Red-
miles, D., and Conte, T. U. (2021). Understanding ux
better: A new technique to go beyond emotion assess-
ment. Sensors, 21(21):7183.
Nascimento, I., Silva, W., Gadelha, B., and Conte, T.
(2016a). Userbility: a technique for the evaluation of
user experience and usability on mobile applications. In
International Conference on Human-Computer Interac-
tion, pages 372–383. Springer.
Nascimento, I., Silva, W., Lopes, A., Rivero, L., Gadelha,
B., Oliveira, E., and Conte, T. (2016b). An empirical
study to evaluate the feasibility of a ux and usability in-
spection technique for mobile applications. In 28th Inter-
national Conference on Software Engineering & Knowl-
edge Engineering, California, USA.
Nielsen, J. (1994). Heuristic evaluation. Usability inspec-
tion methods.
Rivero, L. and Conte, T. (2017). A systematic mapping
study on research contributions on ux evaluation tech-
nologies. In Proceedings of the XVI Brazilian Sympo-
sium on Human Factors in Computing Systems, pages
1–10.
Sharp, E., Preece, J., and Rogers, Y. (2019). Interaction De-
sign: Beyond Human-Computer Interaction. Addison-
Wesley.
Valentim, N. M. C., Rabelo, J., Oran, A. C., Conte,
T., and Marczak, S. (2015). A controlled experiment
with usability inspection techniques applied to use case
specifications: comparing the mit 1 and the uce tech-
niques. In 2015 ACM/IEEE 18th International Confer-
ence on Model Driven Engineering Languages and Sys-
tems (MODELS), pages 206–215. IEEE.
Venkatesh, V. and Davis, F. D. (2000). A theoretical exten-
sion of the technology acceptance model: Four longitu-
dinal field studies. Management science, 46(2):186–204.
Wohlin, C., Runeson, P., Höst, M., Ohlsson, M. C., Regnell,
B., and Wesslén, A. (2012). Experimentation in software
engineering. Springer Science & Business Media.
An Experimental Study on Usability and User Experience Evaluation Techniques in Mobile Applications
347
