
Integration of the Autonomous Open Data Prediction Framework in
ERP Systems
Janis Peksa
a
and Janis Grabis
b
Institute of Information Technology, Faculty of Computer Science and Information Technology,
Riga Technical University, Kalku street 1, LV-1658, Riga, Latvia
Keywords: ERP Systems, Prediction Framework, AODPF.
Abstract: Enterprise resource planning (ERP) systems are large modular enterprise applications that are designed to
execute the majority of enterprise business processes with a focus on transaction processing. Business
processes, on the other hand, frequently necessitate complex decision-making. If data processing logic
requires complex analytical calculations and domain specific knowledge, is is considered as complex. To
externalize the analytical calculations and decouple them from the core ERP system, this paper elaborates
an integration framework fererred as to Autonomous Open Data Prediction Framework (AODPF). The
AODPF provides advanced prediction capabilities to ERP systems. It uses data integration and processing
as well as best model selection functions to generate predictions passed to the ERP system for decision-
making purposes. The framework is experimentally evaluated by prediction road conditions for the case of
winter road maintenance. The utility of the framework is evaluated in the expert survey.
a
https://orcid.org/0000-0003-4125-494X
b
https://orcid.org/0000-0003-2196-0214
1 INTRODUCTION
Enterprise resource planning (ERP) systems are
large modular enterprise applications designed for
most enterprise business processes. They are mainly
focused on transaction processing. However, many
modules have complex decision-making logic
(Holsapple et al., 2005). Data processing logic is
considered a complex decision-making logic if it
relies on analytical or management models to
determine business process execution and often it
requires domain specific knowledge. Forecasting is
used to improve the performance of business
processes. Forecasting is how the future can be
predicted based on past data, often through trend
analysis (Weigend, 2018). It is a case when an
enterprise desires an excessive demand to make
more profit and effectively run enterprise processes
(Brigham and Houston, 2021). ERP systems have
limited forecasting capabilities often hard-coded as a
part of the overall business logics (Chase et al.,
2018). Businesses undertake significant efforts to
modify existing methods to meet their requirements
(Aslan et al., 2012). Some ERP systems do not have
sufficient forecasting functionality justifying the
need for integration of forecasting algorithms into
ERP systems (Fildes and Goodwin, 2021).
Formally, forecasting in relation to ERP systems
is defined as follows. It is part of the business
process executed in the ERP system and expressed
as P. Data available in the ERP system are described
as D. The forecasting model is reffered as to M,
ultimately leading to the expression PERP, which
describes built-in ERP forecasting capabilities.
PERP = <P, D, M> (1)
There are some drawbacks to this PERP process;
one of the main disadvantages is that it is
concentrated inside the ERP systems inward.
Therefore, when defining the problem statement,
attention should also be paid to the alternative,
which is forecasting in the data warehouse, denoted
as PDW, where P' maintains the link transferred
from the ERP systems. Data from the ERP systems
are characterised as D1, and data from the outside –
as D2. Also, the prediction models can be expressed
as M. The expression PDW obtained in the end is
provided below.
Peksa, J. and Grabis, J.
Integration of the Autonomous Open Data Prediction Framework in ERP Systems.
DOI: 10.5220/0011081300003179
In Proceedings of the 24th International Conference on Enterprise Information Systems (ICEIS 2022) - Volume 1, pages 251-258
ISBN: 978-989-758-569-2; ISSN: 2184-4992
Copyright
c
2022 by SCITEPRESS – Science and Technology Publications, Lda. All rights reserved
251

PDW = <P', D1, D2, M> (2)
There is a problem in this process due to the
statistical nature of PDW process. Therefore, it is
linked to the data warehouse schema. The solution
installed and addressed is called integrated
forecasting, which can be expressed as IP combining
a process that is a process of the ERP systems
described as P1 and P2 as a process that occurs in
nature or actual events. For this PDW process, data
from the ERP systems as D1 and data D3 are
available from various sensors or outside the ERP
systems. Unlike D2, D3 above is not tied to a data
warehousing scheme. At the end of the IP, there is
also a model M', in which a more comprehensive
range of models can be assembled than the previous
model M.
IP = <P1, P2, D1, D3, M'> (3)
The problem being solved is mapping P2 to P1
by attaching data. For example, road maintenance in
the ERP systems P1 is the road maintenance
process; D1 is information about roads in the ERP
systems limited by a specific road section length. P2
is the actual events on the road (e.g., increased flow,
accidents, road surface icing), and D3 is sensor data
whose main problem is unevenly distributed (e.g.,
there is no sensor in one location). D1 and D2 are
the data that are evenly distributed in the ERP
systems, whereas D3 refers to the data that are
unevenly distributed. The problem is how to make
the IP process attract D3 by mapping to obtain
forecasts for all D. Another example is customer
demand forecasting. The ERP systems have a list of
customers who need to forecast PERP. At the same
time, there is an IP process when customer
information is variable and wildly different; each
customer needs a prediction. The IP can be used to
map the data so that it is possible to make the
appropriate forecast for each customer. This
definition explains what is needed in research and
how it goes from data to ERP system integration in
order to improve business values.
Business objectives lead to the need for a
prediction framework called Autonomous Open
Data Prediction Framework (AODPF). The AODPF
is to carry out forecasting with open data from
different sources and establish itself as an
autonomous system to tackle the IP challenge. The
AODPF can automatically collect algorithms and
deliver results to ERP systems. Some of the essential
technical advantages are incorporating various data
sources into one process and the prospect of
connecting the findings to ERP systems. Under
different conditions, managers may configure and
update these data sources to enhance decision-
making. The implementation of the AODPF
framework is published on GitHub (Peksa, 2021).
The application of the framework is
demonstrated using a winter road maintenance case.
The ERP is used by the maintenance company to
plan and monitor the work, while the AODPF
predicts road conditions as an input to the planning
business process. Application results will reduce the
potential for future road accidents during the winter
months when ice forms on the road surface. Also,
multiple data layers can be combined to produce
more accurate forecasts using the AODPF as a
standard solution from the knowledge gained.
The main goal is to reflect the results achieved
using the AODPF and highlight the experts’
opinions on the AODPF.
The rest of the paper is organised as follows:
Section II discusses the AODPF framework;
Section III provides a comparison of the AODPF
results, and Section IV draws up conclusions.
2 AUTONOMOUS OPEN DATA
PREDICTION FRAMEWORK
The AODPF framework has be proposed in the
previous work (Pekša and Grabis, 2018). This
section briefly recaps the framework.
The requirements towards the framework are
motivated by the winter road maintenance case.
Road maintenance activities are complex and
unique, from road surface laying to day-to-day
maintenance. Forecasting enables proactive
maintenance activities for technical advice on the
necessary maintenance activities. During winter
only, the anti-slip maintenance includes anti-slip
materials at different times and locations on the road
surface. Anti-slip management uses quantitative data
from several sources (Diène et al., 2020), including
open data sources, and decision-making outcomes
are substantially dependent on the quality of data
(Ghasemaghaei, 2019). The higher the velocity, the
greater the probability of potential accidents under
driving conditions when the speed of traffic is high
(Parsa et al., 2020).
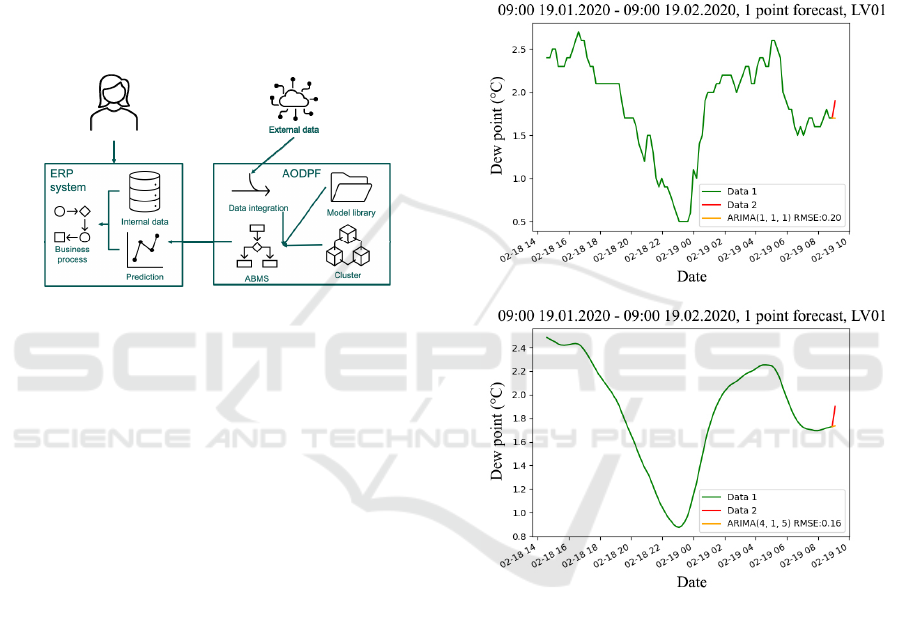
The AODPF provides advanced forecasting
functionality to ERP systems. It is assumed that
users perform business processes using an ERP
system (see Fig. 1). The business processes require
predictions. These predictions would be made using
the internal data if only the ERP system is used.
However, the forecasting functionality is allocated to
ICEIS 2022 - 24th International Conference on Enterprise Information Systems
252
the AODPF framework. The framework integrated
the ERP data with external data coming from
various sources, including open data sources. It also
maintains a library of models that includes data
processing methods (i.e., missing data handling) and
various forecasting models. The models from the
library are combined together and evaluated using
the Autonomous Best Model Selection (ABMS)
algorithm. The algorithm employs a search
procedure to identify the most suitable data pre-
processing and forecasting methods for the given
data set. It is executed on-demand in a container
cluster to handle potentially large volume of
computations.
Figure 1: Interaction between ERP system and the
AODPF.
Once the best forecasting model is identified, it
is used to make predications, which are passed to the
ERP system. During the business process execution,
the AODPF continuously monitors prediction
accuracy and re-evaluates the model and decides to
update the selection, if necessary.
3 PREDICTION RESULTS
Road maintenance data from previous publications
are used, and these data ares available on the GitHub
website by searching for the author’s name and
surname. The algorithm takes all the data points for
a specific metrological station, mostly around 4000
data points. Then, dividing the data through
subtracting 200 data points from the total number it
makes a prediction and continues until it finds the
appropriate data points for a particular data source.
A forecast is made when a specific number is found,
and 10 points are predicted and compared to obtain
an RMSE value. As mentioned above, the ARIMA
consists of AR, MA models, and ARMA, which
combines and lends the ARIMA model.
Each data source has a dew point, temperature
measurement from meteorological stations in the
territory of the Republic of Latvia from 19 January
2020 to 19 February 2020, one month apart.
Metrological stations located on the road can capture
the surrounding environment, and one of them is the
dew point, which allows predicting the possible
icing of the road surface. The following figures
show the calculation of the best method (see Fig. 2).
Using the AODPF, each metrological station can be
called, and results are obtained with and without the
Kalman filter. A more repeatable AODPF shows the
results.
Figure 2: LV02 results of compensation methods w/o the
Kalman filter on the top and with the Kalman filter at the
bottom of the figure.
Each figure has the station name cypher starting
with the two capital letters LV, followed by numbers
consisting of 01–54. Thus, 30 metrological station
data are without missing data. The remaining half
has missing data from a few missing data points
because within a few months no data points were
available. For explanation purposes: 100 data points
are displayed in each image, of which ten are
predicted. The forecast is a dew point; 10 points are
predicted because about 4–6 data points are
available in one hour. Predicting 10 points provides
a forecast for the next two hours. In further
predictions, the result is closer to the average value.
Integration of the Autonomous Open Data Prediction Framework in ERP Systems
253

The business value is the obtained framework that
will forecast temperature fluctuations observed in
the next hour. As previous results have emphasised,
the framework is adaptable, which means that it is
also possible to indicate how much ahead can be
predicted. The AODPF has demonstrated an
excellent ability to make automated prediction
model choices and shows how many data points
need to be selected to make valuable predictions.
One automated approach takes and gradually
reduces the total number of data points until the
optimal number of data points is obtained. When this
happens, the number of data points is indicated, a
forecast is made starting from a specific data point,
and an automated forecast is made. As the forecasts
to be made are already known from the data, the
AODPF demonstrates the ability to perform the
calculation and adjustment algorithm using
standardised forecasting methods such as AR, MA,
ARMA, and ARIMA.
The main advantage of using the Kalman filter
can also be compared (see Fig. 2). The green lines
(Fig. 2) indicate the original data used to make the
predictions. However, the actual data with which the
forecasts are compared are already highlighted in
red. Blue colour shows the ARIMA model, the light
blue colour – the ARMA model, the black colour
refers to the AR model, while the purple colour
denotes the MA model. Parameters that are not
needed for the respective models are replaced with
0. It mainly refers to the AR and MA models. If the
model is not shown in the figure, it will not be
possible to create it; unfortunately, it happens. At the
bottom, 100 data points are shown so that it is
possible to see the predictions. The most critical
result of RMSE using each method is also
highlighted.
The final results are demonstrated in Fig. 2,
which highlights all the factors of the experiment.
There are seven different experiment situations in
the experiment plan.
First, all metrological stations with no missing
data are used in experiment scenario #1. The
ARIMA forecasting method is employed by 30 out
of 54 meteorological stations in Latvia, and the
Kalman filter is not used; the number of
observations varies depending on the meteorological
station, which averages five observations every 11
minutes. One, five, and 10 data points are forecast
using five distinct forecasting beginning points at
6:00, 9:00, 12:00, 18:00, and 21:00 in one, five, and
ten-step forecasts. The first situation is the one, in
which the AODPF framework is not used.
Second, all meteorological stations with missing
data are used in experiment scenario #2. The
ARIMA forecasting method is employed by 30 out
of 54 meteorological stations in Latvia, and the
Kalman filter is not used; the number of
observations varies depending on the meteorological
station, which averages five observations every 11
minutes. One, five, and 10 data points are forecast
using five distinct forecasting beginning points at
6:00, 9:00, 12:00, 18:00, and 21:00 in one, five, and
ten-step forecasts. Scenario #2 is an experiment with
the AODPF framework.
Third, applying the ARIMA forecasting
technique and the Kalman filter, experiment scenario
#3 is carried out using all meteorological stations
that do not have missing data, accounting for 30 out
of 54 meteorological stations in Latvia. One, five,
and 10 data points are forecast using five distinct
forecasting beginning points at 6:00, 9:00, 12:00,
18:00, and 21:00 in one, five, and ten-step forecasts.
Fourth, experiment scenario #4 uses all 54
meteorological stations, employing the missing data
filling methods for 20 meteorological stations. The
ARIMA forecasting method is utilised rather than
the Kalman filter. One, five, and 10 data points are
forecast using five distinct forecasting beginning
points at 6:00, 9:00, 12:00, 18:00, and 21:00 in one,
five, and ten-step forecasts.
Fifth, experiment scenario #5 is carried out
utilising the missing data filling methods for 20
meteorological stations, totalling 54 meteorological
stations. Again, the Kalman filter and the ARIMA
prediction algorithm are used. One, five, and 10 data
points are forecast with five distinct forecasting
beginning points at 6:00, 9:00, 12:00, 18:00, and
21:00 in one, five, and ten-step forecast.
Sixth, experiment scenario #6 is carried out using
the missing data filling methods for 20
meteorological stations, totalling 54 meteorological
stations. The ARIMA forecasting method is utilised
rather than the Kalman filter. A new data source has
been added to the Latvian Environment, Geology
and Meteorology Centre (LVGMC) dataset,
consisting of 25 additional meteorological stations in
the city’s central area. One, five, and ten data points
are forecast with five different forecasting starting
points at 6:00, 9:00, 12:00, 18:00, and 21:00 in one,
five, and ten-step forecast.
Finally, last experiment scenario #7 is performed
with all meteorological stations, making up 54
meteorological stations, using the missing data
filling methods for 20 meteorological stations. The
ARIMA prediction method and the Kalman filter are
used. Moreover, an additional data source, LVGMC
ICEIS 2022 - 24th International Conference on Enterprise Information Systems
254
with 25 metrological stations, is added. The period is
from 19 January 2020 to 19 February 2021 – twelve
whole months, which make up one calendar year;
one, five and ten data points are forecast with five
different forecasting starting points at 6:00, 9:00,
12:00, 18:00 and 21:00 in one, five, and ten-step
forecast.
The results are shown below (see Figs. 3–5). The
results are presented in such a way as to be able to
compare scenarios #1 to #7. The number 1 to 7
indicates the sequence number of the scenario. The
Y-axis indicates the RMSE, which shows the inter-
comparison between the different scenarios. Note
that all scenarios #2 to #7 are not possible if there
are missing data. This is because the AODPF uses
the missing data filling method to perform the
experiments. In contrast, scenario #1 does not use
meteorological stations with missing data.
Figure 3: Results for 1 point forecast, LV01-LV54,
19.01.20–19.02.20.
The most accurate forecasts are at 06:00, 09:00,
18:00 and 21:00. However, the most inaccurate
prediction results are at 12:00.
Figure 4: Results for 5 point forecast, LV01-LV54,
19.01.20–19.02.20.
It should be noted that the projections are made
at a fixed time with fixed data. Also, it should be
borne in mind that a one-hour interval consists of 5
points. There are 11 minutes between points, and
when the next point is forecast, 11 minutes are
forecast in the future. Therefore, the further in time
the projections are made, the more inaccurate the
result. For example, forecasting 10 points ahead
gives a forecast almost 2 hours ahead, which in
some places remains highly inaccurate.
Figure 5: Results for 10 point forecast, LV01-LV54,
19.01.20–19.02.20.
The decision-maker who manages and
understands the data has to adjust the forecasting
step so that the result achieved satisfies the business
value in a way that facilitates its achievement. The
key advantage of the AODPF that can be exploited
is using a standard form of integration to achieve
business value in a fast and efficient way. Both open
and business data are not freely available when
combining different data sources, different
forecasting methods, and making their comparison.
A knowledge base of automated algorithms that
feeds the previous results is also obtained. There is a
significant integration with ERP systems, where an
API approach is used, and the AODPF framework
can be placed as a container and reused to run
different amounts of predictive computing in
parallel. In the next section, the AODPF is put at the
disposal of the Panel to determine the experts’ views
on the AODPF.
4 EXPERT EVALUATION
The formation of an expert group should be
understood in terms of its expertise and knowledge
in a given area. In this case, the focus is on experts
related to forecasting, time series, weather
forecasting and road condition forecasting. Using
well-known scientific portals, 64 experts are
approached, of which 21 experts are matched in
terms of focus and experience in selecting the expert
group, of which five experts participate in the
practical evaluation of the expert group. Each expert
Integration of the Autonomous Open Data Prediction Framework in ERP Systems
255
has fulfilled the requirement for expert vetting, as
the minimum number of experts involved in an
evaluation question should start from two, and
experts should have at least two years of experience
in the relevant field.
The experts are required to consult the authors’
publications and the developed AODPF framework,
which is available individually to each expert with
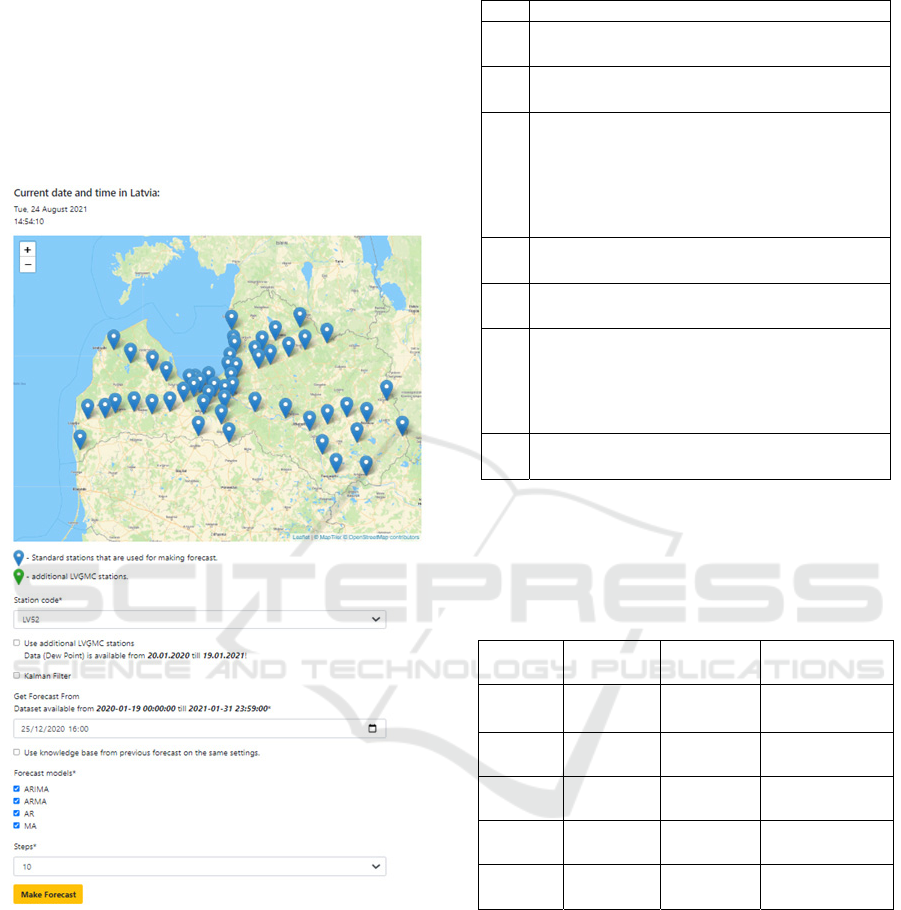
their username and password (see Fig. 6).
Figure 6: AODPF graphical user interface.
The AODPF GUI allows experts to configure the
required parameters with visual pre-parameter input
and then visual display of the results. When working
with the AODPF and evaluating it in practice,
experts are asked to answer the following questions
on a scale from 1 (strongly disagree) to 5 (strongly
agree) (see Table 1).
Table 1: Panel Questions.
No. Questions
1. Are additional data sources used for the
AODPF?
2. Are different forecasting models used in the
AODPF?
3. Repeating the experiment with the
meteorological station “LV52” on 25.12.2020
at 16:00 using the ARIMA method to predict
10 points ahead, can it be established that the
dew points dropped rapidly and road icing
ma
y
have formed?
4. Can using an additional Kalman filter give
better results with the AODPF?
5. Does the AODPF knowledge base reduce the
recurrence of forecasting results?
6. Can the meteorological station “LV06”, which
is missing data for the period of 19.01.2020–
19.02.2020, be assessed for performance
improvement compared to other nearby
meteorological stations?
7. Does the use of different data sources in the
AODPF improve forecasting accuracy?
Question 8 is also asked in an accessible format
as possible suggestions, comments from the experts.
The information from the experts is summarised
below (see Table 2).
Table 2: Expert Information.
Expert Category Years of
experience
Expertise
Expert 1 Academic 5–10 Forecasting
scientist
Expert 2 Industry 3–5 Weather
forecasting
Expert 3 Academic 10+ Forecasting
scientist
Expert 4 Industry 6–10 Weather
forecasting
Expert 5 Academic 6–10 Forecasting
scientist
The process used to work with experts:
An expert was trained to read the authors’
publications and have a good understanding of
the processes within the AODPF framework and
its deliverables;
Videos with tutorials and examples were
produced to highlight how to work with the
AODPF framework;
The AODPF framework was produced as an
online web-based framework with an individual
username and password where each expert
could access and work with the AODPF
framework;
ICEIS 2022 - 24th International Conference on Enterprise Information Systems
256

After reading the AODPF framework, the
expert was asked to answer a series of questions
shown above (see Table 2);
The last stage was to summarise the results and
conclude the findings.
The expert has a vital role in ensuring that each
of the options in the AODPF framework is
appropriate for the task and the outcome to be
achieved. Furthermore, one of the key factors is
whether there is a possibility to reuse, and the
AODPF framework is helpful for both academia and
industry. The mean or median approach will be used
to calculate the assessment unit from expert
judgement. The median approach is proposed as one
of the methods to measure the ratings given by the
experts. The median is about the centre of the data
set. Since the number of experts involved in the
work is 5, which is an odd number, the average of
the scores in consecutive order will be the median.
The item analysis is shown below (see Table 3)
based on the experts’ scores.
Table 3: Item Analysis Based on Expert Assessments.
Expert ratings on a scale of 1–5, where 1 – strongly
disagree and 5 – strongly agree
Questions
Expert 1
Expert 2
Expert 3
Expert 4
Expert 5
Median
1. 3 4 4 5 4 4
2. 3 5 4 2 3 3.4
3. 4 5 3 4 4 4
4. 3 4 4 4 3 3.6
5. 4 3 4 3 4 3.6
6. 3 5 4 4 3 3.8
7. 4 3 4 4 2 3.4
After a practical evaluation of the expert group
attended by 21 experts, corresponding to the 64
experts approached, a group of 5 experts was finally
formed. The expert group unanimously underlined
that the AODPF framework was workable, and its
use helped facilitate the integration of the results
into the URP framework. The Cronbach’s alpha
value demonstrates that the experts were unanimous
in their answers to the questions. The AODPF
framework is practically reliable, as the value is
higher than 0.85, and the results are considered
significant according to Cronbach’s alpha value. The
experts successfully used the mathematical
optimization model for the road maintenance case
and extracted the results via API to implement the
URP framework.
5 CONCLUSIONS
The AODPF framework has only just started to
reach its potential and can be applied in a variety of
projects. With the automated process and the
possibilities provided by AODPF, the ability to
combine multiple data sources is a step to already
start using more than two data layers. The final
results of AODPF indicate that using two layers can
give better results than not using them. Also, the
AODPF missing data method can be used to make
predictions with data for which it was previously not
possible to make predictions, and additional data
manipulation was necessary. The experiments have
been successfully mirrored, and the experts have
identified that the AODPF is suitable for integration
with ERP systems. It is able to facilitate the process
in order to make the integration run smoothly with
the possibility to configure what is needed to
increase business value.
The objective has been achieved, and the results
reflected. However, much work is still needed to
implement the AODPF in international projects as a
dependent building block that improves the system
in a given problem area scenario.
ACKNOWLEDGEMENT
The research has been supported by the European
Social Fund within project No 8.2.2.0/20/I/008
“Strengthening of PhD Students and Academic
Personnel of Riga Technical University and BA
School of Business and Finance in the Strategic
Fields of Specialization” of the Specific Objective
8.2.2 “To Strengthen Academic Staff of Higher
Education Institutions in Strategic Specialization
Areas” of the Operational Programme “Growth and
Employment”.
This publication has been supported by the Doctoral
grant programme of Riga Technical University.
REFERENCES
Aslan, B., Stevenson, M. and Hendry, L.C., 2012.
Enterprise resource planning systems: An assessment
of applicability to make-to-order companies. In
Computers in Industry, Vol. 63, No. 7, 692-705.
Brigham, E.F. and Houston, J.F., 2021. Fundamentals of
financial management. In Cengage Learning.
Chase, R.B., Shankar, R. and Jacobs, F.R., 2018.
Operations and Supply Chain Management, 15e (SIE).
McGraw-Hill Education.
Integration of the Autonomous Open Data Prediction Framework in ERP Systems
257

Diène, B., Rodrigues, J.J., Diallo, O., Ndoye, E.H.M. and
Korotaev, V.V., 2020. Data management techniques
for Internet of Things. In Mechanical Systems and
Signal Processing, Vol. 138, 106564.
Fildes, R. and Goodwin, P., 2021. Stability in the
inefficient use of forecasting systems: A case study in
a supply chain company. In International Journal of
Forecasting, Vol. 37, No. 2, 1031-1046.
Ghasemaghaei, M., 2019. Does data analytics use improve
firm decision making quality? The role of knowledge
sharing and data analytics competency. In Decision
Support Systems, Vol. 120, 14-24.
Holsapple, C., Sena, M., Wagner, W., 2019. The perceived
success of ERP systems for decision support. In
Information Technology and Management, Vol. 20,
No. 1, 1-7. https://doi.org/10.1007/s10799-017-0285-9
Parsa, A.B., Movahedi, A., Taghipour, H., Derrible, S. and
Mohammadian, A.K., 2020. Toward safer highways,
application of XGBoost and SHAP for real-time
accident detection and feature analysis. In Accident
Analysis & Prevention, Vol. 136, 105405.
Pekša, J. and Grabis, J., 2018. Integration of Decision-
Making Components in ERP Systems. In ICEIS 2018:
Proceedings of the 20th International Conference on
Enterprise Information Systems. Vol. 1, 183-189.
https://doi.org/10.5220/0006779601830189
Pekša, J., Autonomous Open Data Prediction Framework
(AODPF), 2021. [Online]. Available:
https://github.com/JanisPeksa/Autonomous-Open-
Data-Prediction-Framework
Weigend, A.S., 2018. Time series prediction: forecasting
the future and understanding the past. In Routledge.
ICEIS 2022 - 24th International Conference on Enterprise Information Systems
258
