A Machine Learning based Eye Tracking Framework to Detect Zoom
Fatigue
Anjuli Patel
1 a
, Paul Stynes
1 b
, Anu Sahni
1 c
, David Mothersill
2 d
and Pramod Pathak
3 e
1
School of Computing, National College of Ireland, Ireland
2
National College of Ireland, Ireland
3
Faculty of Digital and Data, Technological University Dublin, Ireland
Keywords:
Eye Tracker, Zoom Fatigue, Machine Learning, SVM, KNN, Ada-Boost, Logistic Regression, Decision Tree.
Abstract:
Zoom Fatigue is a form of mental fatigue that occurs in online users with increased use of video conferencing.
Mental fatigue can be detected using eye movements. However, detecting eye movements in online users is
a challenge. This research proposes a Machine Learning based Eye Tracking Framework (MLETF) to detect
zoom fatigue in online users by analysing the data collected by an eye tracker device and other influencing
variables such as sleepiness and personality. An experiment was conducted with 31 online users wearing
an eye tracker device while watching a lecture on Mobile Application Development. The online users were
given an exam followed by a questionnaire. The first exam was based on the content of the video. The
online users were then given a personality questionnaire. The results of the exam and the personality test
were combined and used as an input to five machine learning algorithms namely, SVM, KNN, Decision Tree,
Logistic Regression and Ada-Boost. Results of the five models are presented in this paper based on a confusion
matrix. Results show promise for Ada-Boost for detecting Zoom fatigue in online users with an accuracy of
86%. This research demonstrates the feasibility of applying an eye-tracker device to identify zoom fatigue
with online users of video conferencing.
1 INTRODUCTION
Detecting Zoom Fatigue is a vital concern with the
emergence of virtual connections among online users
(Riedl, 2021). Attending video calls or conferences
leads to a draining of mental energy among online
users. This triggers early exhaustion of the brain
known as ”Zoom Fatigue”. Machine learning mod-
els have been used to detect mental fatigue in online
users performing different tasks such as on the con-
struction site (Li et al., 2020), driving (Cheng et al.,
2019), and so on. In addition, to the data collected
by the eye tracker device, subjective assessments of
mental fatigue are captured by different tests such
as Karolinska Sleepiness Scale (KSS) (Jonsson and
Brown, 2021) test, SSS (Stanford Sleepiness Scale)
test, and NASA-TLX (NASA- Task Load Index see
(Lowndes et al., 2020)). These tests capture the cal-
a
https://orcid.org/0000-0002-9234-3590
b
https://orcid.org/0000-0002-4725-5698
c
https://orcid.org/0000-0001-5580-6624
d
https://orcid.org/0000-0003-3013-4088
e
https://orcid.org/0000-0001-5631-2298
culation of Sleepiness, alertness, and cognitive load
of the brain respectively. The data collected from both
eye tracker and different tests samples are processed
through machine learning such as SVM (Support Vec-
tor Machine), KNN (K-Nearest Neighbor), Logistic
Regression, ANN (Artificial Neural Network), and
FFN (Fast forward Neural Network).However, this re-
search doesn’t capture the impact of online interac-
tions on brain fatigue. Arising out of the COVID19
pandemic, people are more inclined to interact on-
line on platforms such as zoom which can also be
represented by Computer Mediated Communications
(Nadler, 2020). To predict “zoom fatigue” in online
users in order to help reduce the exhaustion of the
brain is a challenge. The aim of this research is to in-
vestigate to what extent zoom fatigue can be detected
in online users using an eye tracker device during
video conferencing. The major contribution of this
research is a Machine Learning based Eye Tracking
Framework (MLETF). The Machine Learning based
Eye Tracking Framework combines the eye tracker
device and the Ada-Boost machine learning algorithm
in order to identify features that lead to zoom fatigue
Patel, A., Stynes, P., Sahni, A., Mothersill, D. and Pathak, P.
A Machine Learning based Eye Tracking Framework to Detect Zoom Fatigue.
DOI: 10.5220/0011075800003182
In Proceedings of the 14th International Conference on Computer Supported Education (CSEDU 2022) - Volume 2, pages 187-195
ISBN: 978-989-758-562-3; ISSN: 2184-5026
Copyright
c
2022 by SCITEPRESS – Science and Technology Publications, Lda. All rights reserved
187

such as blink behaviour, gaze point and fixation time,
saccade (speed of eye movements), and velocity.
2 RELATED WORK
This section, critically discusses the research con-
ducted on the eye tracker device and the detection of
zoom fatigue.
Mental fatigue is one of the main causes of ac-
cidents and mishaps in the workplace for different
domains such as medical, driving, construction, and
so on. There are many different ways to detect men-
tal fatigue in online users such as through electroen-
cephalographic (EEG) signals (Acı et al., 2019); (Wu
et al., 2020), physiological sensors (Monteiro et al.,
2019), drivers’ facial patterns (Cheng et al., 2019),
and wearable Eye Tracker device (Li et al., 2020);
(Yu et al., 2020); (Yamada and Kobayashi, 2018); and
(Gao et al., 2015).
(Li et al., 2020),proposed a method to detect mul-
tiple levels of mental fatigue of construction workers.
The data was collected from a wearable eye tracker
device. The data were analysed and classified based
on three levels of mental fatigue using Toeplitz In-
verse Covariance-Based Clustering (TICC) method.
According to the research, SVM performed the most
efficiently with an accuracy of between 79.5% and
85% that varied depending on construction and other
subjective scenarios.
(Cheng et al., 2019), detected driver fatigue
by exploring the driver’s facial patterns. A driv-
ing simulator-based experiment was conducted with
21 participants, where features such as blink rate,
blink duration, PERCLOS, closing speed, and several
yawns were collected in order to detect their level of
alertness and mental fatigue. A PERCLOS drowsi-
ness metric is the percentage of eyelid closure over
the pupil over time and reflects slow eyelid closures
(“droops”) rather than blinks. Logistic regression
showed the most accuracy at 83.7%.
The research (Yu et al., 2020) and (Cui et al.,
2021), proposes a model for detection of mental fa-
tigue using the data collected from eye tracker device,
with combining the value of PERCLOS with other
fatigue characteristics such as frequency of Open
Mouth (FOM). The result of the experiment showed
that the proposed model was able to achieve an accu-
racy of 98.6%.
The research (Yamada and Kobayashi, 2018) and
(Gao et al., 2015), proposes a framework for detection
of mental fatigue with data collected from eye tracker
device, and other measures such as natural viewing
situation and automation of feature selection method.
These proposed models resulted in providing better
accuracy for evaluating and detecting mental fatigue
in online users with cognitive loads.
Following national health guidelines as a result of
COVID19, institutes of higher education such as the
National College of Ireland (NCI) decided that there
was no further face to face lectures. The education
system transformed to online learning through virtual
classes for students. Eye tracking has been used in
online learning (Barrios et al., 2004); (Ivanovi
´
c et al.,
2017); (Joe Louis Paul et al., 2019).
(Barrios et al., 2004) proposed a framework for
adaptive e-learning through eye tracking. (Ivanovi
´
c
et al., 2017) focused on the integration of eye track-
ing technologies and methods in an e-learning sys-
tem. (Joe Louis Paul et al., 2019) investigated eye
gaze tracking based adaptive e-learning for enhanc-
ing teaching and learning in virtual classrooms. Re-
sults suggest that eye measures such as eye move-
ment, gaze, blink impact on the understanding and re-
liability of the e-learning system. The understanding
of the framework and adaptive e-learning provides us
information that how an eye tracker device and data
collected from them can help us detect zoom fatigue
with online mode of communication.
The research (Salvati et al., 2021) discusses the
evaluation of Mental fatigue in drivers by compar-
ing the indicative data from Karolinska Sleepiness
Scale (KSS), and post-processing data from PERC-
LOS. Similarly, the paper (Schleicher et al., 2018)
discusses the evaluation of mental fatigue with eye
movements, and Oculomotoric parameters. The re-
sult showed that the blinks frequency, count, and du-
ration are directly related to the mental fatigue of on-
line users. In paper (He et al., 2017), a model has
been proposed for validation of Google Glass-based
drowsiness detection. The result of this experiment
showed that the eye blinks, and longer response time
showed a direct impact on mental fatigue.
Neuroimaging studies suggest that that mental fa-
tigue is associated with reduced electrophysiological
signals related to error monitoring (Boksem et al.,
2006), and reduced functional connectivity of brain
networks associated with orienting one’s attention to
external stimuli (Esposito et al., 2014), with increases
in functional connectivity of brain networks associ-
ated with mind wandering.
(Morris, 2020) suggests an understanding of how
mental fatigue is related to zoom fatigue mainly
caused by exhaustion with online communication.
The research paper (Nadler, 2020), discusses the
causes of zoom fatigue, from the online mode of
communication, and the effect of cognitive load over
online users. The research paper (Fauville et al.,
CSEDU 2022 - 14th International Conference on Computer Supported Education
188

2021), proposes a Zoom Exhaustion and Fatigue
(ZEF) Scale, which provides a quantitative and de-
tailed understanding of zoom fatigue and the scale for
fatigue detection. A total of 395 online users partic-
ipated in the survey, which showed the impact of 5
features which are social, emotional, gesture, general
and visual in the detection of zoom fatigue.
(Kacur et al., 2019) presented their work to detect
schizophrenia disorders based on Rorschach Inkblot
Test and an eye-tracker system. The method extracts
and evaluates the overall time period in defined re-
gions as well as the path an image is scanned through
by an individual using Markov chain. The key fea-
tures were vectors of final probabilities and transition
matrices. The KNN method was used to classify the
extracted features into positive (schizophrenia disor-
der) and negative (a healthy individual) classes. The
dataset consisted of 44 individuals (22 patients, and
22 healthy individuals). Depending on features and
settings the detection accuracy was in the interval of
62% to 75%.
Recommendation systems have been used to pro-
vide personalized learning to the learners. These sys-
tems generally consider learners’ information such
as individual characteristic, learning style, knowledge
background, etc. (Intayoad et al., 2017) propose the
context-aware recommendation system that consid-
ers the social context also. The social context is
the interaction between learning objects (LO) and the
learners. K-nearest neighbor and decision tree are
used for analysing and classifying the learning path of
the learners having scientific and non-scientific back-
grounds. The training datasets were gathered from
studying two different content modules of basic com-
puter skill course - Introduction to Information Tech-
nology (module 1) and Office Programs (module 2).
The transactions of the click stream were stored in
weblogs. These transactions presented the interac-
tion pattern which is the numbers of times that a stu-
dent accesses particular LOs where the contents were
stored and represented. Each module consisted of
three lessons. Each lesson was composed of several
LOs. At the end of each module, there was a mod-
ule examination. There were 5526 training data items
from module1 and 21,146 items from module2. Ac-
cording to the results of classification task, KNN and
DCT obtain almost equal over all accuracies of pass
and fail student classification for both module1 and
module2. However, the accuracy of the classifica-
tion from module2 is higher than those of module1
for both classifiers. It can be concluded that DCT is
more suitable than KNN for this data set. Even in
case of high diversity of the dataset, DCT had been
very accurate.
(Ungureanu et al., 2020) studies and illustrates
some approaches to evaluating the cognitive load and
emotional state of students during a learning pro-
cess. They analyze the emotional state during learn-
ing, evaluating the visual effort, and assessing the
cognitive load level, all induced using software ap-
plications or electronic devices. The paper elaborates
experimental sessions, choosing the proper stimulus
and equipment, recording, and pre-processing meth-
ods for the involved physiological information. It
uses AdaBoost, KNN and SVM artificial intelligence
techniques for feature selection and data classifica-
tion to achieve the best calibration, appreciation, and
monitoring of a learning process. Russel’s 2D model
(arousal and valence) was used to measure the level
of emotions. The machine learning techniques were
used to classify the emotions into the pleasant, un-
pleasant and neutral emotional categories. Entropy
was the only hyper parameter used to improve the per-
formance. In all experiments, AdaBoost obtained the
best misclassification rates (0.06% for a multimodal
approach, when 100 of the decision trees and 30% of
the whole data set was used for training).
In conclusion, the state of the art indicates that
several machine learning models such as SVM, KNN,
Decision Tree and Ada-Boost are used for detection
of mental fatigue with data extracted from wearable
eye tracker device. The state of the art indicates that
the many different features such as PERCLOS, KSS
(Karolinska Sleepiness scale), SSS (Stanford Sleepi-
ness scale) etc has impact over mental fatigue. Cur-
rent research indicates that mental fatigue in an online
user can be detected using wearable eye tracker tech-
nology while performing different physical activities,
such as driving, construction work, pilot, etc. How-
ever, for detection of zoom fatigue the online users
are required to focus on online video communication
and lack of physical activities. Hence, this research
to understand what extent the eye tracker device data
can be used to detect Zoom fatigue in an online user.
3 EXPERIMENTAL PROCEDURE
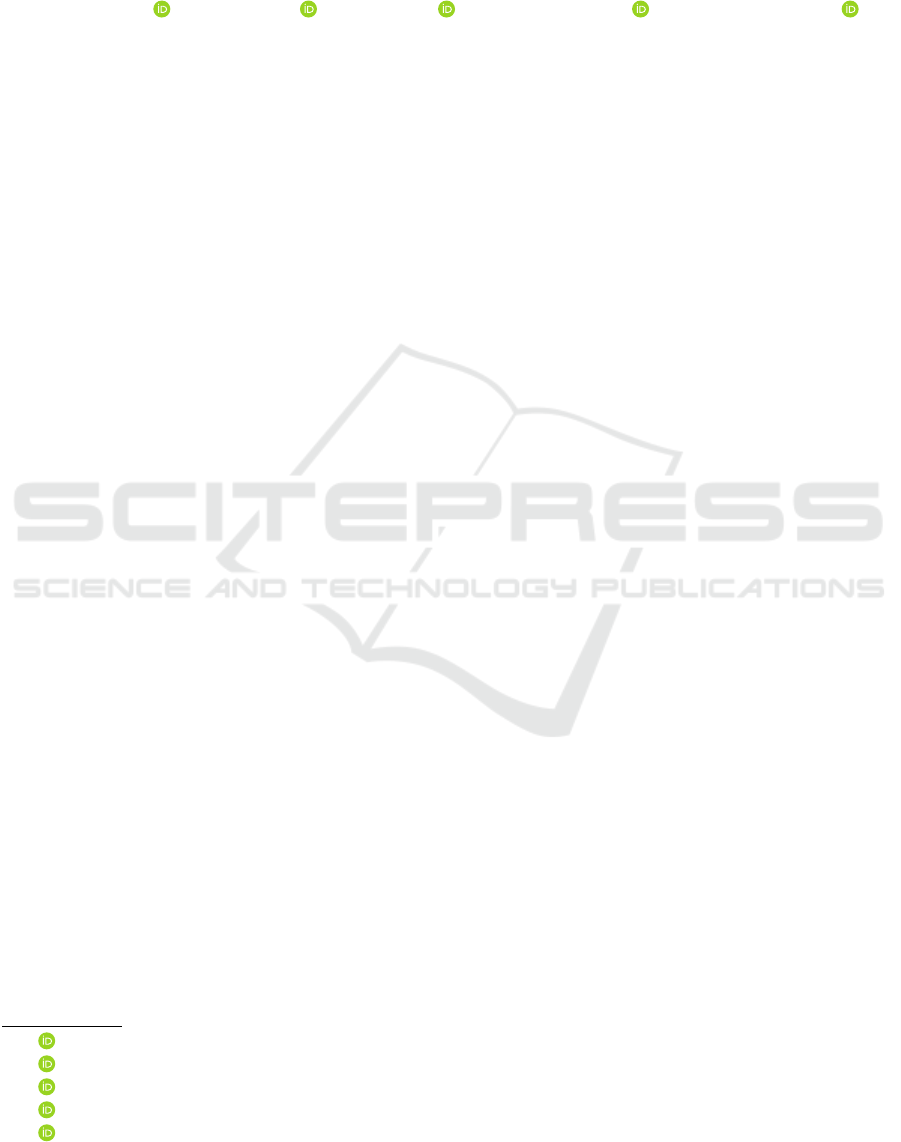
In this research the eye tracker device was used to
record the eye movement and different stimuli of the
online users while watching an online lecture. The
eye tracker device consists of a scene camera and
two IR cameras, as shown in fig.1. The eye tracker
glasses can record the online user’s gaze point, blink
count, fixation count, and saccade count. A saccade
is a quick, simultaneous movement of both eyes be-
tween two or more phases of fixation in the same di-
rection. Saccade is associated with the eye’s jumping
A Machine Learning based Eye Tracking Framework to Detect Zoom Fatigue
189
from one location to the next. Thirty-one online users
consisting of 12 females and 19 males between the
ages group of 22 and 35 took part in this study while
watching a video based on Java Web Mobile Appli-
cation development of length 25 minutes. All online
users had good vision and normal health, with prior
knowledge of Basic Java and no knowledge of mobile
app development. The online users provided written
consent before the experiment.
Figure 1: SMI Eye tracker glass.
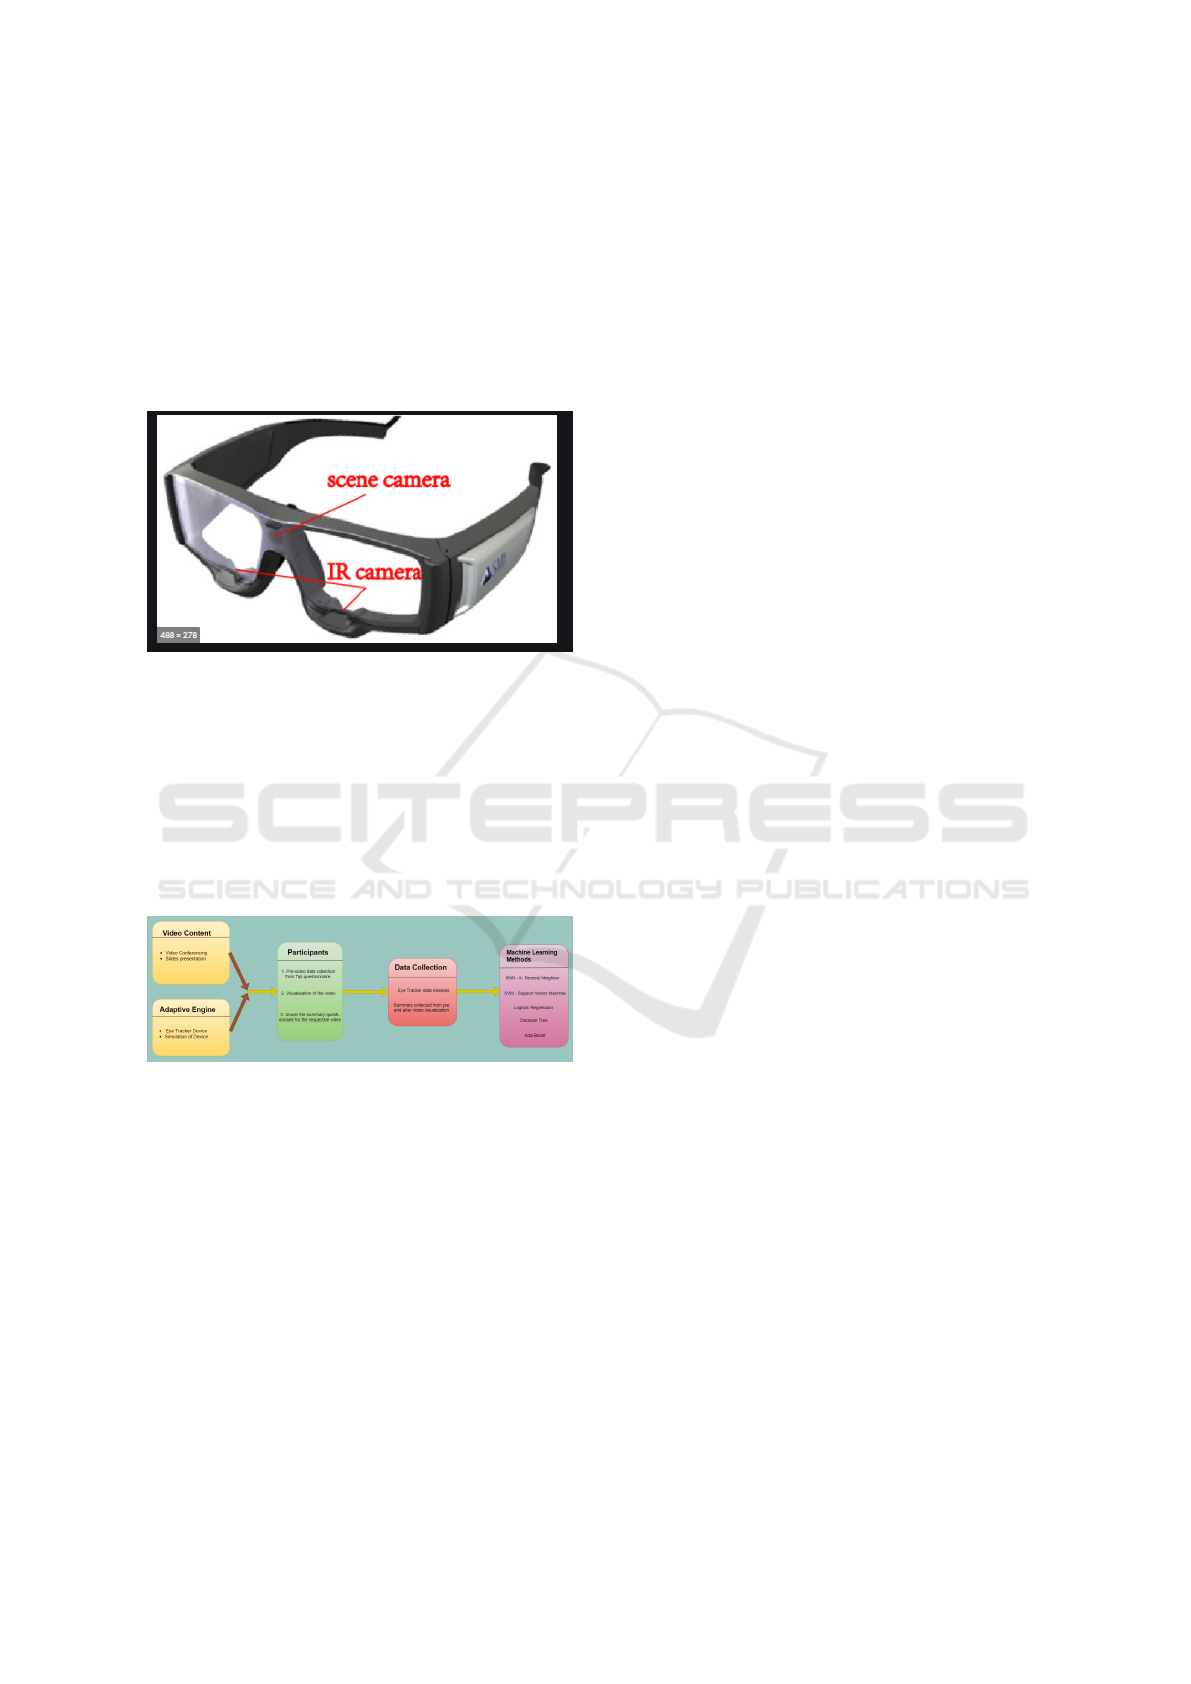
The experiment was conducted in four-step, as
shown in fig.2.The online users wore the eye tracker
device while watching the lecture video of twenty-five
minutes. The lecture used in this experiment is on
mobile application development using java. The re-
sponse from the online users was stored and analyzed
by BeGaze software Gaze Intelligence. This provides
us details of gaze points, count of fixation, blink fre-
quency, and saccade.
Figure 2: Research Framework.
Further, the online users are asked to complete two
sets of questionnaires. First, is a test based on the con-
tent of the video on mobile application development.
The second is a questionnaire that collects subjective
and personality details of the online users. The ques-
tionnaire based on the learning of the video lecture
contains easy, medium and hard questions from the
video. The personality questionnaire contains gender,
age and Ten Item Personality Inventory (TIPI) ques-
tionnaire, sleepiness and cognitive load analysis such
as KSS (Karolinska Sleepiness Scale) and SSS (Stan-
ford Sleepiness Scale) is collected. TIPI Question-
naire contains a total of ten attributes or characteris-
tics such as Extroverted, enthusiastic, Critical, quar-
relsome etc, the response of these attributes is mea-
sured from a scale of 0 to 7. The result of calcula-
tion over the response from TIPI questionnaire will
provide 5 personality traits of the online users which
are Extraversion, Agreeableness, Conscientiousness,
Emotional Stability and Openness to Experiences.
The dataset for this research is collected from
the experiment conducted, by monitoring and record-
ing the eye movement, performance, and answer to
the questionnaire by the participants. The dataset is
stored in an Excel (xlsx) format. There are two data
files containing details extracted from the eye tracker
device and the response of the questionnaire respec-
tively. The data file with eye tracker device responses
contains 32 columns with information about eye stim-
ulus during the experiment. The second data file with
17 columns contains the information about personal
detail, test result, and Tippi questions response. The
dataset collected for this research satisfies the ethical
and privacy requirements.
The data file with responses from the eye tracker
experiment contains details like Visual Intake, Sac-
cade, and blink attributes. For all these attributes the
detail such as count, frequency, total interval, average
interval, maximum interval, and the minimum inter-
val was extracted from summary metrics option from
the eye tracker device software. The count and fre-
quency of attributes are measured in decimal and the
intervals are measured in milliseconds.
The second data file contains details collected
from the response to the questionnaire by the on-
line users, which contains age, gender, SSS (Stan-
ford Sleepiness Scale), KSS (Karolinska Sleepiness
Scale), Test results from the experiment, and answer
to social cognition and Tippi questionnaire. The SSS
and KSS are measured in decimals ranging from one
to nine and one to ten respectively. The online users
can get the highest of 12 marks in the test based on
the video. These two data files are further merged us-
ing the participant assigned unique identification. The
next subsection will discuss data quality, transforma-
tion, and feature selection in detail.
All the steps for data transformation and pre-
processing are performed using Python Jupyter Note-
book. This phase in the research deals with data
exploration and insights such as missing or wrong
data, calculation of new attributes, and transforma-
tion of data. Firstly, as a part of data exploration,
dataset is checked for missing values and the pres-
ence of. Then in the second stage data transformation
was performed. In this step, the data was analysed
and the categorical variables were standardized, such
as gender. The unit of measurement of intervals in the
dataset was in milliseconds and seconds which was
CSEDU 2022 - 14th International Conference on Computer Supported Education
190
normalized to seconds. The normalization of the data
will improve the performance of the model. In the
third step new variable was created for PERCLOS,
that is the percentage of the time interval for which the
eye was blinked or closed by the total time interval of
the experiment. Finally, the Pearson correlation ma-
trix was plotted to understand the correlation between
the variables, and the variables with the highest cor-
relation values were omitted from the dataset before
implementation.
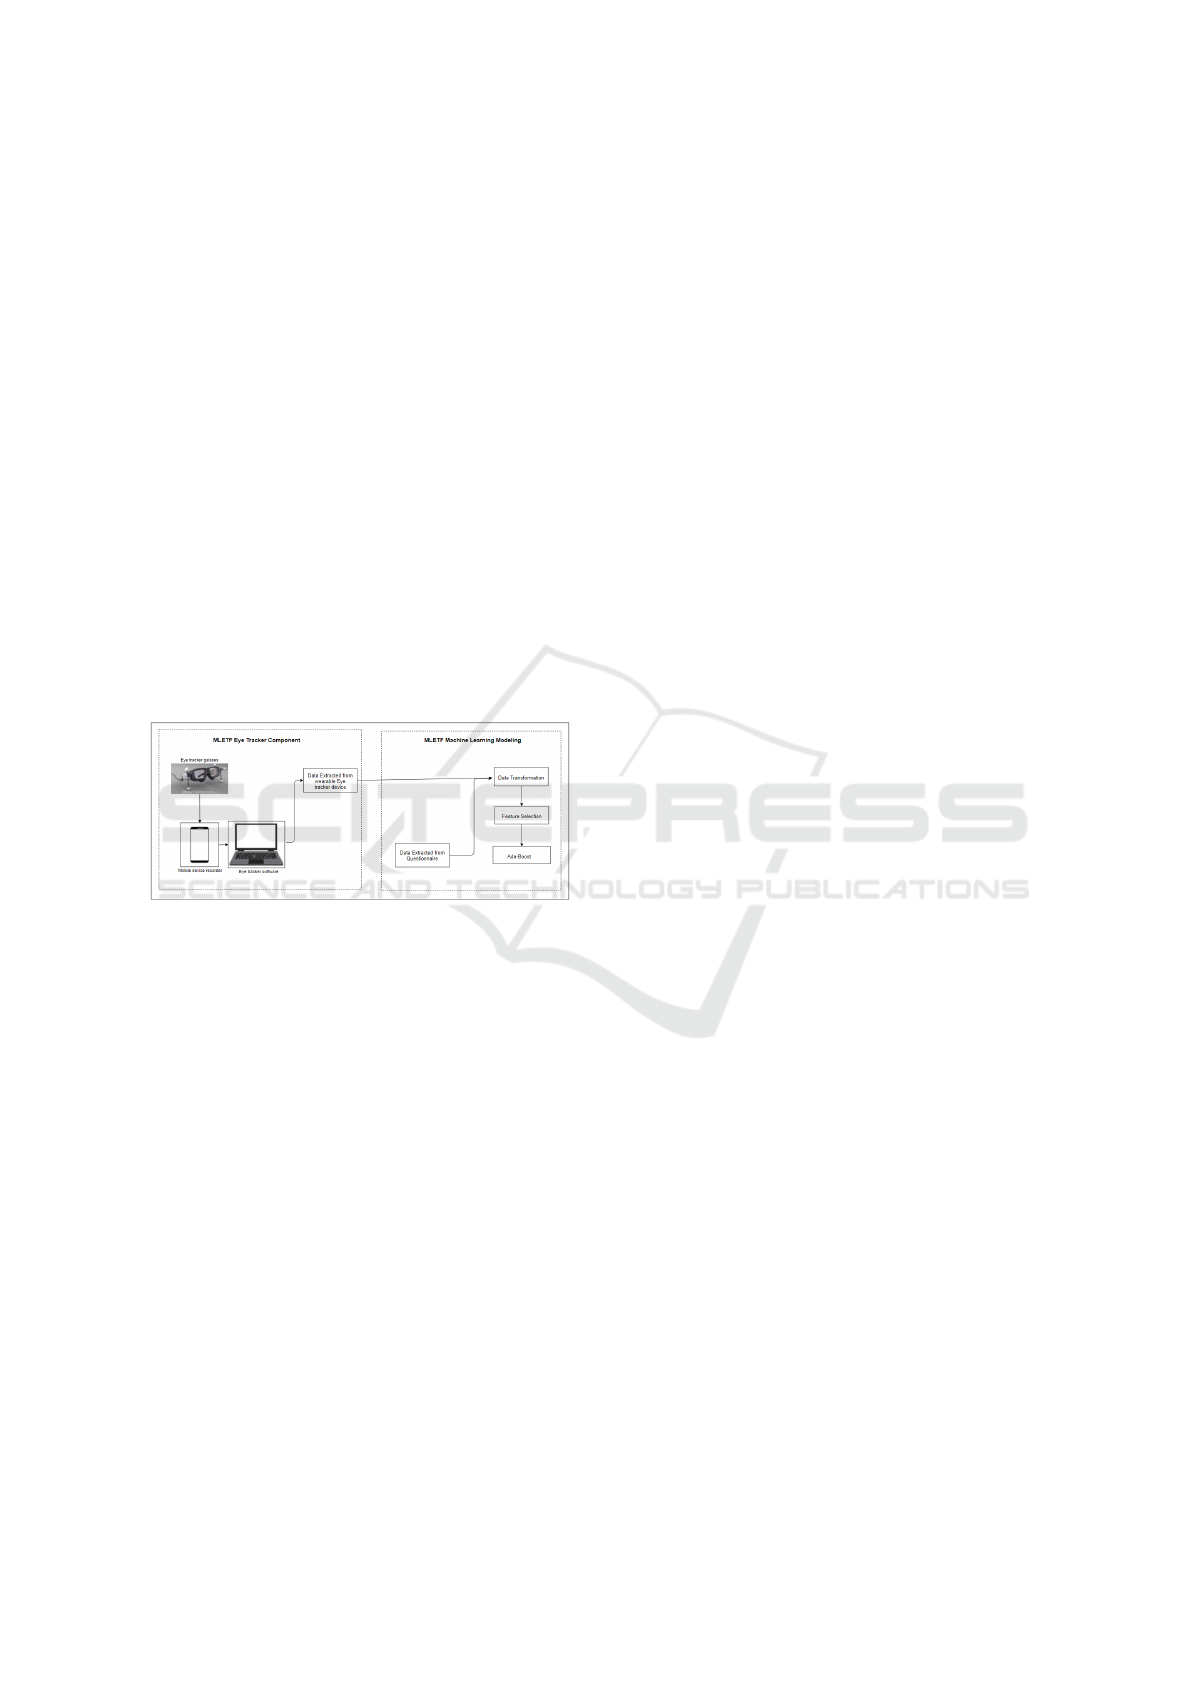
4 DESIGN
The Machine Learning-based Eye Tracking Frame-
work (MLETF) architecture combines Eye Tracker
Components and Machine learning classification
models as shown in fig. 3. The components of consist
of eye tracker glasses, mobile device recorder and eye
tracker software (beGaze), which are discussed in de-
tails in section 4.1. In section 4.2, the components of
Machine learning classification models are discussed.
Figure 3: Machine Learning based Eye Tracking Frame-
work Architecture Design.
4.1 MLETF Eye Tracker Component
There are basic three components of eye tracker de-
vice, glasses, mobile recorder and eye tracker soft-
ware. The eye tracker glasses has three mounted cam-
eras which will record the movement and stimulus of
eyes of the online user. This stimulus will be recorded
using the mobile device recorder. The recorded re-
sponse is stored in an external storage device using
mobile. Then the recorded video is updated in the eye
tracker software for further processing and extraction
of different attributes and features from eye tracker
device. The features extracted from eye tracker de-
vice are gaze point, visual intake duration, visual in-
take frequency and count, saccade count, saccade am-
plitude, saccade amplitude, saccade velocity, saccade
latency, blink count, blink duration, and blink fre-
quency. The extracted data from eye tracker device
are loaded into excel file for further analysis.
4.2 Machine Learning Models
The machine learning model of the MLETF frame-
work contains data transformation, feature selection
from the data extracted from eye tracker device and
questionnaire, which is further used for implementa-
tion of Ada-Boost. The data is extracted from two
questionnaire presented to the online users after ex-
periment through Microsoft and google forms. The
responses from online users are exported from these
forms and are stored in excel format file. For detec-
tion of zoom fatigue, the dataset collected is divided
into ratio of 8:2 for train and test split. Further Ad-
aBoost is implemented over the selected feature from
the dataset.
5 IMPLEMENTATION
The MLETF (Machine Learning based Eye Track-
ing Framework) was implemented using Python
Programming Language, Jupyter Notebook as IDE
(Python 3.8.5). Python Libraries such as Pandas,
Numpy, os and scikit learn (sklearn) were used. The
two data files were extracted using read excel contain-
ing data extracted from wearable eye tracker device
and questionnaire, which were merged using unique
identification number for experiments. Additional at-
tributes were created and calculated for tipi and PER-
CLOS calculation, such as Extraversion, Agreeable-
ness, Conscientiousness, Emotional Stability, Open-
ness to work and PERCLOS. Furthermore, the dataset
was divided into 8:2 ratio for train and test split us-
ing library scikit learn and import train test split, with
random state as 123 and shuffle as true. Furthermore,
5 Machine Learning models SVM, KNN, Logistic re-
gression, decision tree, Ada-boost) were implemented
on the trained dataset using the scikit learn python li-
brary.
6 EVALUATION
The aim of this research is to detect zoom fatigue
using the proposed MLETF. Machine learning algo-
rithms are implemented over the data collected from
the eye tracker device to compare and analyse the ex-
tent of detection of Zoom fatigue. Multi-class classi-
fication models are used with 3 levels (negligible sign
of fatigue, slight fatigue and zoom fatigue) of fatigue
are taken into account(Salvati et al., 2021). Below are
the series of experiments performed beginning with
the state of art.
A Machine Learning based Eye Tracking Framework to Detect Zoom Fatigue
191
6.1 Experiment 1: Comparison of SVM,
LR, KNN and Ada-Boost with
Eye-tracker Data
The aim of this experiment is to investigate accuracy
of different machine learning models for prediction of
zoom fatigue using the data collected from eye tracker
device. The dataset was divided into an 80:20 split
ratio for training and test data with data shuffling as
random. The dataset for this experiment contains the
total count, count of frequency, duration of visual in-
takes, saccade, and blinks. In addition, the total am-
plitude, velocity, and latency of the saccade are also
included.
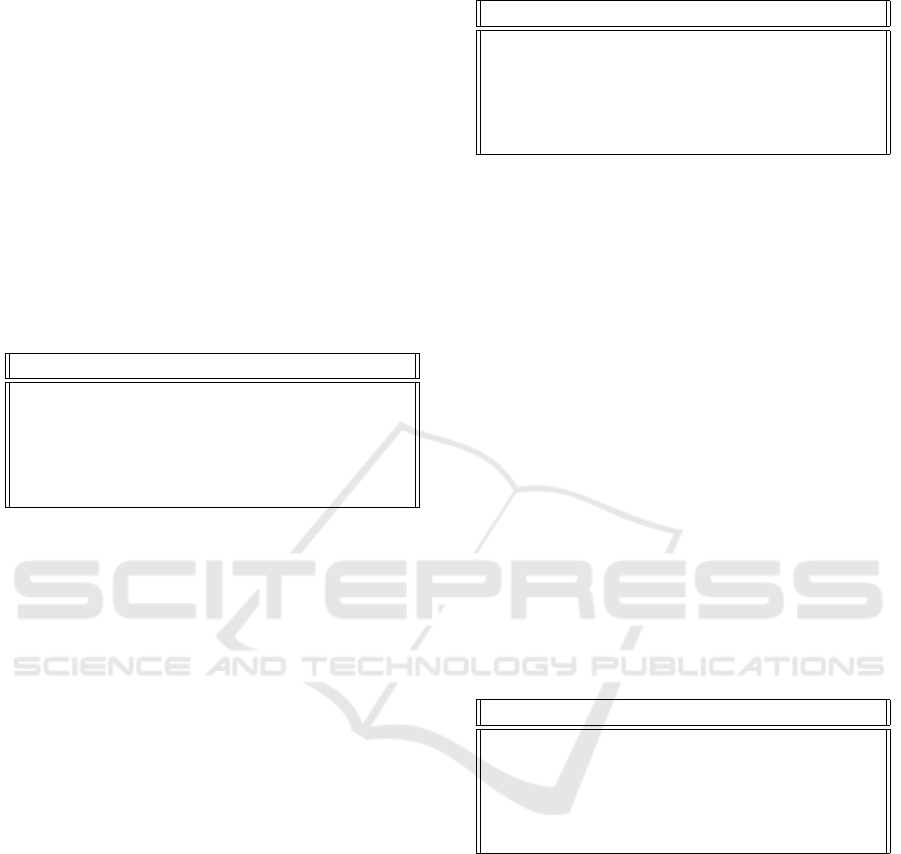
Table 1: Results of Experiment 1.
Machine Learning model Accuracy
SVM 0.43
Logistic Regression 0.43
KNN 0.71
Decision Tree 0.29
Ada-Boost 0.29
Table 1 shows the results obtained by the machine
learning models for experiment 1. This table shows
that KNN was able to achieve the highest accuracy
of around 71% from the dataset collected by the eye
tracker device, followed by SVM and Logistic Re-
gression with 43%. The next experiment shows to
what extent the accuracy in prediction of zoom fa-
tigue can be improved with the addition of calculated
PERCLOS, that is percentage of total blink duration
to total duration.
6.2 Experiment 2: Machine Learning
Models with Eye-tracker Data and
PERCLOS
The aim of this experiment is to investigate if the ac-
curacy can be improved using the calculated PERC-
LOS, that is percentage of total blink duration to to-
tal duration. The dataset was divided into an 80:20
split ratio for training and test data with data shuffling
as random. The calculated attribute PERCLOS is the
ratio of the time interval for blink by the total time
interval is also included.
Table 2 shows us the results obtained by different
machine learning models for experiment 2. This table
shows that KNN has achieved a total of 57% accuracy
in the detection of zoom fatigue. Followed by SVM,
and logistic regression with an accuracy of the model
as 43%. The PERCLOS doesn’t provide any positive
impact for detection of zoom fatigue. In the next ex-
Table 2: Results of Experiment 2.
Machine Learning model Accuracy
SVM 0.43
Logistic Regression 0.43
KNN 0.57
Decision Tree 0.29
Ada-Boost 0.29
periment, we will see to what extent the accuracy in
the prediction of zoom fatigue can be improved with
the addition of data extracted from the questionnaire.
6.3 Experiment 3: Machine Learning
Models with Eye-tracker Data and
Questionnaire Dataset
The aim of this experiment is to investigate accuracy
can be improved by addition of data extracted from
questionnaire with data collected from eye tracker de-
vice. The dataset is divided into an 80:20 split ratio
for training and test data with data shuffling as ran-
dom. The dataset for this experiment contains a com-
bination of the data collected from the eye tracker de-
vice, such as total count, count of frequency, duration
of visual intakes, saccade, and blinks. In addition,
data from questionnaires such as age, SSS, gender,
and score obtained from the summary test of the ex-
periment is also added.
Table 3: Results of Experiment 3.
Machine Learning model Accuracy
SVM 0.71
Logistic Regression 0.71
KNN 0.57
Decision Tree 0.71
Ada-Boost 0.86
Table 3 shows the results obtained by different
machine learning models for experiment 3. This ta-
ble shows that Ada-boost has achieved an accuracy of
86% in detection of zoom fatigue with learning rate
as 3 for the data extracted from eye tracker device and
questionnaire. Followed by SVM, Decision Tree, and
logistic regression with an accuracy of the model as
71%. And KNN shows the lowest accuracy for this
experiment with an accuracy of 57%. The personal
information such as age, response to SSS (Stanford
sleepiness scale), and the output from the eye tracker
test provide a good impact in the detection of zoom
fatigue. The next experiment, investigates to what
extent the accuracy in the prediction of zoom fatigue
can be improved when we consider the data extracted
CSEDU 2022 - 14th International Conference on Computer Supported Education
192
from the eye tracker device, questionnaire, and calcu-
lated PERCLOS.
6.4 Experiment 4: Machine Learning
Models, with Eye-tracker Data,
PERCLOS and Questionnaire
Dataset
The aim of this experiment is to investigate accu-
racy can be improved by addition of PERCLOS and
data collected from questionnaire with data extracted
from eye tracker device. The dataset is divided into
an 80:20 split ratio for training and test data with
data shuffling as random. The dataset for this ex-
periment contains a combination of the data collected
from the eye tracker device, such as total count, count
of frequency, duration of visual intakes, saccade, and
blinks. In addition, data from questionnaires such as
age, SSS, gender, and score obtained from the sum-
mary test of the experiment and PERCLOS is also
added.
Table 4: Results of Experiment 4.
Machine Learning model Accuracy
SVM 0.71
Logistic Regression 0.71
KNN 0.57
Decision Tree 0.57
Ada-Boost 0.71
Table 4 shows the results obtained by different
machine learning models for experiment 4. From
this table, we see that the machine learning algorithm
Ada-boost, SVM and logistic regression has achieved
an accuracy of 71% in prediction of Zoom Fatigue.
The PERCLOS has lowered the accuracy of machine
learning algorithms and doesn’t provide any positive
impact in detection of zoom fatigue. Following the
experiment, the next section will describe the key
findings and discussion related to this research.
7 DISCUSSION
This section aims to discuss the above-performed ex-
periment and the obtained results. The research be-
gins with the collection of data from the experiment
conducted with the eye tracker device and the ques-
tionnaire including personality as well as a summary
test of the video.
Section 6, Evaluation demonstrates four experi-
ments for detection of zoom fatigue in online users.
Five machine learning algorithms SVM, Logistic Re-
gression, KNN, Decision Tree, and Ada-Boost are
implemented to compare the performance for the de-
tection of zoom fatigue in this research. In the first
experiment, the data collected from the eye tracker
device, for the detection of zoom fatigue in the on-
line users is used, the result showed that KNN has
achieved an accuracy of 71%.
In the second and fourth experiments PERCLOS
is included, which is the percentage calculation of to-
tal blink duration and total time interval. The result
showed that the addition of PERCLOS in the dataset
has reduced the performance of detection of Zoom
Fatigue. But the previous research demonstrated that
PERCLOS is a key attribute for detection of mental
fatigue. This character of PERCLOS can be stud-
ied, for understanding why PERCLOS has reduced
performance of MLETF but has demonstrated a good
performance for detection of mental fatigue. Hence,
the ratio of blink duration and total interval doesn’t
provide subsequent input for detection of zoom fa-
tigue, but individually the blink duration and total in-
terval provide good performance in the detection of
zoom fatigue. In third experiment, the dataset with
combination of data collected from the eye tracker
device and the questionnaire is considered. The re-
sult of this experiment showed that Ada-Boost has
achieved the highest accuracy in detecting zoom fa-
tigue with 86%, and another machine learning algo-
rithm has also shown better performance than other
experiments. Where SVM, Logistic Regression, and
Decision Tree have resulted in 71% accuracy.
The evaluation of the data extracted from eye
tracker device and questionnaire response by the on-
line users are considered in this research, but there
are other factors which might affect these findings.
Zoom fatigue in online users can be impacted by the
length of the video. The video length for this research
is 25 minutes, but by elongation or reduction of the
video length will impact on the zoom fatigue of online
users. Also, during experiment there was no specific
distance maintained between the online users and the
computer screen. One of the reasons for development
of Zoom fatigue is the increased intensity due to close
up eye contact with the computer screen.
8 CONCLUSIONS AND FUTURE
WORK
This research proposes a MLETF for the detection of
zoom fatigue in online users, this analysis was done
with data collected from experiments using the eye
tracker device, data collected from the response of
questionnaire, and calculated field PERCLOS. The
A Machine Learning based Eye Tracking Framework to Detect Zoom Fatigue
193

result of the experiment highlights that prediction of
zoom fatigue from the data collected by eye tracker
device and questionnaire has good accuracy for
classification models such as Ada-Boost, Logistic
Regression, SVM and Decision Tree. The feature set
in the research contains 24 variables, which includes
data from the eye tracker device, responses from the
questionnaire, and calculated PERCLOS. The results
of the experiment showed that the data collected by
eye tracker device and questionnaire attained the
highest accuracy in prediction of zoom fatigue with
Ada-Boost at 86% and SVM, Logistic Regression
and Decision Tree with an accuracy 71%. Zoom
fatigue is a form of mental fatigue that can be hard
on brains which makes brains exhausted quickly.
By determining these features new measures can be
practised or introduced for minimizing the effect of
zoom fatigue.
Overall, the research shows that MLETF is capa-
ble of predicting zoom fatigue in online users by the
data extracted from the eye tracker device and the re-
sponse from the questionnaire. The future work of
this research can be extended to the inclusion of more
details from the eye tracker device, and the addition of
personal and subjective traits of the online users. The
impact of length of video, distance from the screen
and eye can also be evaluated for detection of zoom
fatigue. Depending upon the model and license of the
eye tracker device, some attributes such as pupil dila-
tion, pupil fixation, etc. can be extracted from the ex-
periment, which might affect the prediction of zoom
fatigue. Also, subjective and personal traits such as
NASA-TLX can provide details and the effect of cog-
nitive load over an online user’s zoom fatigue. More-
over, this approach can be used to detect zoom fatigue
in domains such as medical, engineer, driving, etc.
REFERENCES
Acı, C¸ .
˙
I., Kaya, M., and Mishchenko, Y. (2019). Dis-
tinguishing mental attention states of humans via an
eeg-based passive bci using machine learning meth-
ods. Expert Systems with Applications, 134:153–166.
Barrios, V. M. G., G
¨
utl, C., Preis, A. M., Andrews, K.,
Pivec, M., M
¨
odritscher, F., and Trummer, C. (2004).
Adele: A framework for adaptive e-learning through
eye tracking. Proceedings of IKNOW, pages 609–616.
Boksem, M. A., Meijman, T. F., and Lorist, M. M. (2006).
Mental fatigue, motivation and action monitoring. Bi-
ological psychology, 72(2):123–132.
Cheng, Q., Wang, W., Jiang, X., Hou, S., and Qin, Y.
(2019). Assessment of driver mental fatigue using fa-
cial landmarks. IEEE Access, 7:150423–150434.
Cui, Z., Sun, H.-M., Yin, R.-N., Gao, L., Sun, H.-B.,
and Jia, R.-S. (2021). Real-time detection method
of driver fatigue state based on deep learning of face
video. Multimedia Tools and Applications, pages 1–
21.
Esposito, F., Otto, T., Zijlstra, F. R., and Goebel, R. (2014).
Spatially distributed effects of mental exhaustion on
resting-state fmri networks. PLoS One, 9(4):e94222.
Fauville, G., Luo, M., Muller Queiroz, A. C., Bailenson,
J. N., and Hancock, J. (2021). Zoom exhaustion &
fatigue scale. Available at SSRN 3786329.
Gao, X.-Y., Zhang, Y.-F., Zheng, W.-L., and Lu, B.-L.
(2015). Evaluating driving fatigue detection algo-
rithms using eye tracking glasses. In 2015 7th In-
ternational IEEE/EMBS Conference on Neural Engi-
neering (NER), pages 767–770. IEEE.
He, J., Choi, W., Yang, Y., Lu, J., Wu, X., and Peng, K.
(2017). Detection of driver drowsiness using wearable
devices: A feasibility study of the proximity sensor.
Applied ergonomics, 65:473–480.
Intayoad, W., Becker, T., and Temdee, P. (2017). So-
cial context-aware recommendation for personalized
online learning. Wireless Personal Communications,
97(1):163–179.
Ivanovi
´
c, M., Kla
ˇ
snja-Mili
´
cevi
´
c, A., Ivkovi
´
c, J., and Porta,
M. (2017). Integration of eye tracking technologies
and methods in an e-learning system. In Proceedings
of the 8th Balkan Conference in Informatics, pages 1–
4.
Joe Louis Paul, I., Sasirekha, S., Uma Maheswari, S., Ajith,
K., Arjun, S., and Athesh Kumar, S. (2019). Eye
gaze tracking-based adaptive e-learning for enhancing
teaching and learning in virtual classrooms. In Infor-
mation and Communication Technology for Competi-
tive Strategies, pages 165–176. Springer.
Jonsson, M. and Brown, J. (2021). Deep learning for
driver sleepiness classification using bioelectrical sig-
nals and karolinska sleepiness scale.
Kacur, J., Polec, J., Csoka, F., and Smolejova, E. (2019).
Gmm based detection of schizophrenia using eye
tracking. In 2019 IEEE Conference on Computational
Intelligence in Bioinformatics and Computational Bi-
ology (CIBCB), pages 1–4. IEEE.
Li, J., Li, H., Umer, W., Wang, H., Xing, X., Zhao, S.,
and Hou, J. (2020). Identification and classification
of construction equipment operators’ mental fatigue
using wearable eye-tracking technology. Automation
in Construction, 109:103000.
Lowndes, B. R., Forsyth, K. L., Blocker, R. C., Dean, P. G.,
Truty, M. J., Heller, S. F., Blackmon, S., Hallbeck,
M. S., and Nelson, H. (2020). Nasa-tlx assessment of
surgeon workload variation across specialties. Annals
of surgery, 271(4):686–692.
Monteiro, T. G., Zhang, H., Skourup, C., and Tannuri, E. A.
(2019). Detecting mental fatigue in vessel pilots using
deep learning and physiological sensors. In 2019 ieee
15th international conference on control and automa-
tion (icca), pages 1511–1516. IEEE.
Morris, B. (2020). Why does zoom exhaust you? science
has an answer. Wall Street Journal, 27.
CSEDU 2022 - 14th International Conference on Computer Supported Education
194

Nadler, R. (2020). Understanding “zoom fatigue”: The-
orizing spatial dynamics as third skins in computer-
mediated communication. Computers and Composi-
tion, 58:102613.
Riedl, R. (2021). On the stress potential of videoconfer-
encing: definition and root causes of zoom fatigue.
Electronic Markets, pages 1–25.
Salvati, L., d’Amore, M., Fiorentino, A., Pellegrino, A.,
Sena, P., and Villecco, F. (2021). On-road detection of
driver fatigue and drowsiness during medium-distance
journeys. Entropy, 23(2):135.
Schleicher, R., Galley, N., Briest, S., and Galley, L.
(2018). Blinks and saccades as indicators of fatigue
in sleepiness warnings: looking tired? Ergonomics,
51(7):982–1010.
Ungureanu, F., C
ˆ
IMPANU, C., and DUMITRIU, T. (2020).
The impact of learning through cognitive load assess-
ment and emotional state evaluation. eLearning &
Software for Education, 2.
Wu, E. Q., Deng, P.-Y., Qu, X.-Y., Tang, Z., Zhang, W.-M.,
Zhu, L.-M., Ren, H., Zhou, G.-R., and Sheng, R. S.
(2020). Detecting fatigue status of pilots based on
deep learning network using eeg signals. IEEE Trans-
actions on Cognitive and Developmental Systems.
Yamada, Y. and Kobayashi, M. (2018). Detecting mental fa-
tigue from eye-tracking data gathered while watching
video: Evaluation in younger and older adults. Artifi-
cial intelligence in medicine, 91:39–48.
Yu, Q., Ke, X., Yang, D., Zhang, W., and Yang, B. (2020).
Mental fatigue testing based on deep learning. In 2020
IEEE 9th Joint International Information Technology
and Artificial Intelligence Conference (ITAIC), vol-
ume 9, pages 32–35. IEEE.
A Machine Learning based Eye Tracking Framework to Detect Zoom Fatigue
195
