
Pedestrian Activity Recognition from 3D Skeleton Data using Long Short
Term Memory Units
Qazi Hamza Jan, Yogitha Sai Baddela and Karsten Berns
Robotics Research Lab, Technische Universit
¨
at Kaiserslautern, 67663 Kaiserslautern, Germany
Keywords:
Pedestrian-zone, Activity Recognition, Pedestrian’s Activity, Long Short-term Memory, 3D Skeleton Activity.
Abstract:
The pace of advancement in the realm of autonomous driving is quickening, raising concerns and escalating
expectations for pedestrian safety, intelligence, and stability. In dynamic and uncertain contexts, some sce-
narios necessitate distinguishing pedestrian position and behavior, such as crossing or standing. The ability to
recognize a pedestrian is a critical component of autonomous driving success. Before making an appropriate
response, the vehicle must detect the pedestrian, identify their body movements, and comprehend the signif-
icance of their actions. In this paper, a detailed description of the architecture for 3D activity recognition of
a pedestrian using Recurrent Neural Networks (RNN) is presented. In this work, a custom dataset that was
created from an autonomous vehicle of RRLAB at the Technische Universit
¨
at Kaiserslautern is employed. The
information was gathered for behaviors such as parallel crossing, perpendicular crossing, texting, and phone
calls, among others. On the data, models were trained, and Long-Short Term Memory (LSTM), a recurrent
neural network has shown to be superior to Convolution Neural Networks (CNN) in terms of accuracy. Vari-
ous investigations and analyses have revealed that two models trained independently for upper and lower body
joints produced better outcomes than one trained for all joints. On a test data, it had a 97 percent accuracy for
lower body activities and an 88-90 percent accuracy for upper body activities.
1 INTRODUCTION
With the growing number of Autonomous Vehicles
(AVs) in pedestrian zones, pedestrian activity recog-
nition plays a major role in the safe and smooth nav-
igation of such vehicles. Safe navigation for AVs be-
comes challenging in such zones due to the haphazard
movement of pedestrians over the entire width of the
pedestrian zone. Distracted pedestrians, such as talk-
ing or texting on their phones, pay less attention to
their surroundings. Also, signal-free and unmarked
sections obfuscate the crossing behavior of pedestri-
ans with an AV; hence, menacing the driving behav-
ior of AVs. Sensing the environment and recogniz-
ing pedestrian behavior reduces the risk of any colli-
sion and allows the AV to plan its navigation before
time. Therefore, the classification of pedestrian activ-
ity plays a vital role in such scenarios.
The goal of this paper, inspired by the aforemen-
tioned motivation, is to classify human activities at
pedestrian zones in the vicinity of an AV. Experi-
ments were performed using the AV shown in Fig-
ure 1. This is a minibus that can carry around 8 pas-
sengers from building to building on the campus of
Figure 1: Driver-less minibus for navigating through
pedestrian-zones (Jan and Berns, 2021).
Technische Universit
¨
at Kaiserslautern. Convinced by
the concept of interaction in our previous work in (Jan
et al., 2019), the purpose of such an AV is to interact
with pedestrians based on pedestrian activities. The
interaction between an AV and a pedestrian is more
meaningful if the AV can classify the behavior of the
pedestrians. A frequent class of activities exhibited
by the pedestrians was using a mobile phone, paral-
lel crossing, and perpendicular crossing. The activ-
ities were sub-categorized including the direction of
crossing as well. Later, these activities were divided
368
Jan, Q., Baddela, Y. and Berns, K.
Pedestrian Activity Recognition from 3D Skeleton Data using Long Short Term Memory Units.
DOI: 10.5220/0011075700003191
In Proceedings of the 8th International Conference on Vehicle Technology and Intelligent Transport Systems (VEHITS 2022), pages 368-375
ISBN: 978-989-758-573-9; ISSN: 2184-495X
Copyright
c
2022 by SCITEPRESS – Science and Technology Publications, Lda. All rights reserved
into upper and lower activities to distinguish between
static and dynamic activities to examine for better ac-
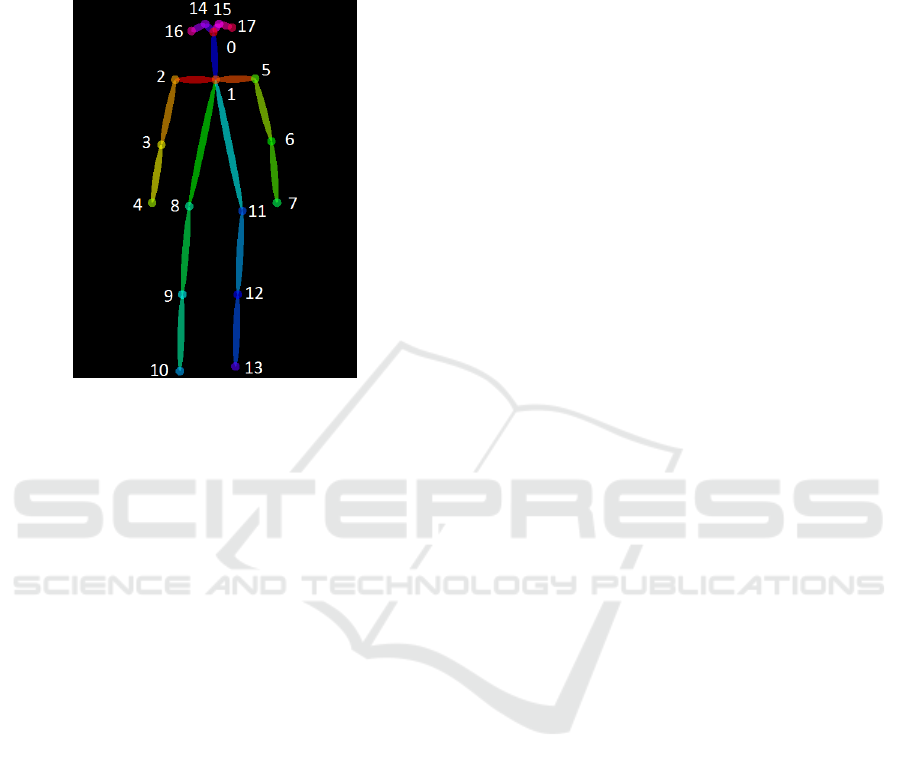
curacy. The input data collected is a 3-dimensional
data of 18 joints as seen in Figure 2.
Figure 2: Formation of 18 key-points skeleton (Cao et al.,
2019).
To capture the direction of motion in the activi-
ties legitimates the use of LSTM model by feeding
in temporal data. Temporal data allows us to predict
the present based on past occurrences in time. This
allows to correctly classify the activity. The main
contribution of this work is to use an LSTM model
which works directly with 18 skeleton points to rec-
ognize the human activity. This immensely reduces
the computing power as well as the processing time.
Since there wasn’t any dataset available for 3D skele-
ton joint points with activities specific to the pedes-
trian zone. It was also required to create a custom
dataset specific to such zones. Section 3 gives the de-
tails of the dataset created, and Section 4 explains the
approaches used in this work. The overall architecture
of the system is given in Section 5. Detailed experi-
ments and results are shown in Section 6.
2 RELATED-WORK
Pedestrian activity recognition has become significant
for AVs adapted for driving around people. State-of-
the-art approaches in 2D and 3D activity recognition
are explained in this section.
In (Pandey and Aghav, 2020), a video is fed to
a network of two modules. The first module de-
tects pedestrians using faster RCNN and the output
is then given to the pose estimation module using
OpenPose (Cao et al., 2019). Output is then passed
to a classifier to identify ”crossing” or ”not cross-
ing” the road. The framework is tested on a Joint At-
tention in Autonomous Driving (JAAD) dataset (Ra-
souli et al., 2017). The dataset focuses on scenes at
zebra-crossings. The movement of pedestrians is con-
strained to a particular region (footpaths and cross-
ings). More perilous activities, such as using a smart-
phone, are not recognized in the paper.
A model that takes into account pedestrian pose
recognition, as well as lateral speed, motion direc-
tion, and the environment’s spatial structure, is pro-
posed in paper (Hariyono and Jo, 2015). The spatial
body language ratio is used to distinguish pedestrian
poses. Point-tracking the centroid of detected pedes-
trian results in motion tracking. The height of the
bounding box divided by the centroid location from
the ground plane defines a walking human. The ac-
tions that are classified using a naive-Bayesian classi-
fier are walking, starting, bending, and stopping. The
focus is again on a zebra-crossing specific area.
The approach proposed in (Sanchez-Caballero
et al., 2020) is based on the 3DFCNN, a fully con-
volutional 3D neural network that automatically en-
codes Spatio-temporal patterns from depth sequences
without the need for pre-processing. It uses raw
depth image sequence by RGB-D camera. The
network is trained and tested on NTU RGB+D
dataset (Shahroudy et al., 2016) which contains 60
different human actions. Another methodology sug-
gested in paper (Duan et al., 2021), known as pose-
3D as an alternative to graph convolution networks
(GCN). It is a skeleton-based activity recognition sys-
tem and 3D heat maps are generated by stacking 2D
heat maps over time. A 3D CNN is implemented on
the 3D heatmaps to recognize the actions. Although
the framework has successfully achieved better re-
sults, the drawback is the 2D to 3D lifting in the ini-
tial stages and it is trained on NTU RGB data which
is collected using Kinect. Hence, the focus is on in-
door activities. The disadvantage of using Kinect is
that the accuracy is greatly dependent on surround-
ings. It does not work well outdoors. When joints are
estimated from RGB video outdoor, imperfect joint
condition, such as missing joints or jittering joints, is
frequently observed. Therefore, to avoid the above
mentioned limitations of different methodologies, the
approach and 3D data required for outdoor activities
led to creation of a custom data in this work.
3 CUSTOM DATASET
Training data performs an important role in machine
learning applications. The performance of networks
Pedestrian Activity Recognition from 3D Skeleton Data using Long Short Term Memory Units
369
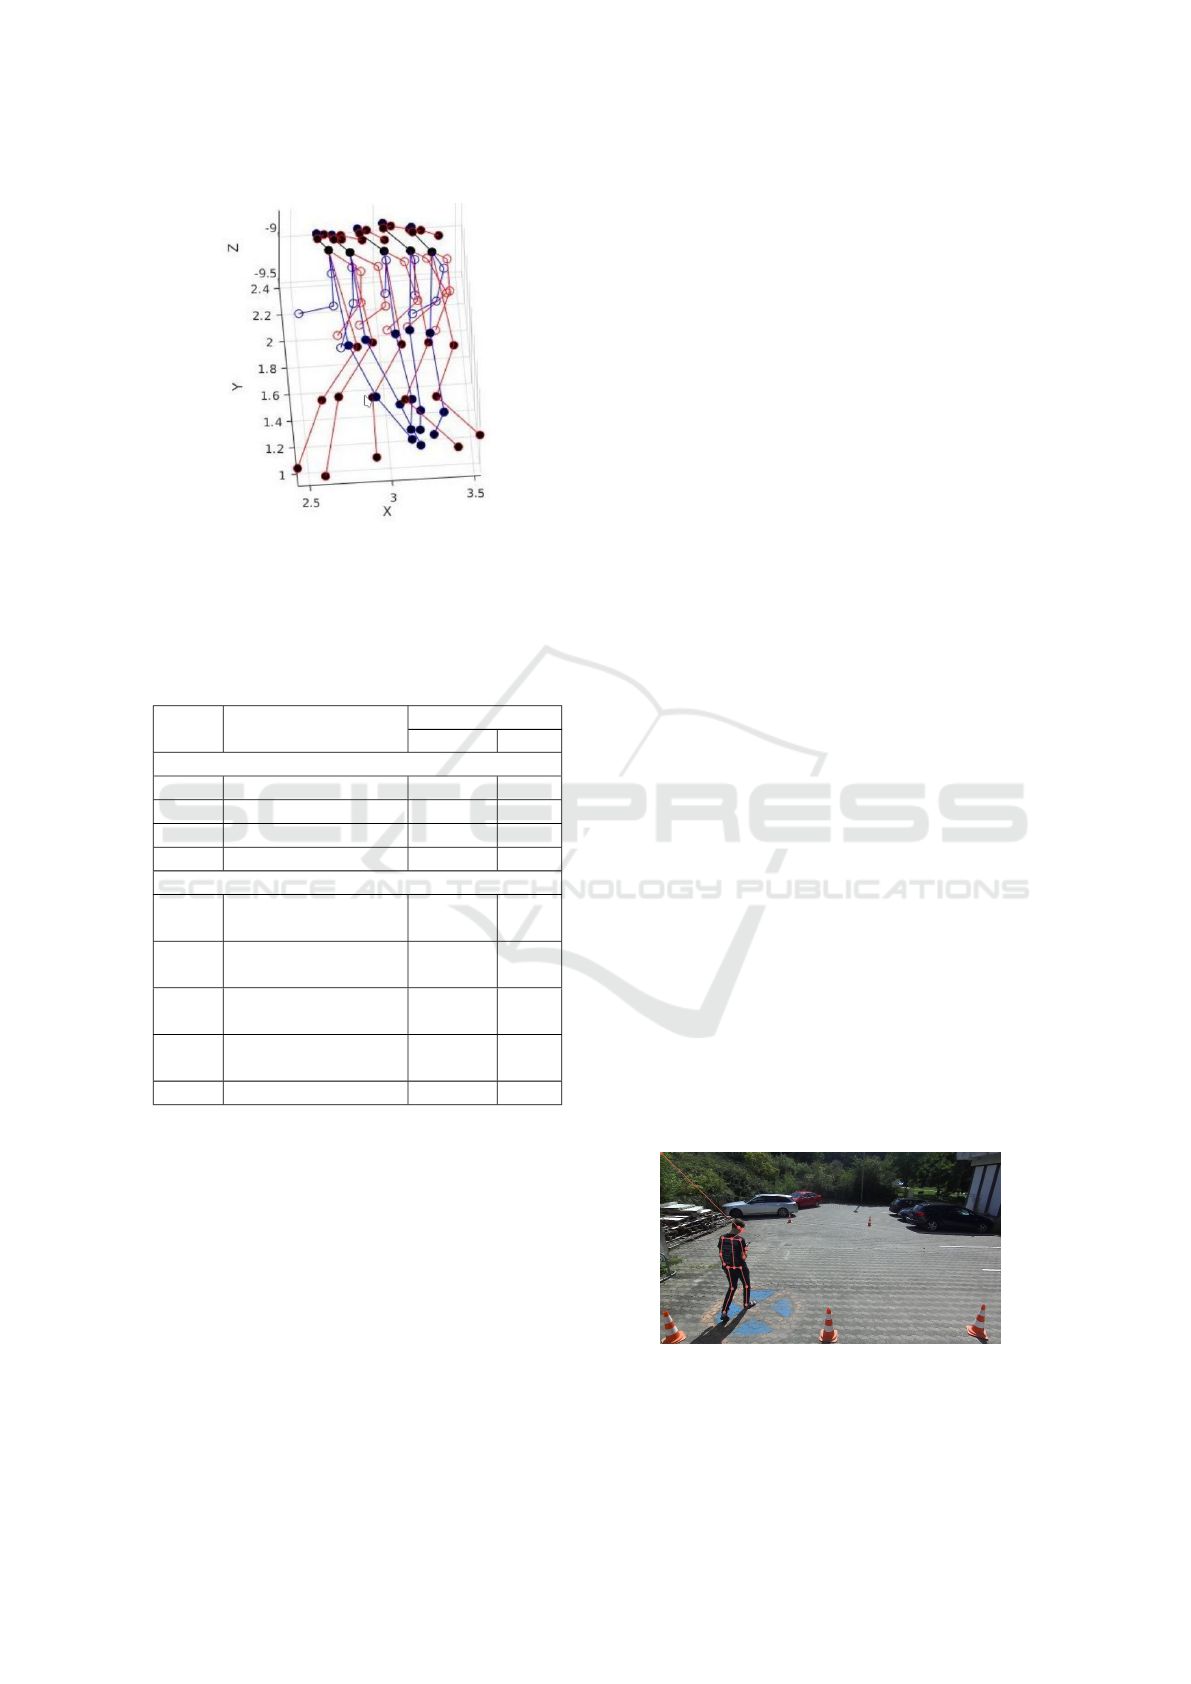
Figure 3: Sample of augmented data for 10 frames after ro-
tation of 15
◦
and x translation. The blue and red represents
the left and right joints of the skeleton, respectively, and
with respect to camera co-ordinate system. Plotting values
are in meters.
Table 1: Labels for pedestrian activities with number of se-
quences for 18 keypoints data.
Label Activity
Augmentation
Without With
Secondary
1 Calling 331 1324
2 Texting 310 1240
3 None 382 1528
4 Waving 94 376
Primary
5
Parallel Crossing
Towards
260 1040
6
parallel Crossing
Away
208 832
7
Left Perpendicular
Crossing
220 880
8
Right Perpendicular
Crossing
219 876
9 Standing 210 840
is based upon how well training data is. There exist
many datasets for 3D human activity recognition such
as dancing, walking, sitting, watching, jogging, and
so on.
Few of the popular datasets used in activity
recognition or pedestrian detection are COCO (Lin
et al., 2014), JAAD (Rasouli et al., 2017) with 346
videos of crossing and non-crossing pedestrians ac-
tivities including behavioral and context annotations,
KITTI (Geiger et al., 2012) with 15 cars and 30 pedes-
trians in each video. Also, Daimler (Pop et al., 2017)
data with stereo camera images of monochrome,
MPII (Andriluka et al., 2014) with more than 400K
activities and KAIST (Hwang et al., 2015). Some
were gathered using monocular cameras that do not
capture the depth which is why a stereo camera is
used in this work. Many of these datasets do not di-
rectly provide skeleton points in a rectangular coordi-
nate system and try to reconstruct them from image
pixels. It requires intermediate processing to convert
2D to 3D which might require different viewpoints,
variation, and rotation information. Such process-
ing and prerequisites are avoided in this work where
3D points are generated directly through stereo cam-
era and skeleton detection. Although, action recog-
nition datasets like ”NTU RGB+D (Shahroudy et al.,
2016) and ”NTU RGB+D 120” (Liu et al., 2019) us-
ing Kinect-V2 cameras contains 60 human activities,
it is recorded indoors and does not represent pedes-
trian scenarios and the presence of a minibus. It is
also recorded within a fixed distance and angle.
Moreover, aforesaid, these datasets do not include
activities specific to scenes in pedestrian zones. Some
may consider ”Crossing” and ”Not Crossing”, but,
that too, is restricted to Zebra-crossing. Therefore,
it was required to create a dataset that involved a bus
in a pedestrian zone for the realistic behavior of the
pedestrians. Environment influences a pedestrian’s
responsibility towards the traffic. Most pedestri-
ans feel safe at zebra-crossing and intersections (Ojo
et al., 2019) and exhibit risky behavior. This changes
completely where there are no markings and conven-
tional transportation. To understand this, the minibus
was driven on the campus of Technische Universit
¨
at
Kaiserslautern to observe the behavior of pedestrians.
We were then able to see how exactly pedestrians re-
acted near the vehicle. A number of day-to-day ac-
tivities were agreed upon as naturally occurring activ-
ities. The notable activities are grouped in Table 1.
The major focus for activities was the awareness and
motion of pedestrians around an AV. This includes the
usage of a mobile, crossing directions around the AV.
The first four classes, named secondary classes, focus
on activities for the upper body, and the last five activ-
ities, named primary classes, take into consideration
Figure 4: A normal walking activity with the direction of
motion away from the bus is performed for creating dataset.
The participant was told to walk between two points in an
open area.
VEHITS 2022 - 8th International Conference on Vehicle Technology and Intelligent Transport Systems
370
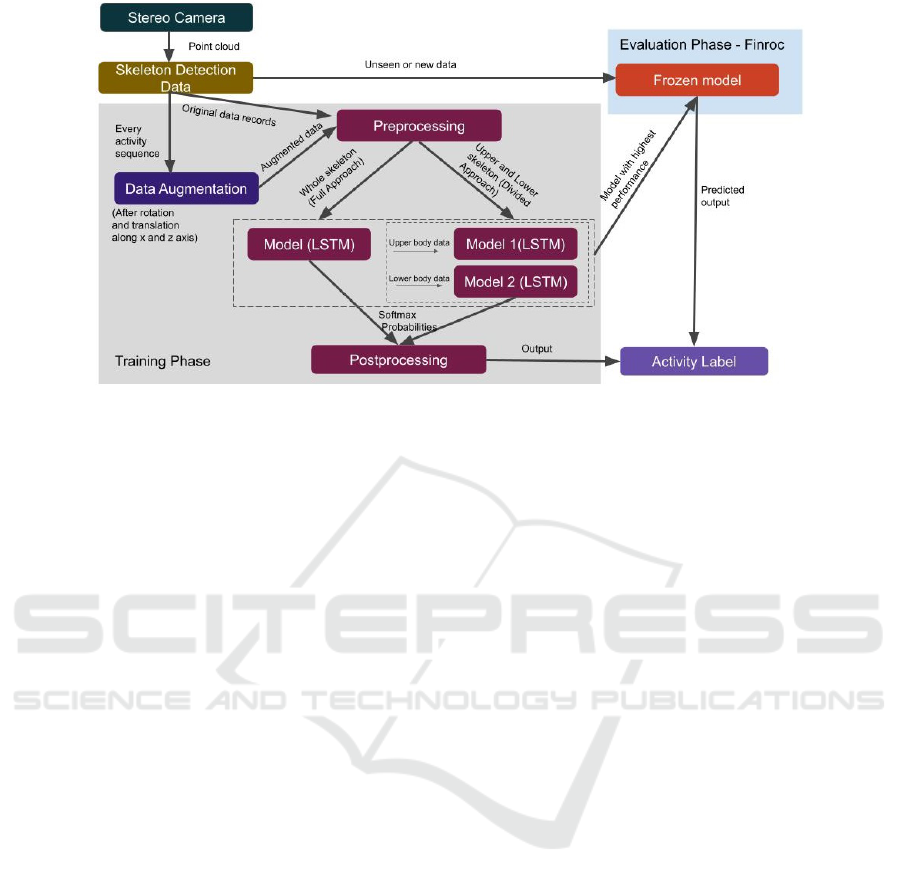
Figure 5: Architecture for upper and lower body data for 18 key-points.
the walking direction. Section 4 explains how the ac-
tivities were distributed. The data consisted of 18 3D
points of a skeleton as shown in Figure 2. The num-
ber of sequences collected for every activity is shown
in columns 3 and 4 of Table 1 without and with aug-
mentation, respectively.
For better generalization of a scene, the training
dataset was collected at different lighting conditions
and locations. The setup can be seen in Figure 4.
Every participant was told to perform all the combi-
nation of primary and secondary activities given in
Table 1. For more originality, training data was also
recorded in the driving zone on random pedestrians.
The skeletons were compared to images to recognize
the activities. All classes of activities were equally
observed except for ”standing and waving”.
Data Augmentation: In the real world, it is not possi-
ble to collect data having diverse activities of the same
class. There may exist a multitude of formations;
for instance, innumerable locations, orientations, and
speeds. This was dealt with, by rotating, flipping, and
relocating. These transformations reduce the overfit-
ting and generalize the model. Since the stereo cam-
era was mounted at an angle of 20 degrees, a rota-
tion matrix was applied for rotation values between
between 15
◦
and 25
◦
. An example can be seen in Fig-
ure 3. For X and Y co-ordinate translation, random
values between -3m and +3m were added.
Normalization: The input data used for activity
recognition are points in 3D. For secondary activ-
ities, the movement of the body remains constant
apart from the direction of motion. For example, a
pedestrian texting carries out the action throughout
the crossing. Here, the arm data and head orientation
remain the same for that activity.
Therefore, to simplify, the points are normalized
to a similar scale so they allow the data to be position
and location invariant. It is normalized using a stan-
dard scale where the mean of observed values is 0 and
the standard deviation is 1. Each secondary activity
sequence is rescaled with respect to their data values
only. Every normalized secondary data is indepen-
dent of the other sequence i.e., it was done separately
for every activity.
4 APPROACH
3D skeleton points are unstable compared to the 2D
version. In the case of 3D, some points are occluded.
This happens in different activities, for example, call-
ing the arms could be occluded depending on the di-
rection of the person to the camera. For this reason,
we were doubtful to have only a full skeleton to clas-
sify all the activities together. Hence, it was proposed
to use a Full and divided approach.
Full Approach: To explore the possibility of achiev-
ing higher accuracy, the model was once trained with
a full skeleton, i.e., giving all 18 points to the net-
work. Only augmentation was done for the full ap-
proach and the model was tested. In this approach,
only one LSTM network was used to predict the ac-
tivities. Initially, the primary and secondary classes
were concatenated and then fed to the system to get
the overall activity.
Divided Approach: In this case, the skeleton was
divided into ”upper-body” and ”lower-body” points.
The idea behind this was to separate the static and dy-
namic activities; moving legs are not static as calling
posture with reference to the body. Section 6 con-
Pedestrian Activity Recognition from 3D Skeleton Data using Long Short Term Memory Units
371
Optimizers Learning Rates
0.1 0.01 0.001 0.0001
SGD 31 33 20 38
Adam 30 27.8 56.9 60.0
RMSprop 31.3 21.2 47.1 40
(a) Full approach without augmentation
Optimizers Learning Rates
0.1 0.01 0.001 0.0001
SGD 33.53 39 20.9 40
Adam 30 27.8 56.9 61
RMSprop 36.18 36.2 47.36 45.29
(b) Full approach with augmentation.
Optimizers Learning Rates
0.1 0.01 0.001
SGD 45 41 29
Adam 28.04 28.05 46
RMSprop 30.18 32 45
(c) Upper-body without Normalization
Optimizers Learning Rates
0.1 0.01 0.001
SGD 82.00 69 30.9
Adam 28 57 82
RMSprop 80 78 35
(d) Upper-body with Normalization
Optimizers Learning Rates
0.1 0.01 0.001 0.0001
SGD 49.3 48.3 59.1 61.3
RMSprop 79 80.9 75.1 78
Adagrad 81.7 80 80.8 83.3
(e) Upper-body without Normalization after aug-
mentation
Optimizers Learning Rates
0.1 0.01 0.001 0.0001
SGD 46.85 57 85 85
RMSprop 94.85 92.5 88 52
Adagrad 91.38 89 86 89
(f) Upper-body with Normalization after augmen-
tation
Optimizers Learning Rates
0.1 0.01 0.001 0.0001
SGD 58 65 44 76
RMSprop 89 23 28 20
Adagrad 98.0 47.0 20 93.0
(g) Lower-body without augmentation
Optimizers Learning Rates
0.1 0.01 0.001 0.0001
SGD 97.4 97 96.5 96.4
RMSprop 98 98.6 98.4 99.00
Adagrad 91 72.7 98.6 98
(h) Lower-body with augmentation
Figure 6: Accuracy achieved from LSTM model for different cases.
glomerates the results for these approaches. Lower
body activity consisted of leg joints including the hip
joints, which are points from 8 to 13 shown in Fig-
ure 2. The rest of the points were used for upper
body classification. Two LSTM networks, model 1
and model 2 were separately trained for upper-body
and lower-body, respectively. During processing, the
two networks, one trained for primary activities and
the other trained for secondary activities, were used in
parallel for predicting the activities. The concatena-
tion from primary and secondary activities predicted
gave a full description of a pedestrian’s awareness
level and motion. After experimenting, it seemed suf-
ficient to, clearly, identify the primary and secondary
activities with such minimal points. The combined
activities were fully understandable. When observ-
ing the upper-body activities, the points were obscure
because of the upper-body structure: small distance
between nose, ears, and neck; distance between hand
and ears in calling posture; and occlusion of hands by
the body going opposite to the camera. Normaliza-
tion was used to handle such inconsistencies. As ex-
plained at the end of Section 3, normalizing points for
this approach did improve results for the secondary
classes.
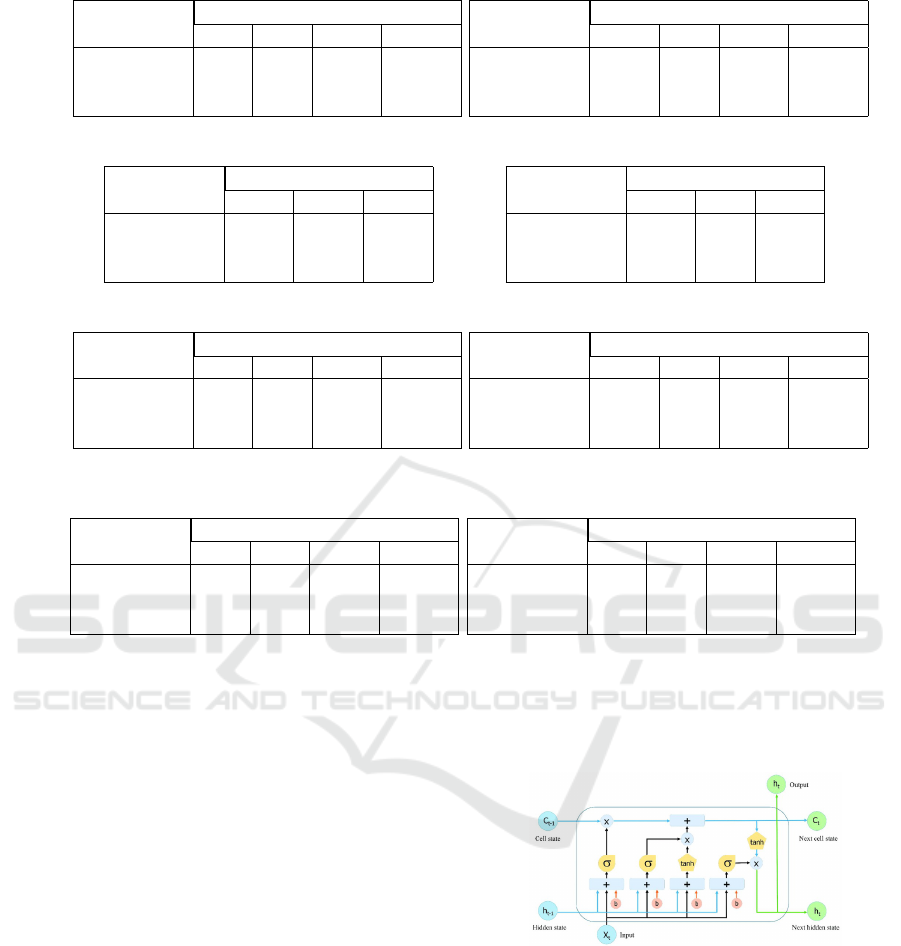
Figure 7: A simple LSTM cell architecture (Le et al., 2019).
5 ARCHITECTURE
The methodology presented in this paper uses 3D key
points of the human skeleton shown in Figure 3 to rec-
ognize pedestrian activity in real-time. This method is
based on the framework described in the paper (Chen
et al., 2016) using HAR dataset of smartphone (Asun-
cion and Newman, 2007). The authors have used mo-
bile sensor data, such as tri-axial accelerometer data.
Different states of human motion like walking, jog-
VEHITS 2022 - 8th International Conference on Vehicle Technology and Intelligent Transport Systems
372

Figure 8: Accuracy and Loss plot for an LSTM model - lower body activity classification.
ging, standing, etc. were classified. In our work,
the input data is a sequence of 3D skeleton points
recorded from the vehicle rather than a mobile from
an individual. The activities do not only include mo-
tion but also their direction as well. Hence, this allows
us to exploit more activities in the vicinity of the ve-
hicle.
Looking at the workflow as shown in Figure 5,
the 3D skeleton points are directly generated from the
stereo camera. This skeleton data is converted into
a 3D array in pre-processing stage based on the type
of approach: full or divided. The model uses LSTM
which are looped networks that allow information to
be kept up to date. The decision at time step t-1 influ-
ences the decision it makes one moment later at time
step t. It contains four gates shown in Figure 7: (i)
forget gate to discard information from cell state, (ii)
input gate to store additional data, (iii) Input modula-
tion gate has a new set of candidate values, scaled by
how much each state value was updated, and (iv) out-
put gate to determine what we want to generate. As
the walking sequence of the pedestrian is time-series,
the prediction at t requires information at each time
frame i.e., previous frames from t
0
to t
t−1
data. For
instance, an activity like ”Parallel Crossing” needs a
data sequence of 23 where each frame state is neces-
sary to determine the direction ”Away” or ”Towards”
the vehicle. It also overcomes the vanishing gradient
problem.
The pre-processed data is then sent to the LSTM
model(s) for classification. For the full approach, the
left model was used only. Both the models consist of
additional LSTM cells along with dense, and dropout
layers, which produces softmax probabilities. Ad-
ditional optimizers, such as SGD, Adam, RMSprop,
and Adagrad were implemented to explore more pos-
sibilities to achieve higher accuracy. The step size,
often known as the ”learning rate,” is the amount by
which the weights are adjusted during training. Also,
it takes a great amount of time to get a good learn-
ing rate. Less than 1.0 and larger than 10
−6
are the
ranges to consider for the learning rate to obtain bet-
ter performance. The highest softmax probability ac-
tivity is chosen which is given as output. During the
training phase, the model is trained with augmented
data. This model with the best performance is then
converted to a frozen model (protobuf file) to be in-
tegrated into Finroc (framework used in RRLab)
1
.
The frozen model file contains saved network archi-
tecture and weights and gets rid of unnecessary meta-
data. Then we run the file using finroc to predict the
activities in real-time testing. A few of the scenarios
are provided in section 6.
6 EXPERIMENTATION AND
RESULTS
The collection of training and testing data was done
with a ZED from stereolabs
2
mounted on the bus.
The data was divided into a random picked in a fixed
split of training, testing, and validation datasets. vary-
ing size key points with 23 sequences were collected.
6.1 Full Approach
In this approach, the skeleton as a whole was given
into the model shown in Figure 5. Only model 1
was used to classify the activities. A sequence of
23 frames with 18 3D points (54 features) was fed
to the network. The model is trained on epochs 50,
100, 150 but the performance was observed to be bet-
ter at 100. SGD, Adam, and RMSprop optimizers
were used with different learning rates. The model
was trained with augmented data along also. Table 6a
and Table 6b shows the result without and with data
augmentation, respectively.
For data without augmentation, the model per-
forms well with Adam optimizer with a learning rate
of 0.0001. In the case of data augmentation, the data
does not demonstrate a significant difference in per-
1
https://www.finroc.org/
2
https://www.stereolabs.com/zed/
Pedestrian Activity Recognition from 3D Skeleton Data using Long Short Term Memory Units
373
formance. The reason could be due to a large number
of missing points when a few skeleton joints are not
visible or detected. Normalization did not have any
effect on the model in this case, and, hence, the re-
sults were not included in the paper.
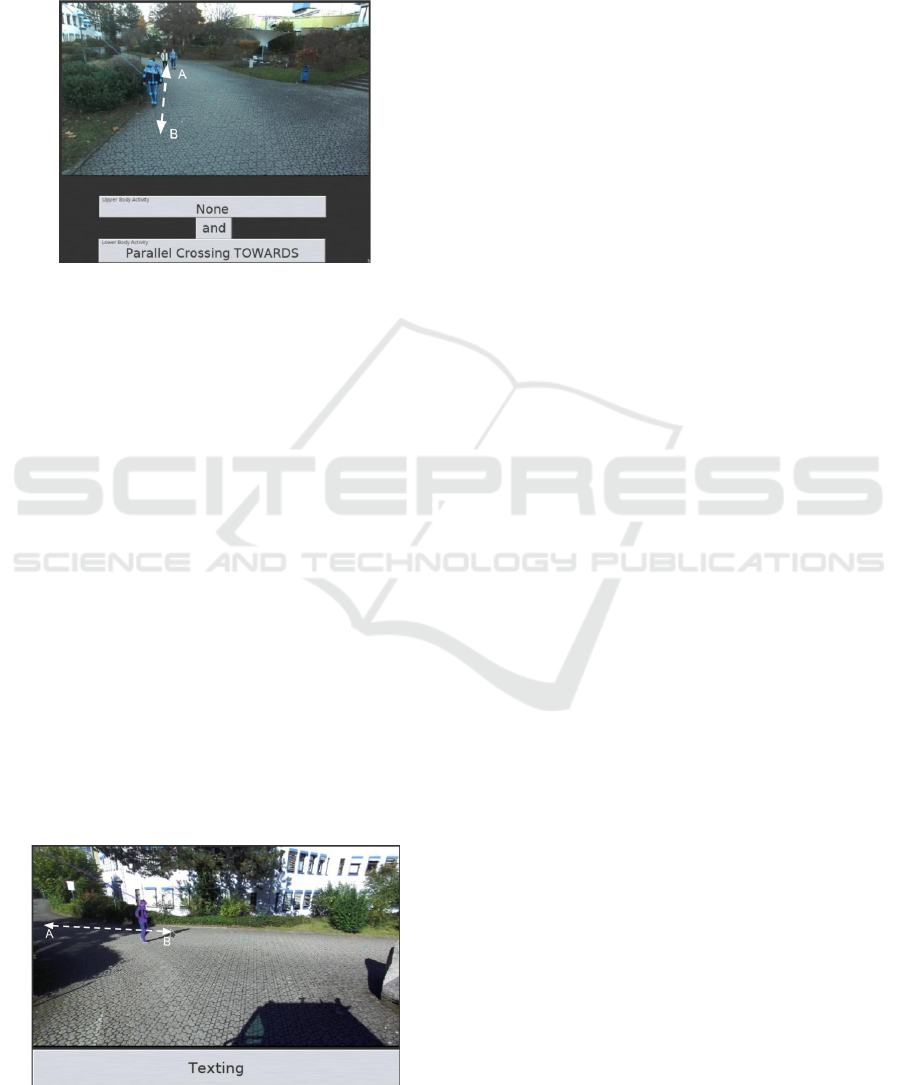
Figure 9: Correct classification of a random test in campus
environment.
6.2 Divided Approach
Same experiments were repeated in this approach,
but two LSTMS models were used for the upper and
lower body separately. Table 6 shows all the cases for
the experiments.
It is hard to differentiate between some of the
points in upper body activities since they are clustered
closely together. Normalizing such points makes it
simplified. The accuracy of secondary activity clas-
sification has significantly improved from 46 to 82
% after normalization. It increased further with aug-
mented data. It can be seen that data with normaliza-
tion has outperformed the others for the upper-body.
The best results are obtained from the RMSprop opti-
mizer with a learning rate of 0.1.
For lower body activity, the test accuracy for data
with and without augmentation achieved more than
90%. The model was trained on 30 epochs. The net-
work has improved significantly after augmentation.
After augmentation, RMSprop performed well than
Figure 10: Mis-classification of a random test in campus
environment.
Adagrad. One of the factors contributing to the true
positives is the distinct behavior or data of all the pri-
mary activities. The 3D points, in this case, can be
well distinguished, and normalizing the points is not
needed. To see the performance of the model, train-
ing and validation accuracy and loss graphs were plot-
ted. Figure 8 shows the single instance for lower body
classification experiments. This model is trained with
30 epochs using an adagrad optimizer. It can be seen
that the model was a good fit and works fine for un-
seen data.
6.3 Real-time Unseen Data
During the testing in an unseen environment, the ve-
hicle was driven on the campus by the pedestrians.
These pedestrians were unaware of the system in the
vehicle other than the vehicle itself. Random ac-
tivities were seen from the images and compared to
classes predicted by the network. One example can
be seen in Figure 9. It can be seen that the person
is walking towards the bus from A to B. His hands
are in a walking position, so the upper body class is
”none” and the lower body class is ”parallel crossing
towards”.
In some cases, such as shown in Figure 10, the
secondary classes predicted were false positives. For
example, holding a cup or bag has the same arm
and head position as in texting or talking on a phone
(speaker mode). The label is dependent on the type
of object in real-world scenarios. We know that only
holding a smartphone can be classified as texting or
calling and other objects like bags or cups are con-
sidered as none. However, the model is only trained
on joint data and does not information about the ob-
ject. Also, the head orientation is very less and the
arm data in all of these activities has the same el-
bow position. So, it predicts a similar label for the
same behavior. Figure 10 shows one such scenario
where the person is walking perpendicular from point
A to B. Although, he is not texting, the predicted class
was texting. Another factor for misclassification was,
few of the secondary activities were often predicted as
”standing”. This is due to a slight delay in the frames
or the movement of the pedestrian. These data points
don’t show distinct movement as the person is moving
very slowly or is distracted.
7 CONCLUSION
This paper implements pedestrian activity recognition
using 3D skeleton data obtained from a stereo camera
mounted on the roof of the bus. A customized dataset
VEHITS 2022 - 8th International Conference on Vehicle Technology and Intelligent Transport Systems
374

is created to train the LSTM model and includes ac-
tivities observed near a vehicle in pedestrian zones. A
full and divided approach for input skeleton data was
used, where the latter perform better. Furthermore,
the lower body classification is more accurate. How-
ever, it is noticeable that the model’s performance can
be significantly affected due to missing skeleton joints
or inaccurate joint data estimations, especially for the
upper body. A person carrying a cup or bag was rec-
ognized as texting as the model is unable to detect
objects. This could be solved by adding RGB data.
Understanding activities from pedestrians enables
an AV to make intelligent decisions based on the ac-
tivity identified. An AV does not need to stop for
a pedestrian parallel crossing towards the bus and is
aware. But it might be helpful for a person to warn by
voice command for a person using a phone to avoid
unnecessary stops; hence, reducing travel time for in-
side passengers. The model can be enhanced further
with more activities, for example, waiting, jogging,
including cyclists. Overall, the model shows better
results with the divided approach.
REFERENCES
Andriluka, M., Pishchulin, L., Gehler, P., and Schiele, B.
(2014). 2d human pose estimation: New bench-
mark and state of the art analysis. In Proceedings of
the IEEE Conference on computer Vision and Pattern
Recognition, pages 3686–3693.
Asuncion, A. and Newman, D. (2007). Uci machine learn-
ing repository.
Cao, Z., Hidalgo, G., Simon, T., Wei, S.-E., and Sheikh, Y.
(2019). Openpose: realtime multi-person 2d pose esti-
mation using part affinity fields. IEEE transactions on
pattern analysis and machine intelligence, 43(1):172–
186.
Chen, Y., Zhong, K., Zhang, J., Sun, Q., Zhao, X., et al.
(2016). Lstm networks for mobile human activity
recognition. In Proceedings of the 2016 International
Conference on Artificial Intelligence: Technologies
and Applications, Bangkok, Thailand, pages 24–25.
Duan, H., Zhao, Y., Chen, K., Shao, D., Lin, D., and Dai, B.
(2021). Revisiting skeleton-based action recognition.
arXiv preprint arXiv:2104.13586.
Geiger, A., Lenz, P., and Urtasun, R. (2012). Are we ready
for autonomous driving? the kitti vision benchmark
suite. In 2012 IEEE conference on computer vision
and pattern recognition, pages 3354–3361. IEEE.
Hariyono, J. and Jo, K.-H. (2015). Pedestrian action recog-
nition using motion type classification. In 2015 IEEE
2nd International Conference on Cybernetics (CYB-
CONF), pages 129–132. IEEE.
Hwang, S., Park, J., Kim, N., Choi, Y., and So Kweon, I.
(2015). Multispectral pedestrian detection: Bench-
mark dataset and baseline. In Proceedings of the IEEE
conference on computer vision and pattern recogni-
tion, pages 1037–1045.
Jan, Q. H. and Berns, K. (2021). Safety-configuration of
autonomous bus in pedestrian zone. In VEHITS, pages
698–705.
Jan, Q. H., Klein, S., and Berns, K. (2019). Safe and effi-
cient navigation of an autonomous shuttle in a pedes-
trian zone. In International Conference on Robotics in
Alpe-Adria Danube Region, pages 267–274. Springer.
Le, X.-H., Ho, H. V., Lee, G., and Jung, S. (2019). Applica-
tion of long short-term memory (lstm) neural network
for flood forecasting. Water, 11(7):1387.
Lin, T.-Y., Maire, M., Belongie, S., Hays, J., Perona, P.,
Ramanan, D., Doll
´
ar, P., and Zitnick, C. L. (2014).
Microsoft coco: Common objects in context. In Euro-
pean conference on computer vision, pages 740–755.
Springer.
Liu, J., Shahroudy, A., Perez, M., Wang, G., Duan, L.-Y.,
and Kot, A. C. (2019). Ntu rgb+ d 120: A large-
scale benchmark for 3d human activity understanding.
IEEE transactions on pattern analysis and machine
intelligence, 42(10):2684–2701.
Ojo, T., Adetona, C. O., Agyemang, W., and Afukaar, F. K.
(2019). Pedestrian risky behavior and safety at zebra
crossings in a ghanaian metropolitan area. Traffic in-
jury prevention, 20(2):216–219.
Pandey, P. and Aghav, J. V. (2020). Pedestrian activity
recognition using 2-d pose estimation for autonomous
vehicles. In ICT Analysis and Applications, pages
499–506. Springer.
Pop, D. O., Rogozan, A., Nashashibi, F., and Bensrhair,
A. (2017). Pedestrian recognition through differ-
ent cross-modality deep learning methods. In 2017
IEEE International Conference on Vehicular Elec-
tronics and Safety (ICVES), pages 133–138. IEEE.
Rasouli, A., Kotseruba, I., and Tsotsos, J. K. (2017). Are
they going to cross? a benchmark dataset and baseline
for pedestrian crosswalk behavior. In Proceedings of
the IEEE International Conference on Computer Vi-
sion Workshops, pages 206–213.
Sanchez-Caballero, A., de L
´
opez-Diz, S., Fuentes-Jimenez,
D., Losada-Guti
´
errez, C., Marr
´
on-Romera, M.,
Casillas-Perez, D., and Sarker, M. I. (2020). 3dfcnn:
Real-time action recognition using 3d deep neural net-
works with raw depth information. arXiv preprint
arXiv:2006.07743.
Shahroudy, A., Liu, J., Ng, T.-T., and Wang, G. (2016). Ntu
rgb+ d: A large scale dataset for 3d human activity
analysis. In Proceedings of the IEEE conference on
computer vision and pattern recognition, pages 1010–
1019.
Pedestrian Activity Recognition from 3D Skeleton Data using Long Short Term Memory Units
375
