
Establishing Surface Displacements along a Railway Route near
Mirovo Salt Deposit, NE Bulgaria
Mila Atanasova-Zlatareva
1a
and Hristo Nikolov
2b
1
Department of Geodesy, National Institute of Geophysics Geodesy and Geography,
Bulgarian Academy of Sciences, Sofia, Bulgaria
2
Remote Sensing Systems Department, Space Research and Technology Institute,
Bulgarian Academy of Sciences, Sofia, Bulgaria
Keywords: Ground Movements, SAR Data, GNSS Networks, Railway Line Deformations.
Abstract: Studying Earths’ surface motions using data acquired by active instruments such as satellite Synthetic
Aperture Radar (SAR) have become ubiquitous in the last years. This trend could be attributed to large
extent to the open data policy of ESA that provides such type data from Sentinel-1 mission at no cost from
several online repositories. On the other hand the results produced after processing them need to be
validated by data from other sources. In this paper a framework for SAR data processing is presented,
whose results are compared and analysed with results from GNSS networks. In order to increase the
reliability of the information provided by the radar data used in this research ascending and descending
orbits of the satellite were used in order to decrease the effect of the topography. Part of railway line which
passes through the town of Provadia and industrial area near it was selected as test site. This object was
chosen since surface deformations often occur in it caused by natural and anthropogenic activities in that
area.
a
https://orcid.org/0000-0002-3105-3266
b
https://orcid.org/0000-0001-5764-1499
1 INTRODUCTION
The main object of research is the railway line
passing through Provadia town and close to the salt
deposit, which is part of the route Sofia-Varna. It is
known that the subsidence registered in the railway
infrastructure located near the mine workings is
caused by deformations related to the lowering of
the upper layer of the mine workings. These
deformations lead to changes at the surface and are
the main reason for continuously maintenance works
along the railway line. As pointed out in (Dimitrova
et al., 2020) the seismic activities having different
origin as well as other geodynamical processes are
considered to be the main source for the registered
by different means horizontal and vertical surface
movements (Angelov А. 2017).
The prime focus of the current research is to
present a pilot study and a framework for constant
monitoring of recent motions of the Earths’ crust
combining data from satellite synthetic aperture
radar (SAR) and from local and continuously
operating reference stations GNSS networks. In the
framework, the data from SAR will provide the main
amount of information concerning the ground
motions while the GNSS data were used to provide
more precise information to validate it. The final
results are of importance to provide reliable
information for the surface changes close to the
railway line since this is one of the major routes in
Bulgaria for transportation of goods and
people.(Galve et al., 2015; Fengming Hu et al.,
2019)
The proposed framework for information
provision is based on well established and tested
method for processing SAR data, namely the
DInSAR technique, taking into account peculiarities
of the region and the specific object. One main
advantage of the adopted approach is that it could
provide information at much shorter intervals
(seasonal or monthly) compared to conventional
geodetic surveys usually made twice a year.
Atanasova-Zlatareva, M. and Nikolov, H.
Establishing Surface Displacements along a Railway Route near Mirovo Salt Deposit, NE Bulgaria.
DOI: 10.5220/0011075400003185
In Proceedings of the 8th International Conference on Geographical Information Systems Theory, Applications and Management (GISTAM 2022), pages 155-162
ISBN: 978-989-758-571-5; ISSN: 2184-500X
Copyright
c
2022 by SCITEPRESS – Science and Technology Publications, Lda. All rights reserved
155

2 RESEARCHED REGION
The area of Provadia town is characterized by a
complex geological and tectonic environment (see
Figure 1), where a large number of fault structures
have been registered according to geophysical and
geological data. They are revealed north and south
of the town of Provadia the Provadia fault being the
most clearly delineated structure in the area of the
so-called salt body. The orientation of the fault is
from north-northwest to east-southeast. In the past
the eastern slope of the Provadia fault located south
of Provadia is lowered by 100 meters compared to
the western one. The rise of the salt body through
the Late Holocene took place along the fault. The
length of the Provadia fault is 19.88 km. The
analysis of the main fault structures in the Provadia
region that have been active during the neotectonic
stage shows that the decisive role in its youngest
development is played by the Provadia fault most
pro-nounced in the area of the Mirovo salt deposit,
where the salt body was raised during the Late
Holocene. (Dimitrov et al., 2016)
The above discussed fault lays the basis of
modern deformation processes on the slopes of the
Provadia River. A number of new north-south faults
have been observed in the upper part of the eastern
slope of the Provadia River (Zagorchev I. 2001);
Dimitrova et al., 2020). Landslides occur in
delineated sectors of the same eastern slope of the
river. They show that the development of faults
(regional and local) in the region of Provadia hasn’t
finished yet. Near the underground Mirovo salt
deposit is the route of the railway line Sofia-Varna,
which crosses this region.
The main factor for the concentration of
earthquakes in the area of the Mirovo salt deposit
and the increase in the number of weak earthquakes
in the last 50 years is due to the intensive
exploitation of salt by leaching (injection of high
pressure water into the earth layers) which forms
huge under-ground chambers. This method of
extraction accelerates the ground deformation
processes around the salt body since as a result it
becomes lighter at its top part and leads to tensions
that are released through weak earthquakes. (Knoll,
1996)
In the framework of ground deformations
monitoring by geodetic methods in the area of the
Mirovo salt deposit high-precision methods and
modern GPS technology have been applied, which
provide quantitative data for displacements within
millimeters (mm) range. The GNSS data registered
by the a CORS station in the town of Provadia and
those in its vicinity within a radius of 50 km, namely
the stations in Varna, Shumen, Shkorpilovtsi, Aytos
and Dobrich are considered in regard with and for
comparison to the stable speed of the time series
from Eurasia'2005 from ETRS89 coordinates. The
geodetic monitoring showed almost identical values
for the movements of the mentioned GNSS stations
the Provadia station being the only exception
providing a velocity of 1.9 ± 0.5 mm/yr in direction
southwest and a significant subsidence with a
velocity of 7.9 ± 1.6 mm/yr. Based on these
observations, it can be concluded that most probably
the observed seismicity in the area of Provadia is an
induced seismicity as a result of intensive
exploitation of salt production in the nearby (3-4 km
away) Mirovo salt deposit. (Kostyanev et al. 2010;
Dimitrova et al., 2010)
A local geodetic network was built in 1988 for
monitoring the ground deformations in the area of
the Mirovo salt deposit. This a network for
horizontal determinations and currently consists of
26 points, which include 6 existing points from the
State Geodetic Network of the Republic of Bulgaria
and 20 new points that have been purposely built.
The new levelling network includes one century-old
benchmark from the first-class levelling network of
Bulgaria, one benchmark from the second-class
levelling network, several landmarks from the state
network, 3 newly built century-old landmarks, 37
leveling marks with special construction attached to
the drilling columns, 13 depth benchmarks with
fundaments 5 m below the surface, 123 surface
benchmarks at a depth of 2 m and 26 benchmarks
stabilized to the foundations of the points of the
horizontal network. The first cycle of geodetic
measurements was carried out in May 1990. The
changes in the coordinates of the points of the
geodynamic network show displacement velocities
that reach up to 35 mm/yr, with a mean square
deviation of ± 1 mm/yr. For measuring points 4, 11,
14, 16, 17, 18 are those for which maximum speeds
of 12.6-18.5 [mm/year] and maximum significant
subsidence for point 13 with a velocity of the order
of 24.3 mm/year (Atanasova-Zlatareva 2015).
GISTAM 2022 - 8th International Conference on Geographical Information Systems Theory, Applications and Management
156
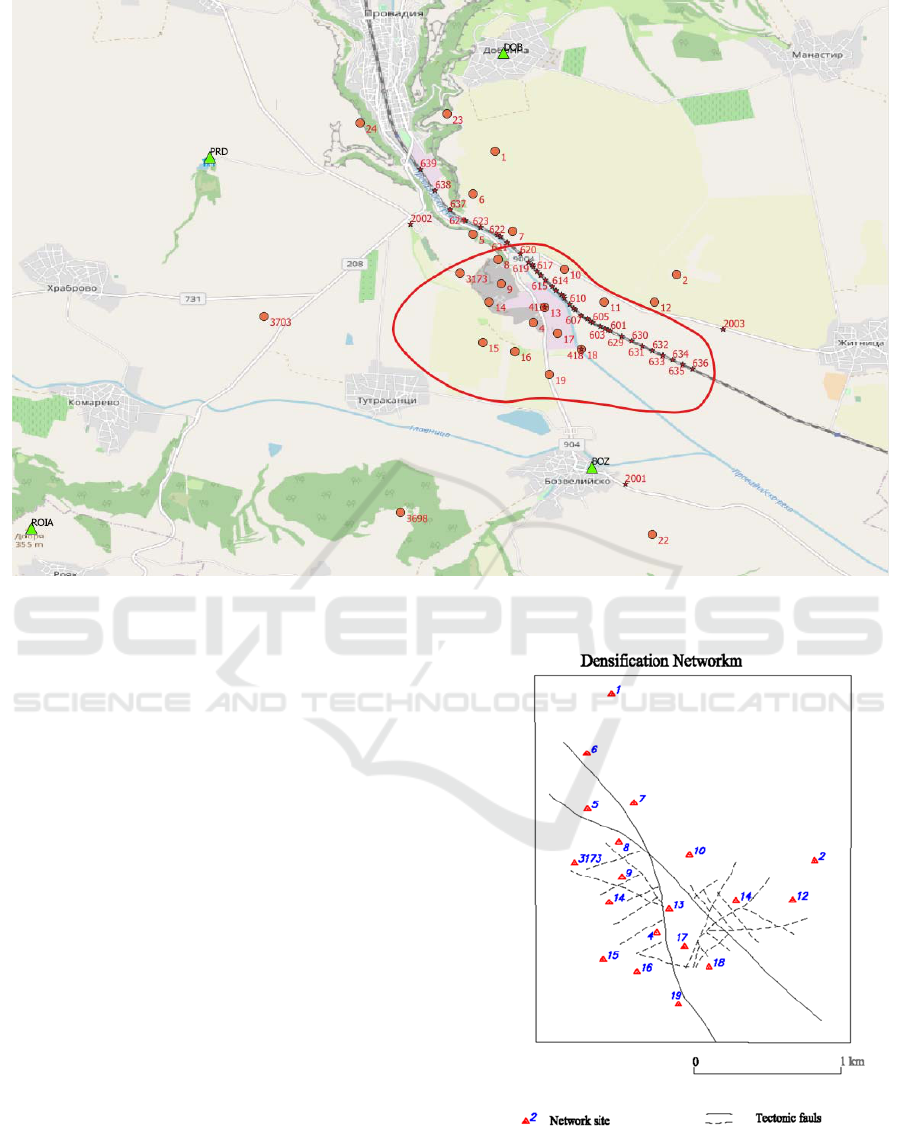
Figure 1: Local seismological network (green triangles), local geodetic network (red dots) and local geodetic network for
railway monitoring (red stars) in the area of the Mirovo salt deposit (red contour).
In (Valev et. al., 2015) it was underlined that “It
cannot be denied that the deformations (in the area
of the salt deposit) are mostly caused by technogenic
activities, but they would hardly have manifested
themselves to such an extent if there had not been
lateral tectonic pressure. This statement is justified
by the tangible values of deformations outside the
deposit.” In the same paper one more conclusion
was drawn that “… whether some of the boreholes
are exploited or not the velocities of vertical and
horizontal movements remain almost constant.
There is no relationship between the cessation of
drilling and the dynamics of relocations and after
several years of suspension of production in some of
the chambers”. In (Kostyanev et al., 2010) for
ongoing geodynamic processes in the same region it
was stated that “…it is necessary to determine what
part of the total value of deformation is the one of
technogenetic character and what is the part, which
is of tectonic origin”.
Figure 2: The geodynamic network for the area of the
Mirovo salt deposit - general scheme (Valev et. al., 2015).
Since for this particular case the main object of
research is the railway line passing through Provadia
Establishing Surface Displacements along a Railway Route near Mirovo Salt Deposit, NE Bulgaria
157
town and close to the salt deposit, which is part of
the route Sofia-Varna we will briefly comment on
the geodetic measurements performed on it in order
to guarantee its reliable functioning. In the last few
years (after 2010) an additional geodetic network of
36 points has been purposely built to monitor the
surface deformations along the railway line. On this
network levelling and GNSS measurements have
been performed at regular basis. Its points are
measured with greater frequency due to the higher
importance of this infrastructure site since it
concerns the public safety. The traffic on the railway
line is considered as dangerous dynamic load, which
can cause depressurization of the boreholes near it,
as well as there are problems with the safety of
trains. From the geodetic measurements made it was
concluded that the vertical and horizontal
displacements in the area of the railway line have
significant values. On October 7, 2010 an
earthquake event with magnitude 4.5 on the Richter
scale 4 , caused (or was caused by) fault movements,
probably led to a general relocation of the
benchmarks along the railway line and accelerated
the ground movements in direction towards the
central part of the salt deposit through which the
main fault passes. It is known that the subsidence
registered in the railway infrastructure located near
the mine workings is caused by tensile and
compressive deformations related to the lowering of
the upper layer of the mine workings. These
deformations lead to changes in tensions inside the
continuously repaired railway line.
3 DINSAR TECHNIQUE IN
MEASURING THE GROUND
MOTIONS IN PROVADIA
In the last decade, the interferometric approach has
been widely used in modern geodynamic research.
The method uses interferometrically processed data
from terrestrial or satellite radars with a synthetic
aperture. The purpose of the processing is to obtain
the change of the phase signal present in two radar
images obtained on different dates. Based on this
difference, information can be obtained about the
horizontal and vertical movements of the Earth's
crust and thus the dynamical behaviour of various
geophysical phenomena - earthquakes, landslides,
sink holes, etc.
To use the interferometric technique for SAR
data processing two radar images (often called the
interferometric pair - IFP) must be processed
together and the resulting height difference is
inferred from the difference of the phase component
of the backscattered signal of the two measurements.
This difference is directly related to the changes (if
any) that have occurred on the Earth's surface during
the time interval between the two acquisitions. It
should also be borne in mind that the movements
recorded in this way are in the line of sight (LOS) of
the antenna and cannot be interpreted directly as
movement in a horizontal or vertical plane.
The DInSAR (Differential Synthetic Aperture
Radar) approach used to obtain the results presented
below is based on data obtained from the Sentinel
1A/B mission for the period 2015-2021 (see Figure
3). Based on their expertise the authors used data
from online available SAR data archives maintained
by various institutions selecting the IFPs best suited
for further processing based on values perpendicular
baselines between all possible data sets for the
considered time intervals. Additional information
from digital maps and other data concerning the
topography of the study area was used to minimize
the negative effects (shadows, layover,
foreshortening) caused by the hilly landscape found
in the researched region during the DInSAR
processing.
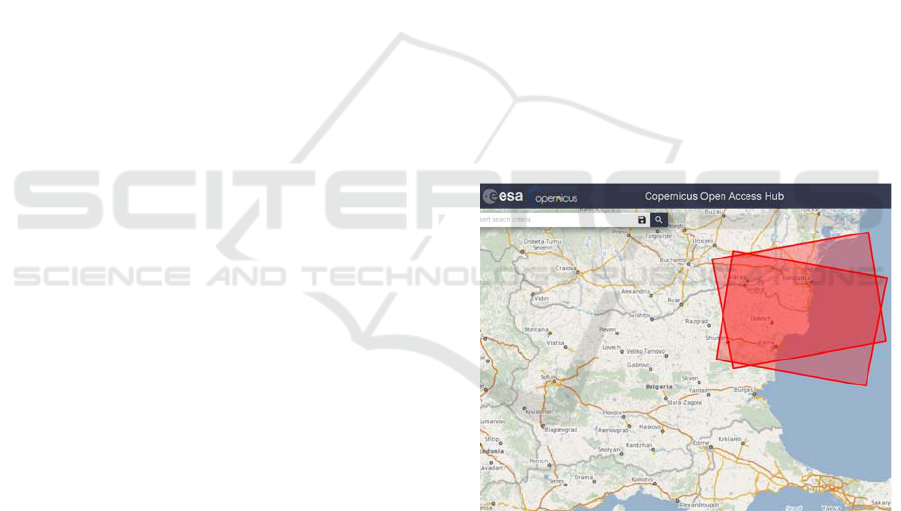
Figure 3: Area of study covered by the used SAR images
of ESA’s mission Sentinel-1 ascending and descending
orbits tracks 36 and 58.
Another consideration that was taken into
account to mitigate the mentioned effects was to
process data from ascending and descending orbits
and to register the results from both together. To
create single interferometric image (IFI) data from
previously formed IFP is processed with DInSAR
method using the freely provided by ESA software
SNAP.
GISTAM 2022 - 8th International Conference on Geographical Information Systems Theory, Applications and Management
158

For the study presented here a set of IFIs for the
late autumn/early spring periods for the years 2015
to 2021 was produced. This period was selected to
decrease the temporal decorrelation due to
vegetation present in the studied area, which is
predominantly agricultural land, leading to loss of
coherence. Other parameter we experimented with
were the DEMs used in DInSAR processing as
provided by the software (Nikolov et. al. 2017) in
order to increase the spatial resolution of the final
results. To improve the co-registration of the initial
single look complex SAR data from the primary and
secondary SAR data sets only precise information
for the satellite orbits at the time of their acquisition
were used.
4 RESULTS AND DISCUSSION
In order to facilitate the processing first a local
archive was created with more than 300 SAR data
sets from both types orbits of the Sentinel-1 mission
aquired in IW mode and stored in SLC format for
the area including the town of Provadia. (see figure
3) From this repository selected were only those that
met the criteria for short perpendicular baseline
between data in a single IFP – less than 20m. This
was an essential requirement since the smaller the
baseline is the better results concerning the
deformations are obtained (Vassileva, 2017). After
creating an interferogram from each IFP extracted
was smaller area that covers only the studied region
(see figures 1 and 3). This was done because this
way the next processing steps are performed in less
time and the results after unwrapping procedure are
more reliable. The latter is of particular importance
since at that step the interferometric phase is
transformed from (-π; π) to metric units thus
delivering values for the surface motions detected by
DInSAR. It was established in (Larsen, 2020, p106)
that the decomposition of the derived after DInSAR
phase signal in LOS into E-W, N-S and vertical
components is not trivial task being an ill posed
problem to derive three unknowns from a single
equation. To this end we used a simplified version of
the said equation making the assumption that the
dominant movement is subsidence and a formula as
(1) will provide reasonable results.
𝑑𝑖𝑠𝑝𝑙
𝑢𝑛𝑤 𝑝ℎ𝑎𝑠𝑒 ∗ 0.056
4∗𝜋∗𝑟𝑎𝑑𝑐𝑜𝑠
𝑖𝑛𝑐 𝑎𝑛𝑔𝑙𝑒
𝑚
(1)
Despite this simplification the interpretation of
the results should be made supported by as much
additional information as possible. For the studied
object it was not possible to acquire more data from
in-situ measurements and for this reason the authors
decided to use only the LOS information to assess
the displacements of the points and not to obtain
their exact velocities.
Further removed were the pixels (ground
elements) having low coherence which were
considered as influenced by temporal decorrelation
(see figure 4). The last step performed in SNAP was
the geocoding of the final results in geographic
coordinate system WGS84 which is needed to use
the results as images in external software products
for analysis and visualization.
Using the above mentioned steps a set of IFIs was
created at intervals of 4-5 months in order to establish
the deformations along the studied route of the
railway line as in (Atanasova,Nikolov 2016). The
validation of the information received from the
produced IFIs was performed using the data from the
local and CORS GNSS networks (figures 1 and 2).
The third and final phase of the study involves
the analysis of the information obtained after
DInSAR processing and is based on the obtained
deformation maps in metric units for the respective
period. Firstly, it should be emphasized that the
registered surface displacements are in the LOS of
the antenna and give information whether the points
are moving towards or moving away from it, and
secondly, they are relative to a point with precisely
measured deformation. Another practical
consideration
in interpreting LOS movements is that the actual
three-dimensional motion of the Earth (North, East,
Up) is an estimate and should interpreted with care.
For the pixels laying along the railway line from
six presented images that contain displacements in
LOS we calculated some statistics that allowed
conclusions to be drawn. First it was made clear
based on information from the coherence band of
each image that not for all said pixels the
information produced from SAR data could be
considered reliable since only the pixels in the
displacement band that have coherence above 0.3
could be trusted. In this case the largely varying
Establishing Surface Displacements along a Railway Route near Mirovo Salt Deposit, NE Bulgaria
159
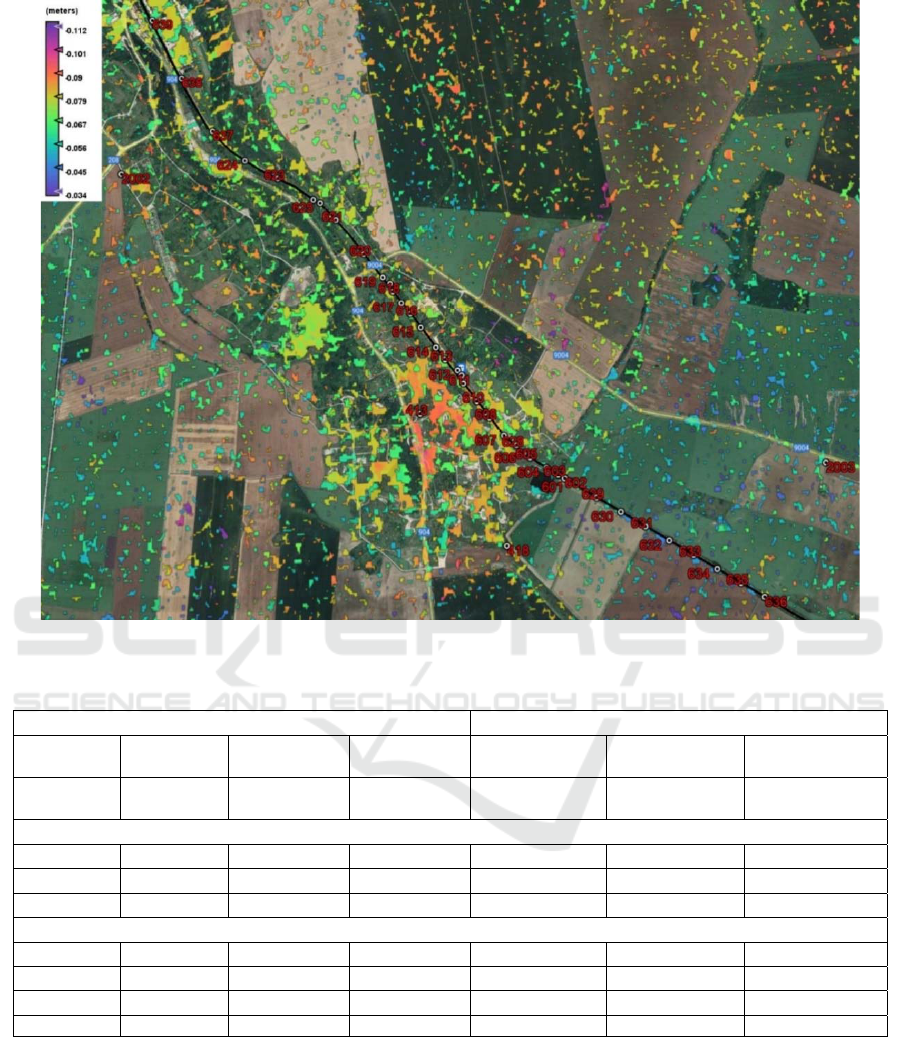
Figure 4: Subset of displacement map for the period Oct 2018-10 March 2019 and geodetic points from railway route.
Table 1: Statistics for the pixels along the railway line (see figures 4 and 5) for the three studied periods.
Track 58 ascendin
g
Track 36 descendin
g
Nov2018
A
p
r2019
Nov2019
A
p
r2020
Nov2020
A
p
r2021
Oct2018
March2019
Nov2019
March2020
Nov2020
March2021
Valid
p
ixels 953 1338 1283 1266 2299 732
Statistics for the displacements in LOS [m]
min value -0.088 -0.055 -0.088 0.010 -0.047 0.023
max value -0.048 0.003 -0.020 0.067 0.019 0.122
range 0.041 0.058 0.067 0.057 0.066 0.099
Pixels that have data in all six ima
g
es
–
203
min value -0.088 -0.036 -0.086 0.017 -0.026 0.072
max value -0.075 -0.005 -0.053 0.031 -0.018 0.120
ran
g
e 0.013 0.031 0.033 0.014 0.008 0.048
Stddev 0.003 0.006 0.007 0.003 0.001 0.014
GISTAM 2022 - 8th International Conference on Geographical Information Systems Theory, Applications and Management
160
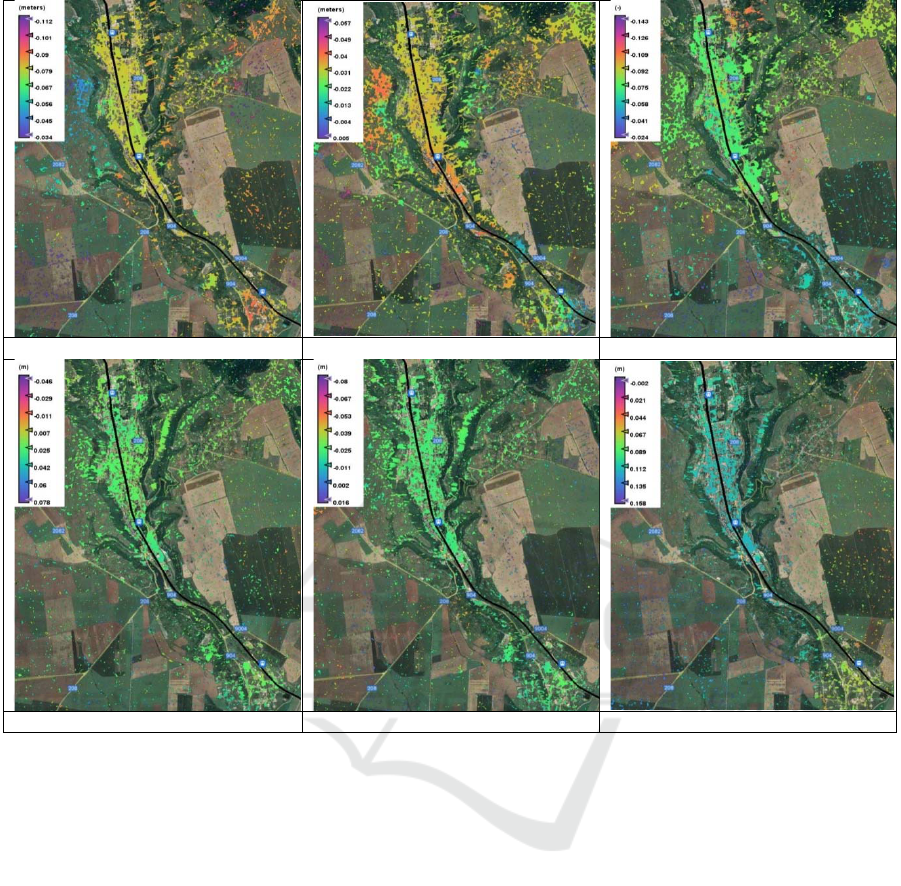
Oct 2018-10 March 2019 05 Nov 2019-28 March 2020 11 Nov 2020-23 March 2021
Nov2018
_
A
p
r2019 Nov2019
_
A
p
r2020 Nov2020
_
A
p
r2021
Figure 5: Subset of displacement maps created from SAR data satellite orbits 36 and 58 (black line is the monitored railway
line).
number of valid pixels could be attributed to the
length of acquisition periods and to the weather
conditions at the date of the acquisition. It could be
stated that based on the signs for every valid pixel
the overall movement could be produced – if the
signs from both geometries are the same the
dominant movement is vertical otherwise the
movement is in east-west direction (Vassileva,
2017). From the table provided it is made clear that
the seasonal movements, regardless of its type, don’t
exceed 0.1 m. In order to make proper comparison
between the results produced from ascending and
descending orbits of the satellite only the pixels that
had valid values for all six periods were considered.
It is seen in the same table that since values the
range and the standard deviation of the detected
movements for this pixels only is small which leads
to the conclusion that the movement is reliably
registered.
5 CONCLUSIONS
From the all above presented the main conclusion is
that the presented framework delivers reliable
information with regard to the ground movements in
the area of the Provadia town to all interested
stakeholders. Also it needs to be underlined the
possibility of regular monitoring of the region with
less financial and human investment.
ACKNOWLEDGEMENTS
This study was supported by the Contract No D01-
404/18.12.2020 (project “National Geoinformation
Center (NGIC)” financed by the National Roadmap
for Scientific Infrastructure 2020-2027. The authors
would like to express their gratitude to European
Establishing Surface Displacements along a Railway Route near Mirovo Salt Deposit, NE Bulgaria
161

Space Agency for providing Sentinel-1 SAR data
and geospatial processing software SNAP at no cost.
REFERENCES
Angelov А. (2017) Dynamic methods for determining
deformations in enginering facilities in real time,
Yearbook of UACEG - electronic edition, volume 50,
issue. 2, 2017
Atanasova-Zlatareva M. (2015) Study of Deformation and
Movements on the Earth's Crust, of Technogenic
Character, Based on Repeated Geodetic
Measurements. Technical Programme and Proceedings
/FIG WORKING WEEK 2015 IN SOFIA,
BULGARIA, 2015, ISBN:978-87-92853-35-6,
ISSN:2307-4086, 1-12
Atanasova M., Nikolov H., (2016) Detection of the
Earth's crust deformation in Provadia area using
InSAR technique. Proceedings of XXVI International
symposium on “Modern technologies, education and
professional practice in geodesy and related fields”,
2016, pp. 1-12
Larsen Y. et al., European Ground Motion Service:
Service Implementation Plan and Product
Specification Document, v1.01, EEA, 2020
Copernicus. Sentinel-1 data 2017 to 2021. Retrieved from
ASF DAAC [8 Nov 2019], Processed by ESA.
Available online: https://asf.alaska.edu/ (accessed on
May 2021).
Dimitrov, D., G. Jelev, E. Botev. (2016) Analysis of the
Deformation Processes in the Region of the Mirovo
Salt Deposit. Journal of the BAS, vol. 4, Ed. "Prof. M.
Drinov", pp 14-18, 2016
Dimitrova L., S. Nikolova, G. Georgieva, R.Raykova, I.
Ivanova , I. Asparuhova, (2010) Processing and
analysis of seismicity in Provadiya region in 3 year
period, National geophysical conference, Dec., 2010,
https://bggs.eu/konferencia_2010/09.pdf
Dimitrova, L., Georgieva, G., Trifonova, P. et al. (2020)
Seismic sources and Earth structure in the transition
zone between Fore-Balkan unit and Moesian platform,
NE Bulgaria. Acta Geod Geophys 55, 183–202 (2020)
https://doi.org/10.1007/s40328-020-00288-3
Galve Jorge Pedro, Carmen Castañeda F. Gutiérrez
(2015)Railway deformation detected by DInSAR over
active sinkholes in the Ebro Valley evaporite karst,
Spain; June 2015Natural Hazards and Earth System
Sciences 3(6):3967-3981 DOI: 10.5194/nhessd-3-
3967-2015
Fengming Hu, Freek J. van Leijen,, Ling Chang, Jicang
Wu, Ramon F. Hanssen (2019) Monitoring
Deformation along Railway Systems Combining
Multi-Temporal InSAR and LiDAR Data; Remote
Sens. 2019, 11, 2298; doi:10.3390/rs11192298
Kostyanev S., Valev G., Majdrakov M., Jelev V., Avdev
S., Bliznakov A., Stoyanov V., Atanasova E., The use
of GNSS technologies for application in mining,
geology and geodesy in Bulgaria, Proceedings of the
XIX CBGA Congress, Thessaloniki, Greece, 2010
Knoll P., Kowalle G., Rother K., Schreiber B., Paskaleva
I. (1996) Analysis of Microtremors within the
Provadia Region near a Salt Leaching Mine. In: Knoll
P., Kowalle G. (eds) Induced Seismic Events. Pageoph
Topical Volumes. Birkhäuser Basel.
https://doi.org/10.1007/978-3-0348-9204-9_14
Nikolov H., Atanasova M.. (2017), Influence of different
DEMs on the quality of the InSAR results – case study
over Bankya and Mirovo areas. SPIE,
https://doi.org/10.1117/12.2278393
Valev G., Rainov G., Vassileva K. (2015) Geodetic
measurements and study of the Mirovo salt deposit,
7th BgGS National conference with international
participation "GEOPHYSICS 2015", May 2015
Vassileva M., Fabio Giulio Tonolo, Paolo Riccardi,
Daniele Lecci, Piero Boccardo & Giuliana Chiesa
(2017) Satellite SAR interferometric techniques in
support to emergency mapping, European Journal of
Remote Sensing, 50:1, 464-477
Veci L., (2016) TOPS Interferometry Tutorial,
http://sentinel1.s3.amazonaws.com/docs/S1TBX%20T
OPSAR%20Interferometry%20with%20Sentinel-
1%20 Tutorial.pdf,
Zagorchev I. (2001), Southwest Bulgaria, Geological
Guidebook, Bulg. Acad. Sci.
GISTAM 2022 - 8th International Conference on Geographical Information Systems Theory, Applications and Management
162
