
Poverty Population and Its Educational Accessibility: An Evaluation
using Geospatial Database in Ecuador
Gustavo Navas
a
, Anthony Loyaga
b
, Jefferson Barahona
c
and Julio Proa
˜
no Orellana
d
Universidad Polit
´
ecnica Salesiana, Mor
´
an Valverde S/N y Rumichaca, Quito, Ecuador
Keywords:
Geospatial, GIS, Voronoi, Educational Centers, Spacial Analysis, Poverty.
Abstract:
Education is the most critical aspect against inequality. So, the accessibility to educational centers is one of
the biggest problems that governments and academia are trying to solve in Latin America. Finding an optimal
location is challenging because different variables can be considered, such as serving the poor, accessing to
roads, and optimal distribution. This work presents a methodology that uses geospatial techniques to evaluate
the level of access of poor people to educational centers considering location and accessibility. This method-
ology is multi factorial and can be generalized to multiple scenarios in resource planning. In this work, a case
study of Ecuadorian educational centers is analyzed. So, an Ecuadorian geospatial database was created that
includes educational centers’ location, the distribution of the poor population, Voronoi diagrams, and road
networks. All the analysis were carried out using the PostGIS tool and Google Cloud Platform for the im-
plementation. The results show that 90% of educational centers serve at least 50% of the most impoverished
population.
1 INTRODUCTION
Education is the most critical aspect to mitigate in-
equality problems. However, according to UNICEF
(UNICEF, 2019), more than 60 million children will
not access primary education in 2030. On the other
hand, urban and regional areas have experienced con-
siderable growth (Navarrete and Luj
´
an-Mora, 2018).
It has led to the authorities’ different planning and
distribution of educational facilities to find the most
suitable location (Brock and Schaefer, 2015). Educa-
tional institutions in Ecuador are characterized by low
educational quality and the absence of minimum con-
ditions for girls, boys, and young people. On the other
hand, education in Ecuador has lacked an academic
level of quality in the poorest populations. In 2005,
the educational project of the Educational Units of the
Millennium began, which aims to reduce this gap and
reach children with limited economic resources. The
Millennium Educational Units (EMU) is a project for
the endowment of public educational institutes of pri-
mary and secondary levels. It was created to improve
a
https://orcid.org/0000-0002-2811-0282
b
https://orcid.org/0000-0002-8532-114X
c
https://orcid.org/0000-0002-9150-8891
d
https://orcid.org/0000-0001-6378-6854
its education and reach the poor sectors. For this rea-
son, its buildings are located in sectors historically
relegated to the national level, which present high
indices of unsatisfied basic needs and social prob-
lems. Each EMU is built to guarantee access for
the school population in rural areas permanently ex-
cluded from educational services. EMUs are based on
various location criteria for their construction. How-
ever, it is challenging to choose the optimal location
of educational centers based on spatial analyses. It is
essential to fulfilling all social demands considering
poverty and accessibility. Various methodologies and
approaches help planners and governments to address
system inefficiency problems through Geographic In-
formation Systems (GIS) (Al-Sabbagh, 2020), (Bulti
et al., 2019), (Boix and Olivella, 2007). The Ge-
ographic Information System provides reliable data
with spatial references that decision-makers could use
to guarantee the optimal distribution of schools based
on the impact of the children served. The study of lo-
cation optimization is not new. Thus, since 1909 We-
ber has studied the optimization of the location of a
company in a region (Okabe and Suzuki, 1997). How-
ever, in recent works, there are applications of these
studies related to the location of schools. In (Jabbar
and Laffta, 2020), the authors propose a methodology
to analyze location sites of private secondary schools
Navas, G., Loyaga, A., Barahona, J. and Orellana, J.
Poverty Population and Its Educational Accessibility: An Evaluation using Geospatial Database in Ecuador.
DOI: 10.5220/0011075200003185
In Proceedings of the 8th International Conference on Geographical Information Systems Theory, Applications and Management (GISTAM 2022), pages 147-154
ISBN: 978-989-758-571-5; ISSN: 2184-500X
Copyright
c
2022 by SCITEPRESS – Science and Technology Publications, Lda. All rights reserved
147

in the Al-Jihad neighborhood in Baghdad-Iraq. This
methodology determines the spatial distribution pat-
terns of the private secondary schools in the study area
and the distance between the secondary school sites
in the neighborhoods and, finally, in the appropriate
locations by analyzing the spatial distribution of the
schools and determining suitable locations. In an-
other study conducted in Jeddah, Saudi Arabia (Mu-
rad et al., 2020), the authors used a geodatabase that
incorporates data on education and population. Based
on these data, spatial and network analyzes were used
to understand the location distribution, student den-
sity, and accessibility of schools in the study region.
Both of the studies mentioned above have used GIS
tools to find the location of schools, considering dif-
ferent parameters. However, the authors do not men-
tion the optimal location and whether their methodol-
ogy can be applied to the entire country. All of these
works are applied to small cities. In contrast, in (Botto
et al., 2015), the authors locate schools in Uruguay
based on proximity criteria to target households and
prioritize socioeconomic vulnerability. The main idea
is to use an optimal allocation algorithm to distribute
the population. Therefore, the current supply should
be sufficient to cover the demand. However, the au-
thor does not consider other parameters such as road
accessibility.
Other approaches include additional parameters.
For example, in (Al-Sabbagh, 2020), the authors pro-
pose a study that uses GIS tools to locate elementary
schools based on different strategies such as current
elementary school distribution, average nearest neigh-
bor, hotspot analysis, and clustering analysis. Fur-
thermore, in (Sezer et al., 2018) the study applies the
network analysis to locate the closest schools in the
city of Usak. The study also considers the number of
students, teachers, classrooms, roads, and buildings.
These data were obtained from the Usak municipality
zoning plan and the OpenStreetMap vector. In all of
these previous works, the use of bigdata is missing.
Therefore, the main contribution of this work is to
extend previous methodology (Navas et al., 2019) to
evaluate the impact of the school’s location in the pop-
ulation with attendance poverty in Ecuador, but taking
into account the road accessibility and the distribution
of the Voronoi Diagram as optimal distribution. It is
worth noting that the combination of economic data
(poverty) and GIS tools such as Voronoi and road ac-
cessibility is a challenge because our study belongs to
all of the country (bigdata).
So, in this work, an extension of a novel methodol-
ogy is proposed for evaluating the location of schools
based on multiple factors such as poverty level, road
accessibility, access distance, and a Voronoi Diagram.
It is challenging because the use of mixed bigdata,
including demographic and spacial data (Yan et al.,
2010).
2 METHODS
Before starting the description of the methodology,
terms and basic operations of spatial data analysis are
briefly explained.
• The Voronoi Diagram. It is generated from
N spatial objects (geographical points or lines),
which must generate N Voronoi polygons that de-
limit each object, where the number of sides of
this polygon is according to the number of clos-
est neighbors, consequently generating a polygon
that contains the area of influence of the object
(Erwig, 2000).
• The Buffer Operator. Returns a buffer zone at
a specified distance from a geographic point or
line. The type of geographic object obtained is a
polygon, and what is inside the polygon is called
a buffer zone.
• The Intersection Operator. Returns a zone of in-
fluence corresponding to the intersection or com-
mon area between two classes of different geo-
graphic entities. The Intersection. is that opera-
tor where there are two areas that give place to the
intersection or common area between them.
• Population Density. The ρ, corresponds to to
population density in number of inhabitants per
square kilometer (hab/km
2
).
Next, the mathematical formalization is established in
a subsequent subsection to show how it is applied and
finally land the case study’s solution.
2.1 Methodology Development
The objective of this methodology is to establish pos-
sible locations that are the most appropriate accord-
ing to the variable considered. In our case study the
location corresponds to new sites to locate new pre-
university study centers and the parameter to consider
is poverty and the accessibility. From step 1 to step
8, the existing locations are analyzed based on the pa-
rameter studied to order them from highest to lowest
depending on the parameter. Starting from step 9, the
procedure is given to establish the new locations. The
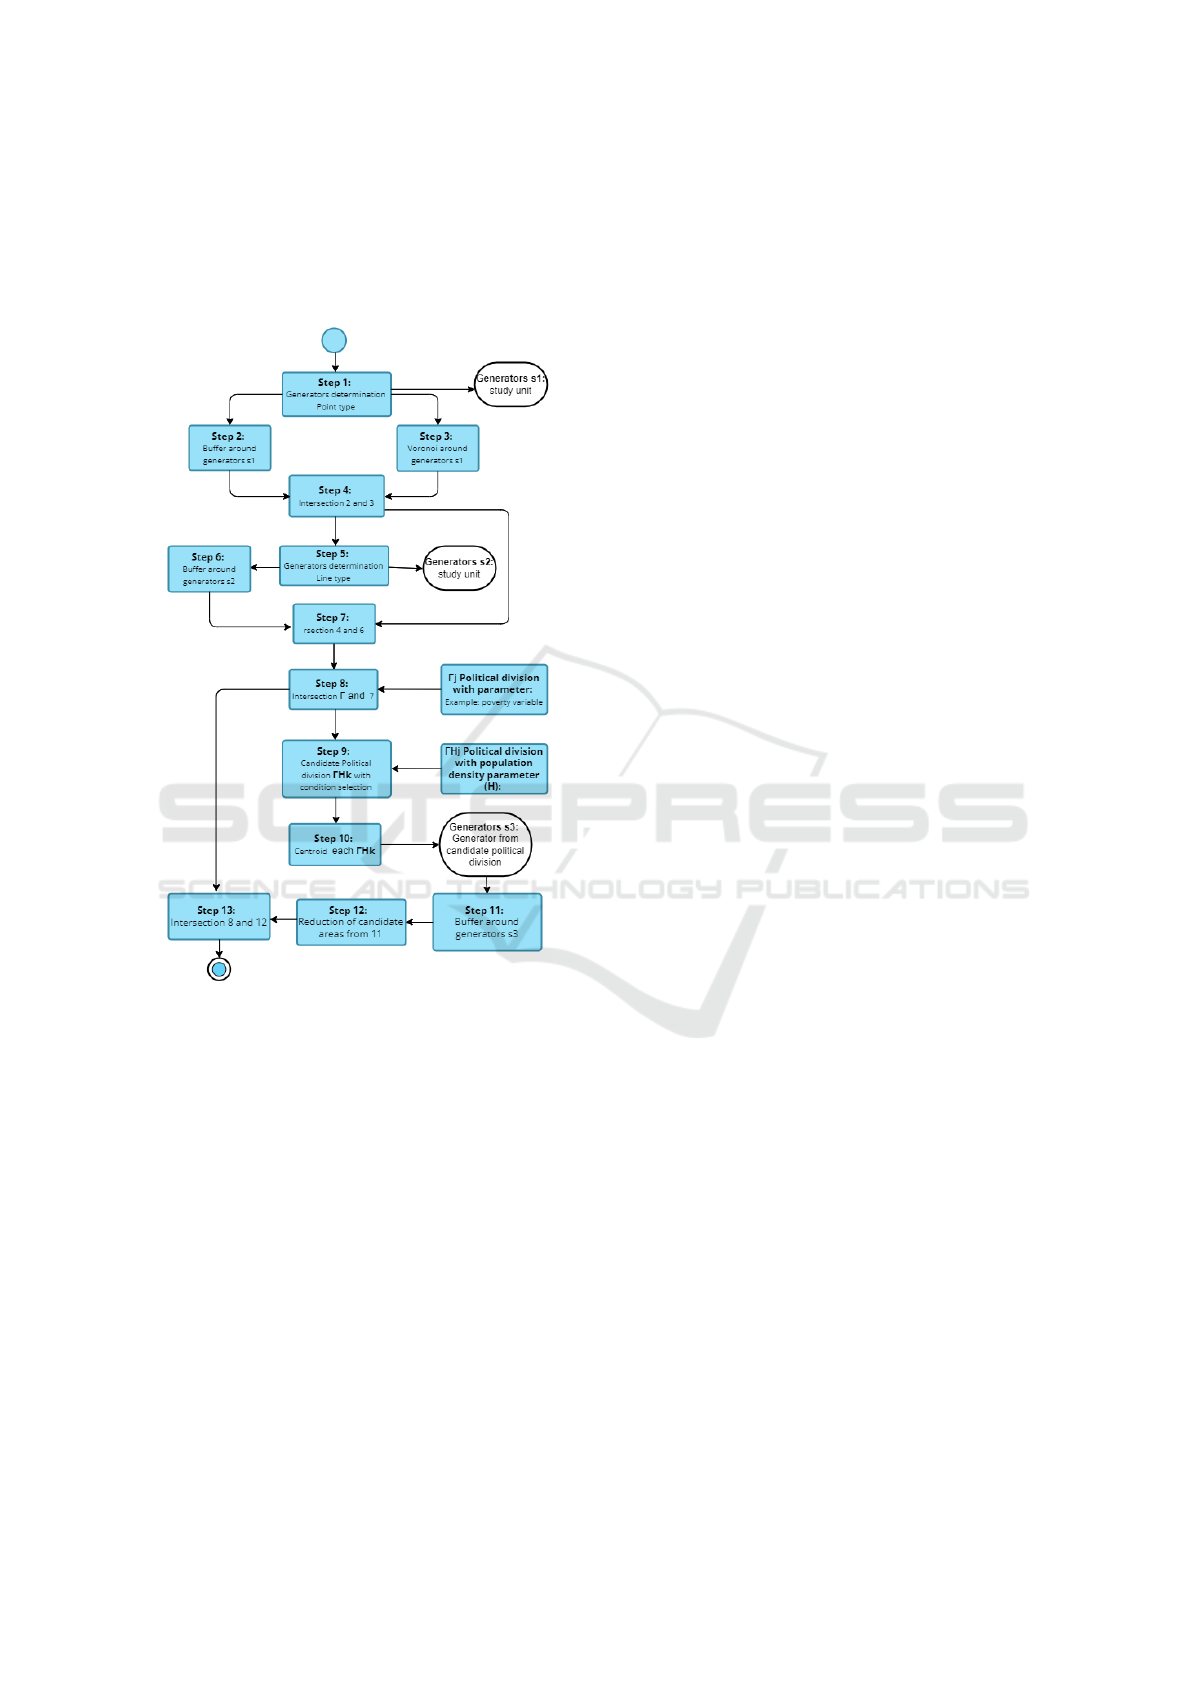
process is explained bellow (see Figure 1).
Step 1: First, set the generators ”s1
i
” that are the fun-
damental input for steps 2 and 3 that generate the di-
agrams of Voronoi and Buffer tool respectively. The
GISTAM 2022 - 8th International Conference on Geographical Information Systems Theory, Applications and Management
148
generator turns out to be the geographical location of
all the units that exist, are located within area S and
which is being studied. In our case study they are
educational units and it is always considered a point
type.
Figure 1: Methodology development diagram.
These units can be the geolocated location of the
subject studied and point type. For example, in the
case of education, it would be the location of edu-
cational centers, or in business, it could be the loca-
tion of product distribution centers, etc. Step 2: The
generators from step 1 will be used for the Voronoi
diagrams, the first classification of these limits comes
given by the result of applying the Voronoi diagram in
a established area. Voronoi diagrams cover the entire
space of study. Step 3: Corresponds to the Buffer tool
around the generators set in the first step. One feature
is that there must be as many areas generated by the
Voronoi diagram as areas generated by the Buffer, and
these must be equal in quantity to the number of ge-
ometries generated in step 2.
B
io
(ν, generators, distance) = β
o
(ν
i
,s1
i
,d) (1)
where B
io
occupies a subspace of S
Step 4: Intersection operator between the generated
areas in steps 2 and 3. For this case there can be two
types of polygons resulting.
• That the buffer is completely within the Voronoi
diagram correspondent.
• Let the two areas intersect in a common area.
I
i
= B
io
∩ ν
i
(2)
The i index traverses each of the generators for both
the polygons of Voronoi as well as for the Buffer ar-
eas generated.
Step 5: It is a new generator ”s2
i
” that corresponds to
ways land, river, etc. found in area S.
Step 6: It is a buffer around the generators ”s2
i
” re-
lated to the access roads, which were established in
step 5. This buffer corresponds to an area of influence
of the road, depending on the closeness to her.
B
li
(S,generators,distance) = β
o
(ν
i
,s2
i
,d)r (3)
Step 7: It is an intersection operation between the
results from step 4 and step 6. Giving rise to a new
result that is:
I
Ti
= B
li
∩ I
i
(4)
Applying I
i
, we have:
I
Ti
= ( B
li
∩ ( B
oi
∩ ν
i
)) (5)
This relates the areas linked to the units with accessi-
bility.
Step 8: It is an intersection between the geopoliti-
cal division with the analyzed parameter ”Γ
j
” and the
step 7 result ”I
Ti
”. It gave rise to a new result that is
formalized as follows manner.
I
Fi
= Γ
j
∩ I
Ti
(6)
Applying I
Ti
, we have:
I
Fij
= Γ
j
∩ ( B
li
∩ ( B
oi
∩ ν
i
)) (7)
Γ
j
corresponds to the number of political divisions,
which contains the parameter to be analyzed. There-
fore, the index j is different from index i, since j cor-
responds to the number of political divisions within
”I
T
i”, The parameter in Γ
j
, can be diverse, in some
cases, it could be the poverty index and in another
moment could be the Population Density H. The in-
tersection gives rise to a series of sub-areas for each
unit provided in generator ”s1
i
”. Every sub-area in-
cludes its value of the parameter.
It is analyzed for sub-areas for each generator
1, the procedure described by (Navas et al., 2019)
for I
Fij
through the formula 8 of weighting a group
of data X
1
,X
2
,...,X
n
, considering a series of coeffi-
cients or parameters for each political division, called
Poverty Population and Its Educational Accessibility: An Evaluation using Geospatial Database in Ecuador
149
weights W ,W
2
,...,W
n
. It can determine the level of
the parameter in each weighted political division of
each irregular polygon.
X
w
=
(w
1
X
1
+ w
2
X
2
+ ... + w
n
X
n
)
(w
1
+ w
2
+ ... + w
3
)
(8)
Step 9: Incorporate the population density parameter
H at the level of political divisions it corresponds to
Γ
H j
, and select those political divisions that incorpo-
rate the conditions of selection. These selected divi-
sions will be called ”candidate political division” Γ
Hk
.
Γ
Hk
∈ Γ
H j
; (9)
where Γ
Hk
meets selection condition.
Step 10: Location of the centroid for each of the Can-
didate political divisions.
∀ Γ
Hk
∈ Γ
H j
∃ s3
k
(10)
Where ”s3
k
”, is the centroid of the divisions of each
political candidate Γ
Hk
. And Where ”s3
k
” is a new
generator.
Step 11: With the Buffer tool around the generator
obtained in step 10, it was generated the area of influ-
ence of each candidate centroid ”s3
k
”. One character-
istic is that there must be as many areas generated by
the buffer tool as the number of candidate centroids
”s3
k
” that was generated in step 10.
B
s3
k
ik
(S,generators,distance) = β
o
(ν
ik
,s3
k
,d)r
(11)
Step 12: the goal of this step is to reduce the number
of areas generated for each candidate centroid, from
step 11, with those.
B
lik
∈ B
s3
k
ik
(12)
Where B
lik
, are the reduced candidate areas corre-
sponds to a reduced set of B
s3
k
ik
.
Step 13: An intersection between the candidate areas
reduced by the area corresponding to the roads ob-
tained in step 6. B
lik
is carried out, with the area of
influence of step 8.
I
kli
= B
lik
∩ B
ii
(13)
2.2 Case of Study
The following case study was carried out in Ecuado-
rian territory. In this way, it was essential to ho-
mogenize the geographic data for proper geoprocess-
ing. Thus, the geographic reference system was deter-
mined in EPSG / SRID 32717. This identifier corre-
sponds to Datum WGS84, UTM zone 17S. The Post-
greSQL Database Management System was used with
its extension for GIS, PostGIS, to carry out this geo-
processing. Steps 1 and 2 are shown in Figure 2.
Step 1: In the Ecuadorian context, the geographical
information on the positioning of educational institu-
tions is registered by the MINEDUC. The point type
geographic records are found in the geographic refer-
ence system corresponding to the EPSG / SRID code
32717 (Guti
´
errez, 2006) (Llario, 2013).
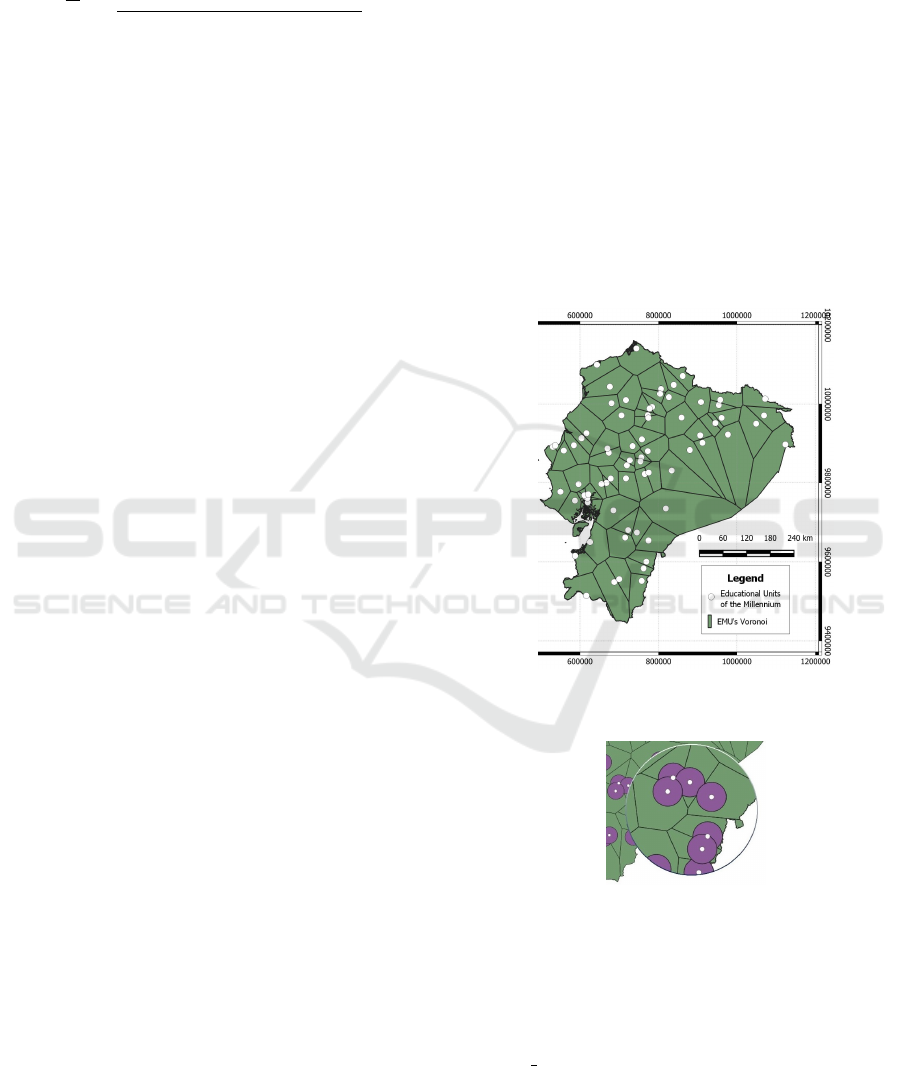
Step 2: Before creating the Voronoi Polygons, it is
necessary to have geographic information of the poly-
gon type that describes the political boundary of the
country, whose function is to create the Voronoi con-
tour and segment the Ecuadorian territory. This op-
eration results in the Voronoi segmentation of educa-
tional institutions whose external contour is a quadri-
lateral by default. Here, using the intersection opera-
tion, only the Ecuadorian territory is outlined, which
is the region of this case study (Guti
´
errez, 2006)
(Llario, 2013).
Figure 2: Area of each EMU segmented with Voronoi dia-
grams.
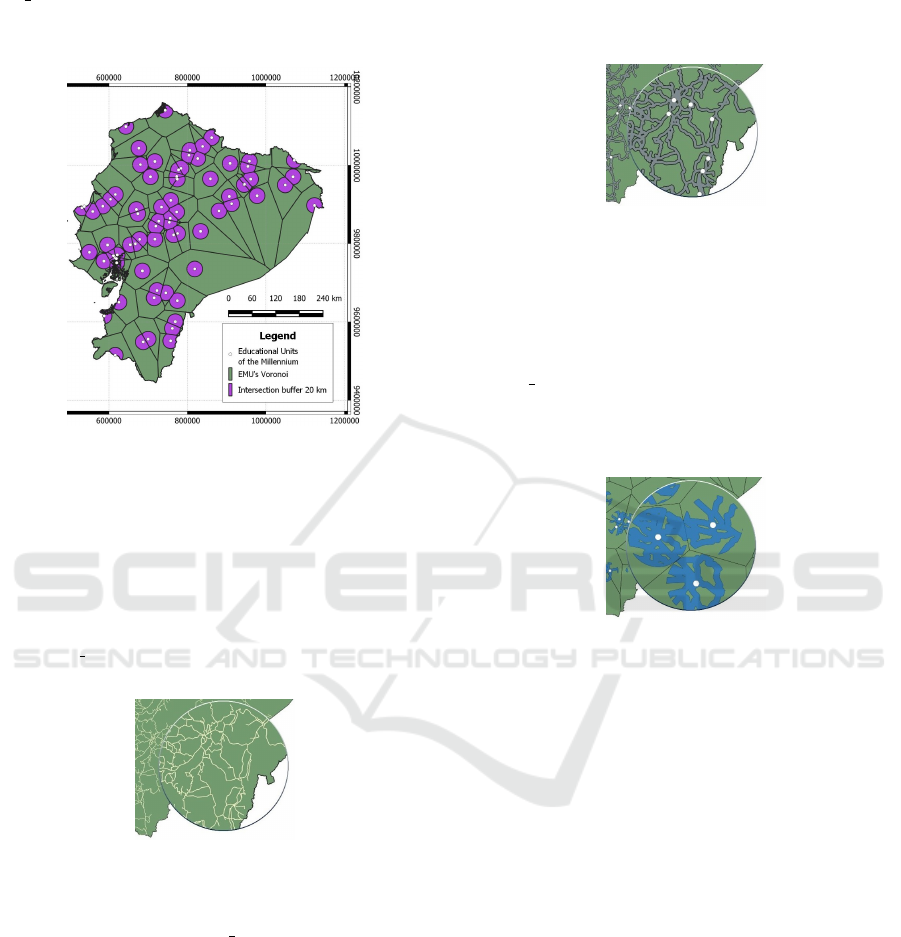
Figure 3: 20km radial buffer.
Step 3: The buffer to each educational institution was
determined for a radius of 20 km as is shown in de-
tail in Figure 3. The proposal of this value is based
on the evidence of students in neighboring communi-
ties up to 20 km away. For this, the operation used
was ST Buffer, which creates a circular polygon with
the specified radius (Guti
´
errez, 2006) (Llario, 2013).
Step 4: Taking the segmentation by Voronoi poly-
gons and segmentation by radial buffers of each ed-
ucational institution, we contrast the areas in which
GISTAM 2022 - 8th International Conference on Geographical Information Systems Theory, Applications and Management
150
these two paths converge. It is possible through the
ST Intersection operation, which takes two geome-
tries as parameters and returns the space intersect (see
Figure 4) (Guti
´
errez, 2006) (Llario, 2013).
Figure 4: Intersection of Voronoi polygons of each EMU
with 20 km buffer.
Step 5: In Figure 5, the geographic information of
the Ecuadorian road network can be found on the offi-
cial IGM site and the “multiline” type geographic data
set can be found in the EPSG/SRID 4326 reference
system. For the conversion of geographic data to the
EPSG/SRID 32717 reference system specified in step
1, the ST Transform operation was used (Guti
´
errez,
2006) (Llario, 2013).
Figure 5: Ecuadorian road network.
Step 6: The zone of influence of the road network can
also be obtained with the ST Buffer operation. In this
case, being of type line, the parameter within the op-
eration indicates the width of the buffer. For this, the
relative distance of 2 km from the road’s edge was ap-
plied to each side. That distance was estimated con-
sidering that there are records of children who have
to walk up to 30 minutes from their home to reach
school transport on the nearest road. With this, we
know how far the schoolboy can walk, but not the
distance. However, if the ACSM is considered, which
indicates that an average adult can reach a 5 km/h av-
erage walking pace, that is, the adult would walk 2.5
km every 30 min. If we extrapolate this value to the
reality of a student, we can consider that in the best
of cases, it would be expected that they could walk
approximately 2 km (see Figure6 (Guti
´
errez, 2006)
(Llario, 2013).
Figure 6: Ecuadorian road network buffer.
Step 7: In this step, the expected zone of influence
of the methodology is determined, where the zone of
influence of the educational institution (step 4) con-
verges with the buffers that describe the Ecuadorian
road network (previous step). Thus, finally, through
the ST Intersection operation, it can be seen in 7,
the area of influence of each educational institution,
including its road accesses (see Figure7 (Guti
´
errez,
2006) (Llario, 2013).
Figure 7: Coverage area of each EMU through its road ac-
cesses.
Step 8: The information that describes the level of
poverty (according to the NBI indicator) in Ecuador,
is available at the National Institute of Statistics and
Censuses. The granularity in which this informa-
tion is found is at the parish level, accompanied by
polygon-type data, which describes its spatial posi-
tion and limits as is shown in Figure 8.
In this way, we proceeded to intersect the area of
influence from the previous step, contrasting the poly-
gons that describe the parishes where each institution
is located, to assign a percentage of these intersections
impact (Guti
´
errez, 2006) (Llario, 2013). From this
step it was intended to obtain potential locations for
new educational institutions. An update was made,
going from 77 (used in the previous steps) to 97 insti-
tutions. Once the institutions are adjusted to the geo-
graphic reference system used, the study continues.
Step 9: To obtain a candidate political division, the
selection conditions were taken: poverty >= 90%
and population density >= 5 inhabitants/km
2
, where
the population density data was obtained from the
INEC. Resulting in 379 candidate political divisions
(see Figure 9) (Guti
´
errez, 2006) (Llario, 2013).
Poverty Population and Its Educational Accessibility: An Evaluation using Geospatial Database in Ecuador
151
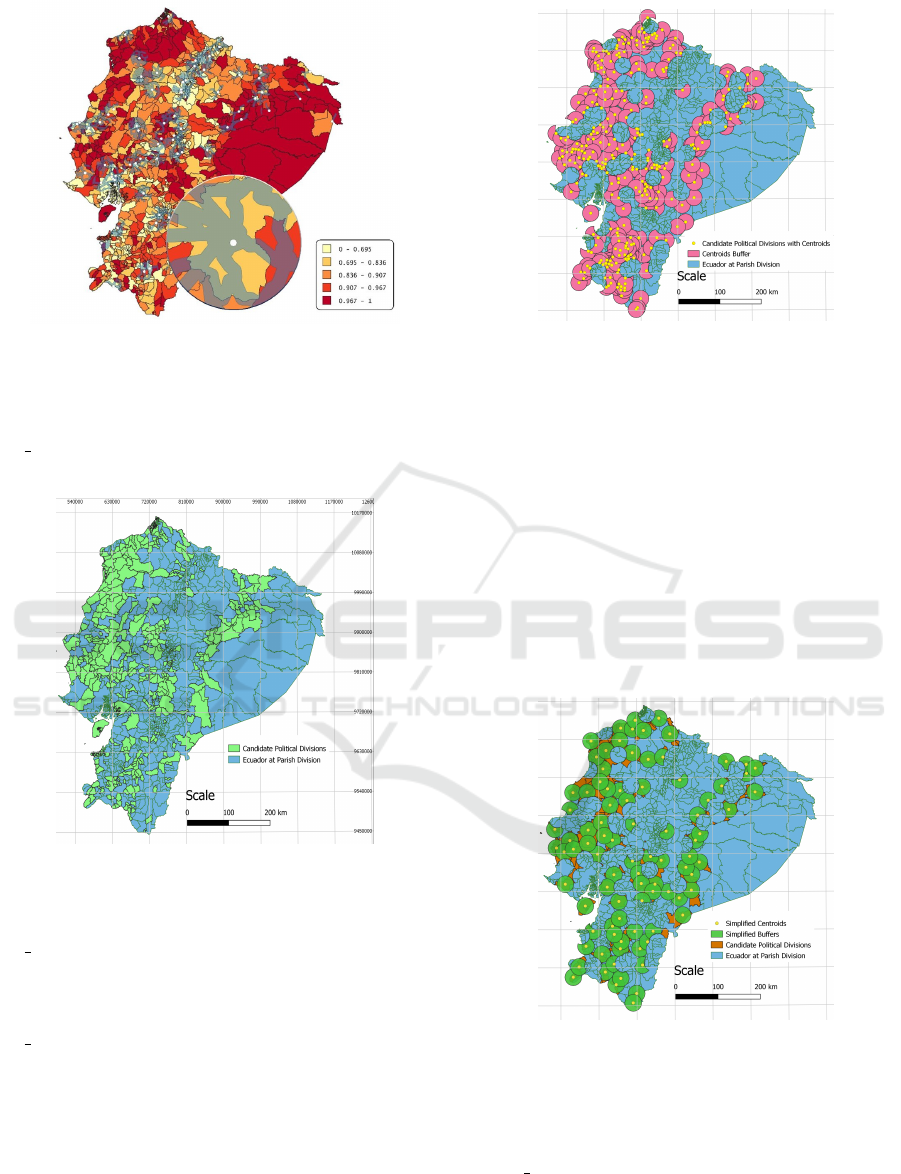
Figure 8: Area of influence of each educational institution
(Area of influence “Dendritas” style) contrasting with the
poverty levels of each parish.
Step 10: With the results of the previous step, an
ST Centroid operation was performed on each of the
candidate political divisions.
Figure 9: Candidate Political Divisions based on selection
conditions.
Step 11: Once the centroids were obtained, the
ST Buffer operation was performed to obtain their re-
spective 20 km buffers, presenting intersections with
the existing institutions. To eliminate the intersec-
tions, a differential analysis was performed using an
ST Difference operation, obtaining 298 candidate po-
litical divisions.
Step 12: The buffers obtained in the previous step
present overlapping and to simplify them, the follow-
ing points are taken into consideration.
To assign the demand to the solution, the selec-
tion conditions of Candidate Political Divisions were
taken (Step 9), based on the heuristic method. On the
other hand, for the random substitution of candidate
sites, the centroids that cover most of the Candidate
Figure 10: Candidate Political Divisions with centroids
without intersections with existing institutions.
Political Divisions and do not have an intersection of
more than 40% between the existing institutions were
taken.
Next, it seeks to choose the buffers that occupy
the most territory of the Candidate Political Divisions,
based on the Maximum Coverage Model (COBE-
MAX), so that most of the potential users have access
to the institutions.
Taking these considerations into account, a man-
ual selection of these centroids with their corre-
sponding buffers was carried out, obtaining a result
of 90 Candidate Political Divisions (see Figure11
(Guti
´
errez, 2006) (Llario, 2013).
Figure 11: Result of simplification of Candidate Political
Divisions.
Step 13: At the time of the investigation, it was de-
cided to carry out an intersection between the road
map (Step 6) and the result of the previous step with
the ST Intersection operation, in order to have a more
applicable response. With the information obtained, it
was possible to establish 49 possible institutions (see
Figure12 (Guti
´
errez, 2006) (Llario, 2013).
GISTAM 2022 - 8th International Conference on Geographical Information Systems Theory, Applications and Management
152
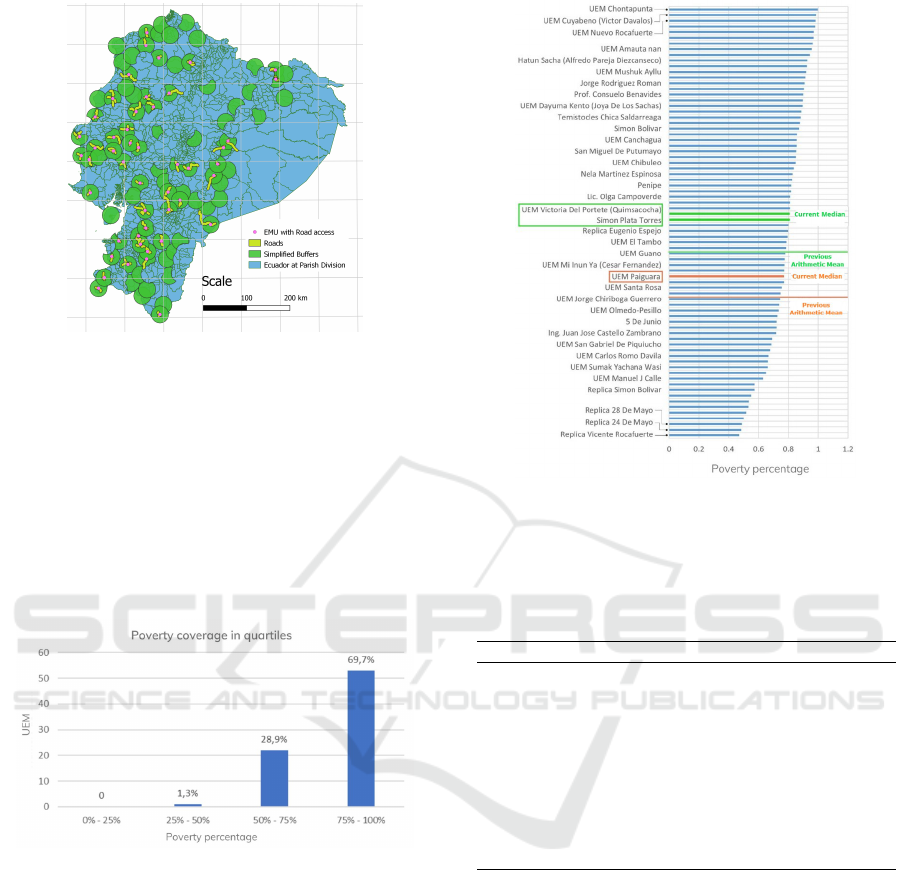
Figure 12: Result of simplification of Candidate Political
Divisions intersection with Roads.
3 RESULTS
Within the application of the methodology, it has been
possible to categorize the EMUs according to the per-
centage of poverty that each unit covers, confirming
what was stated by (Navas et al., 2019). On the fact
that the units provide coverage to the poorest popula-
tions in Ecuador, as shown in Fig 15.
Figure 13: Educational units with the highest and lowest
levels of poverty coverage.
Among the institutions with a higher poverty level
are EMU Chontapunta, EMU Cuyabeno, EMU Nuevo
Rocafuerte, with 99.7%, 98.7%, and 98.2%, respec-
tively, and those with the lowest impact are the repli-
cas of schools and schools. Emblematic, such as the
case of the R
´
eplica 28 de Mayo Educational Unit, the
24 de Mayo R
´
eplica Educational Unit, and the Vi-
cente Rocafuerte R
´
eplica Educational Unit that reach
a poverty level of 48.9%, 48.5%, and 47.5%, respec-
tively, as shown in Fig 16.
The median is between the Victoria Del Portete
EMU and the Sim
´
on Plata Torres EMU with a poverty
value of 80.46%, unlike Navas’s work, which placed
him in the Paiguara EMU (76.65%), which gives a
difference in poverty of 4.01%. Likewise, the arith-
Figure 14: Educational units with the highest and lowest
levels of poverty coverage.
metic mean changes from 74.29% to 78.33%, which
means that 43 EMU are above the mean.
Table 1: Potential Institutions with Locations.
Name
EMU
Province Canton Parish
%
Poverty
Inhab/
km²
Axis
X
Axis
Y
Rioverde Esmeraldas Rioverde Chumunde 99.97 6.96
679507.1571
19276
10077535.2657
998
Estero Palma
Real
Esmeraldas Rioverde Rocafuerte 99.23 44.36
681846.8710
54963
10107094.2821
584
Rio Pucon Manab
´
ı Santa Ana San Pablo 99.59 24.99
604574.3910
3765
9865796.98325
485
La Uni
´
on Manab
´
ı Jipijapa La Uni
´
on 99.33 41.63
561136.7732
79309
9840981.84094
969
Laberintos de
Chiguaza
Morona
Santiago
Huamboya Chiguaza 99.15 12.37
836801.2804
56689
9777508.24942
71
Laguna de
Colta
Chimborazo Colta
Santiago de
Quito
99.89 102.31
752692.9619
71973
9803005.52237
091
Rio Jord
´
an Esmeraldas Quininde Malimpia 98.94 15.21
709261.3166
20332
10048759.7177
263
Rio Yescas Manab
´
ı Chone Eloy Alfaro 98.08 23.9
602172.0862
98068
9955058.45505
88
Junquillal Guayas Salitre Junquillal 97.96 135.52
626877.5440
93636
9808904.39372
348
Gruta de
la Santa Faz
El Oro Zaruma Guanazan 97.9 15.86
666478.9224
0681
9618913.19839
841
The circular area of each of the units intersects
with the polygons delimited by Voronoi, and with the
buffer of the access roads and, the ease of accessing
it through the tracks. As a result of the execution of
steps 9 to 13, a coverage of 60.62% of the national ter-
ritory was obtained between the existing institutions
and the new ones that are proposed. In order to give
a more tangible result, the first 10 institutions where
the level of poverty are the highest were taken. The
results obtained describe a name for the institution,
parish, canton, province, percentage of poverty, pop-
ulation density (inhab/km²) and coordinates in UTM
format zone 17 S with SRID 32717 with their respec-
tive X, Y axis, as can be seen in (Table 1).
Poverty Population and Its Educational Accessibility: An Evaluation using Geospatial Database in Ecuador
153

4 CONCLUSIONS
This document proposes an evaluation methodology
using Geospatial tools to address the optimal location
of schools by taking factors such as poor population,
distance, spatial distribution, and road access. In ad-
dition, a case study is analyzed with educational cen-
ters obtaining promising results. The feasibility and
rationality of the method proposed in this document
are verified, considering that it has been applied to the
entire country and its road network. The results show
that 90% of the academic units are in areas where
more than 50% of the poor population is concentrated,
and there is also a road axis for access. It should be
noted that the methodology can be easily adapted to
other analysis scenarios and other study areas such as
health, transport, logistics, etc.
A base political division of the study territory in-
cluded the analysis variable, which allowed obtain-
ing the results. All of this could be applied to lo-
cations that offer a service other than those of the
EMUs, which would work similarly. The main ad-
vantage of using an amalgamation of methodologies
to obtain potential institutions over a conventional
method based on existing functions is having several
considerations for the locations. At the same time,
social inclusion is taken into account, giving way to
more humanly applicable results instead of obtaining
an exclusive result for not having some GIS-based
feature. The result can be adjusted to more conve-
nient locations, being able to carry out the process
as many times as necessary, to obtain a response that
is geographically valid. These results, coming from
a heuristic method, are optimal and conform to the
concepts of Spatial Efficiency. These institutions are
as close to the population and access roads. In ad-
dition, the concept of Spatial Justice could be consid-
ered, where the educational services of the institutions
are distributed in such a way that the largest possible
part of the Ecuadorian territory is covered. Addition-
ally, as future work, other features can be explored,
such as safety and environment, and other techniques
like reverse Voronoi, to find optimal school locations.
REFERENCES
Al-Sabbagh, T. A. (2020). GIS location-allocation mod-
els in improving accessibility to primary schools in
mansura city-egypt.
Boix, G. and Olivella, R. (2007). Los sistemas de infor-
maci
´
on geogr
´
afica (sig) aplicados a la educaci
´
on. el
proyecto pesig (portal educativo en sig). Las com-
petencias geogr
´
aficas para la educaci
´
on ciudadana,
1:23–32.
Botto, G., Detomasi, R., ANEP, and INAU (2015). Bases
metodol
´
ogicas para la planificaci
´
on espacial de servi-
cios de educaci
´
on inicial en uruguay. Accepted: 2018-
12-08T11:50:11Z Publisher: Universidad Nacional de
Luj
´
an.
Brock, M. E. and Schaefer, J. M. (2015). Location matters:
Geographic location and educational placement of
students with developmental disabilities. 40(2):154–
164. Publisher: SAGE Publications Inc.
Bulti, D. T., Bedada, T. B., and Diriba, L. G. (2019). Ana-
lyzing spatial distribution and accessibility of primary
schools in bishoftu town, ethiopia. 27(2):227–236.
Erwig, M. (2000). The graph voronoi diagram with ap-
plications. Networks: An International Journal,
36(3):156–163.
Guti
´
errez, M. (2006). El rol de las bases de datos espaciales
en una infraestructura de datos. In GSDI-9 Conference
Proceedings, pages 6–10.
Jabbar, S. A. and Laffta, S. (2020). Spatial analysis of pri-
vate school sites in al-jihad neighborhood in baghdad-
iraq by using geographic information systems. In IOP
Conference Series: Materials Science and Engineer-
ing, volume 737, page 012247. IOP Publishing.
Llario, J. C. M. (2013). PostGIS 2: an
´
alisis espacial avan-
zado. Juan Carlos Mart
´
ınez Llario.
Murad, A. A., I., A., and A, A. (2020). Using geographical
information system for mapping public schools distri-
bution in jeddah city. 11(5).
Navarrete, R. and Luj
´
an-Mora, S. (2018). Bridging
the accessibility gap in open educational resources.
17(4):755–774.
Navas, G. E., Llerena Paz, R., and Vaca, F. (2019). An
´
alisis
espacial de las unidades educativas del milenio en
el ecuador y su cobertura en zonas de pobreza. LA
GRANJA. Revista de Ciencias de la Vida, 30(2):121–
133.
Okabe, A. and Suzuki, A. (1997). Locational opti-
mization problems solved through voronoi diagrams.
98(3):445–456.
Sezer, A., Deniz, M., and Topuz, M. (2018). Analy-
sis of accessibility of schools in usak city via geo-
graphical information systems (gis). TARIH KULTUR
VE SANAT ARASTIRMALARI DERGISI-JOURNAL
OF HISTORY CULTURE AND ART RESEARCH,
7(5):470–494.
UNICEF (2019). School mapping.
Yan, C., Guo, T., Sun, W., and Bai, J. (2010). Voronoi di-
agrams’ eccentricity measurement and application. In
2010 18th International Conference on Geoinformat-
ics, pages 1–4. IEEE.
GISTAM 2022 - 8th International Conference on Geographical Information Systems Theory, Applications and Management
154
