
Detection and Delimitation of Natural Gas in Seismic Images using
MLP-Mixer and U-Net
Carolina L. S. Cipriano
1
, Domingos A. D. Junior
1
, Petterson S. Diniz
1
, Luiz F. Marin
2
,
Anselmo C. Paiva
1
, Jo
˜
ao O. B. Diniz
1,3
and Arist
´
ofanes C. Silva
1
1
Applied Computer Group NCA-UFMA, Federal University of Maranhao (UFMA), Sao Lu
´
ıs, Brazil
2
Tecgraf Institute, Pontifical Catholic University of Rio de Janeiro (PUC-Rio), Rio de Janeiro, Brazil
3
F
´
abrica de Inovac¸
˜
ao, Instituto Federal do Maranh
˜
ao, Graja
´
u, Brazil
Keywords:
Hydrocarbons, Seismic Images, MLP-Mixer, U-Net, DenseNet, ResNet, Machine Learning.
Abstract:
The seismic data acquired through the seismic reflection method is important for hydrocarbon prospecting.
As an example of hydrocarbon, we have natural gas, one of the leading and most used energy sources in the
current scenario. The techniques for analyzing these data are challenging for specialists. Due to the noisy
nature of data acquisition, it is subject to errors and divergences between the specialists. The growth of deep
learning has brought great highlights to tasks of segmentation, classification, and detection of objects in images
from different areas. Consequently, the use of machine learning in seismic data has also grown. Therefore,
this work proposes an automatic detection and delimitation of the natural gas region in seismic images (2D)
using MLP-Mixer and U-Net. The proposed method obtained competitive results with an accuracy of 99.6%
(inline) and 99.55% (crossline); specificity of 99.79% (inline) and 99.73% (crossline).
1 INTRODUCTION
Hydrocarbons are molecules made up of hydrogen
and carbon. They are present in our energy resources,
such as natural gas. The occurrence of hydrocarbons
varies in space and time, as once important producing
regions have already exhausted their reserves, and
new ones are found in other areas (Teixeira et al.,
2009).
Most analysis and prospecting rely on technology
to detect and determine the extent of these deposits.
Geophysical surveys in the gas industry are mainly
conducted using seismic reflection techniques (Cox,
1999). Because they are more economical than good
drilling, it is possible to extract data regarding the
geometry and structure of the layers, rock types,
lithology, and physical properties.
Due to the seismic data’s low resolution and noisy
nature, the data interpretation is challenging. The
expert often creates several alternatives of the same
seismic structure when in doubt. Furthermore, it
is not uncommon for the team to disagree with the
interpretation and consider that parts of the data can
be reinterpreted (Patel et al., 2008). In this scenario,
machine learning has been used for the segmentation,
classification, and detection of natural gas in 1D, 2D,
and 3D seismic data.
In (Santos et al., 2019), they proposed a new
approach to detect hydrocarbon indicators in seismic
data using seismic trace and a Long Short-Term
Memory (LSTM) neural network. They used a one-
dimensional way along the seismic trace. In this
process, each seismic trace was extracted using forty
samples of window length of one sample overlapping
each window. The public database used for gases
identification was the Netherlands F3-Block. Using
accuracy as the primary metric to automatically
delimit gas pocket locations, the model achieved 97%.
In (El Zini et al., 2019) they proposed a bright
spot detection method. Bright spots are strong
indicators of the presence of natural gas. The model
used SeisNet, a convolutional neural network with a
”butterfly” architecture. The model also relied on data
augmentation and transfer learning to overcome the
data cap problem. The data used in SeisNet training
is adopted from (Rizk et al., 2017) and consists of 110
grayscale images. As a result, it reached 95.6% of the
F1 score and accuracy with an average absolute error
that did not exceed 0.04% of the total volume.
578
Cipriano, C., Junior, D., Diniz, P., Marin, L., Paiva, A., Diniz, J. and Silva, A.
Detection and Delimitation of Natural Gas in Seismic Images using MLP-Mixer and U-Net.
DOI: 10.5220/0011075000003179
In Proceedings of the 24th International Conference on Enterprise Information Systems (ICEIS 2022) - Volume 1, pages 578-585
ISBN: 978-989-758-569-2; ISSN: 2184-4992
Copyright
c
2022 by SCITEPRESS – Science and Technology Publications, Lda. All rights reserved
Therefore, this work proposes an automatic
detection method and delimitation of regions where
natural gas accumulation can occur in 2D seismic
images. It consists of MLP-Mixer for classifying
these regions and U-Net for delimiting the extension
of these accumulations.
As contributions of this research, we highlight
1) The use of the MLP-Mixer to detect the regions
of interest, reducing the search field of these
accumulations, and 2) An automatic 2D method of
direct detection of hydrocarbons.
This paper is organized as follows: Section 2
presents the proposed method for automatic detection
and delimitation of natural gas. Section 3 presents
and discusses the results. Finally, Section 4 presents
the final considerations of this study.
2 MATERIALS AND METHOD
This section details the steps of the proposed method.
After data acquisition and processing, the proposed
method consists of three main steps: 1) Model entry,
where data preparation takes place; 2) Detection of
the region of interest, where the classification of
patches between gas and non-gas occurs; and 3)
Gas delimitation, where the segmentation of the gas
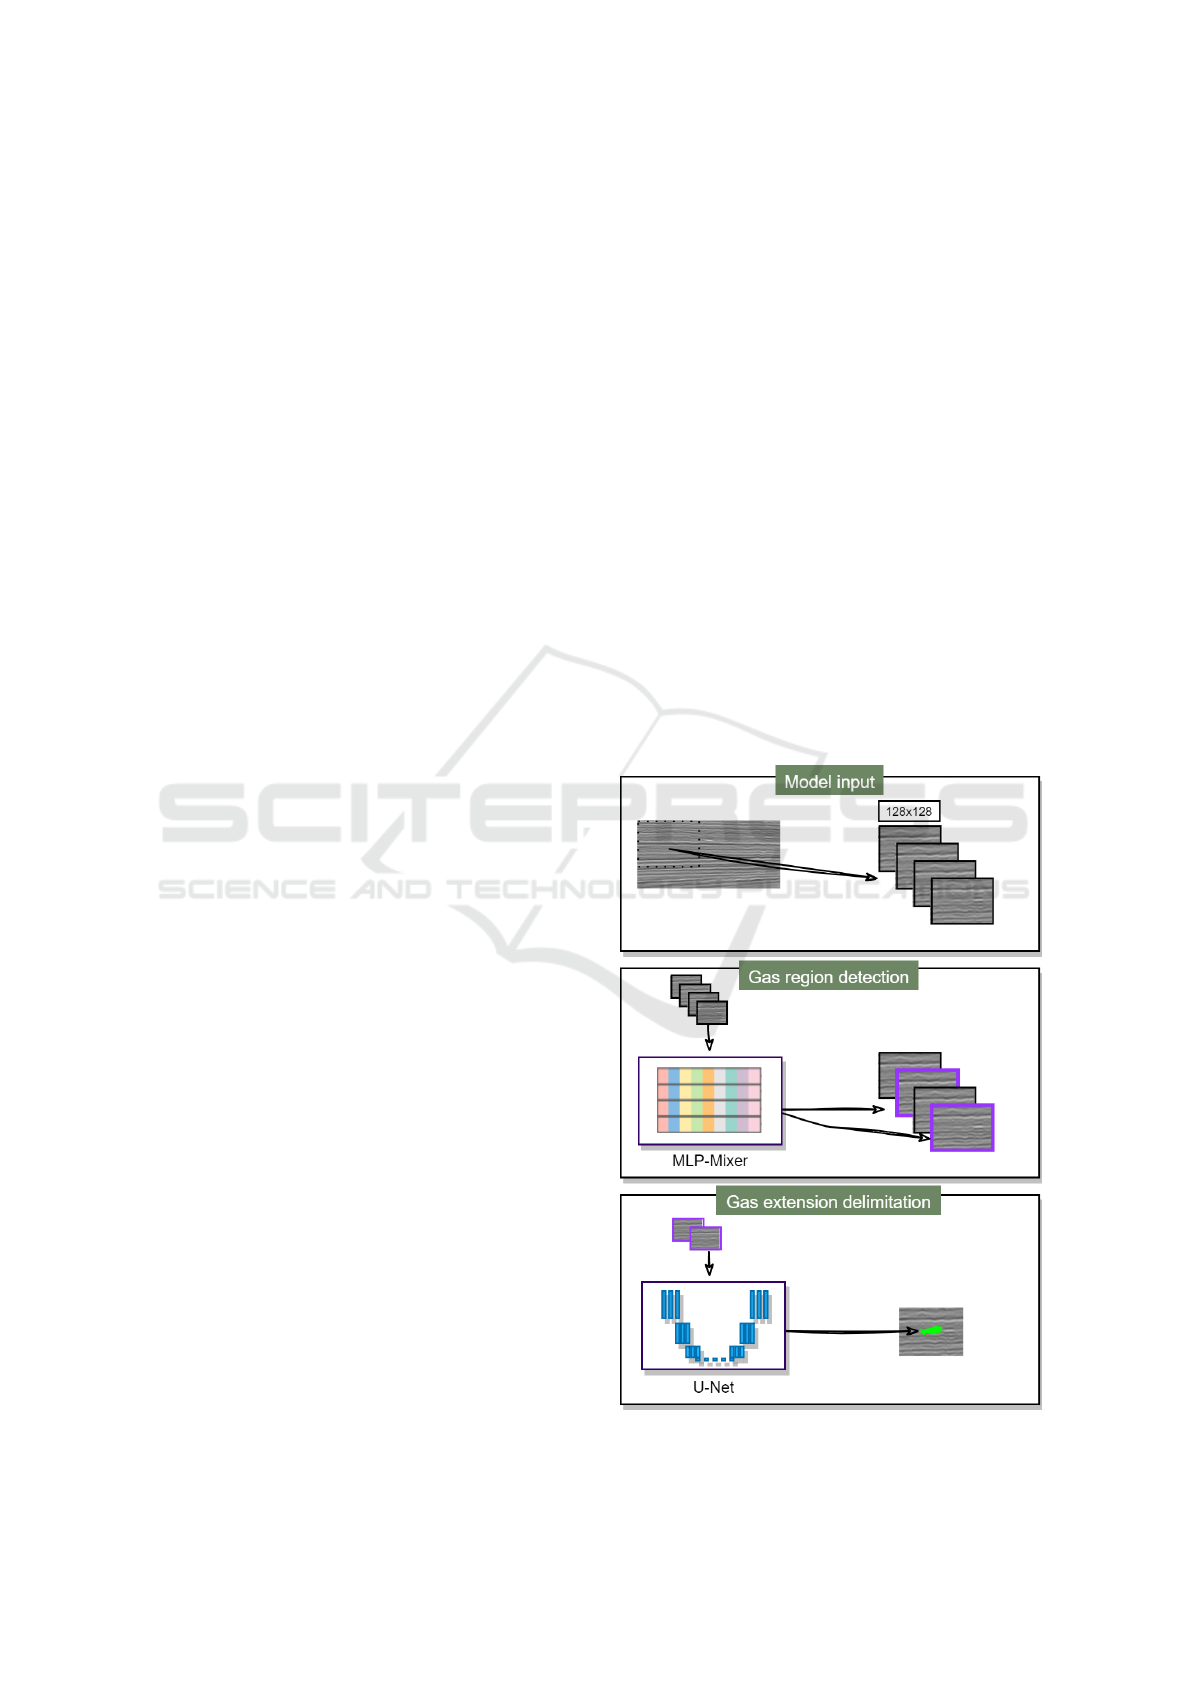
extension in the regions of interest occurs. Figure 1
summarizes these steps. And finally, the results are
evaluated.
2.1 Data Acquisition
For this work, we used the public database called
Netherlands F3-Block. F3 is a block in the Dutch
sector of the North Sea covered by 3D seismic
that was acquired to explore gas (Nubis, 1987).
The F3 has gas markings for both inlines and
crosslines (Tecgraf Institute (PUC-Rio)). Crosslines
are perpendicular lines (Schlumberger, 2021a), while
inlines are in the same direction of the data acquisition
(Schlumberger, 2021b). The 3D seismic cube was
delimited, as in (Santos et al., 2019) by Tecgraf
Institute (PUC-Rio). And finally, converted to 2D as
shown in Figure 2.
A seismic line within a 3D survey parallels the
direction in which the data was acquired. In marine
seismic data, the inline is one in the recording vessel
that tows the coils.
2.2 Model Input
After acquiring and processing the 3D data into the
2D data, the slices were loaded and saved in grayscale
by the matplotlib python library, as shown in Figure 3.
Due to the small amount of data (242 crossline slices
and 449 inline slices) and the inline and crossline lines
having different dimensions, we extracted 2D patches
with a size of 128 × 128 to increase the number of
samples and standardize these dimensions.
2.3 Gas Region Detection
After extracting patches at the model input, the
samples were presented to the MLP-Mixer (Tolstikhin
et al., 2021) for classifying gas patches and non-gas
patches.
MLP-Mixer is a classification network with
architecture based only on multilayer perceptrons. It’s
a competitive alternative that doesn’t use convolutions
or self-attention. And its architecture is based entirely
on multilayer perceptrons (MLPs) that are repeatedly
applied to spatial locations or resource channels.
(Tolstikhin et al., 2021).
Figure 4 presents the MLP-Mixer architecture,
where: input consists of patches extracted from the
input image; mixer layer blocks and sorting head
(Tolstikhin et al., 2021).
Figure 1: Steps of the proposed method.
Detection and Delimitation of Natural Gas in Seismic Images using MLP-Mixer and U-Net
579
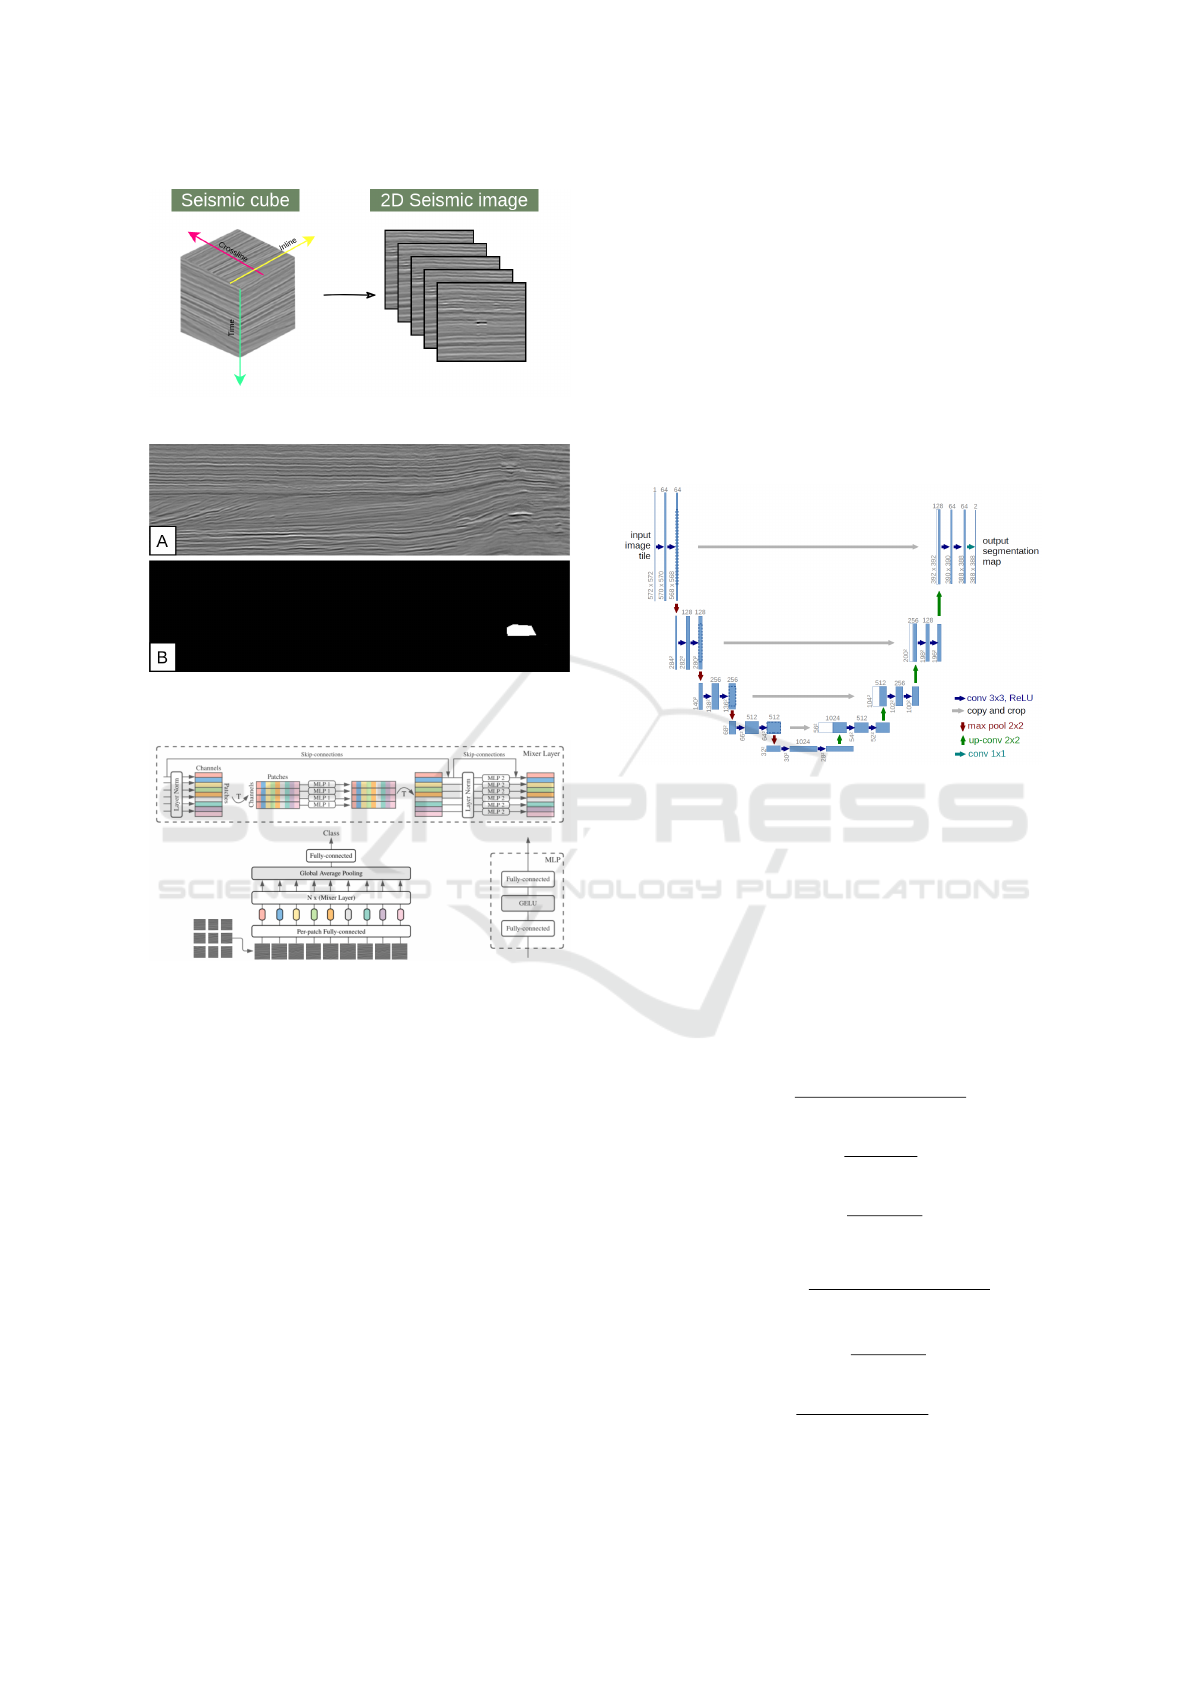
Figure 2: Illustrative picture. Seismic cube and 2D slices.
Figure 3: A) grayscale seismic image and B) corresponding
binary marking (Tecgraf Institute (PUC-Rio)).
Figure 4: Adapted from MLP-Mixer architecture
(Tolstikhin et al., 2021).
The input maintains the dimensionality of patches,
which reduces the computational cost. The
mixer layer block has two MLP layers, each
consisting of two fully connected layers and a
GELU nonlinearity: channel-mixing MLPs and
token-mixing MLPs. Channel-mixing layer allows
communication between different channels. Token-
mixing layer allows communication between different
spatial locations (tokens) (Tolstikhin et al., 2021).
The head classifier contains dropout, Global average
pooling, and softmax for classification.
2.4 Gas Extension Delimitation
After detecting gas regions by the classification
networks, the samples classified as gas samples are
presented to the Convolutional Neural Network (U-
Net) for segmentation of the gas in the patches.
The U-Net was specially designed to segment
medical images, but as it shows good results in
other fields, it was chosen to delimit the gas
extension. It is a fast network, relies heavily on data
augmentation, and can be trained end-to-end from
very few images (Ronneberger et al., 2015). U-
Net simply concatenates the encoder feature maps to
decoder feature maps at every step. This architecture
allows the decoder to learn the relevant features lost
when grouped in the encoder. Its concatenation
connections at each step do this. Figure 5 introduces
the U-Net architecture.
Figure 5: U-Net architecture (Ronneberger et al., 2015).
2.5 Validation
We used seven metrics commonly found in
classification and segmentation problems to evaluate
the results: Accuracy (ACC), Precision (PRE),
Sensitivity (SEN), F1 score (F1), Specificity (SPEC),
AUC, and Dice . These metrics evaluate the
intersection between the real (expert marking) and
what is proposed by the method (method result), as
shown in the following equations:
Accuracy =
T P + T N
T P + FP + FN + T N
(1)
Precision =
T P
T P + FP
(2)
Sensitivity =
T P
T P + FN
(3)
F1 − score = 2 ∗
Precision ∗ Sensitivity
Precision + Sensitivity
(4)
Speci f icity =
T N
T N + FP
(5)
AUC =
2T P
2T P + FP + FN
(6)
ICEIS 2022 - 24th International Conference on Enterprise Information Systems
580
Dice =
2T P
2T P + FP + FN
(7)
Metrics are evaluated against image pixels.
Where:
• The True Positive (TP) is the number of pixels
classified as gas-containing pixels by the method
and the expert.
• The False Negative (FN) is the number of pixels
classified as pixels that do not contain gas by the
method but were classified as pixels that contain
gas by the expert.
• The False Positive (FP) is the number of pixels
classified as pixels that contain gas by the method
but were classified as pixels that do not contain
gas by the expert.
• The True Negative (TN) is the number of pixels
classified as gas-free pixels by the method and
also by the expert.
3 RESULTS
This section presents and discusses the results
achieved by the method developed for gas detection
and delimitation in seismic images. The analysis
sequence consists of 1) Training and testing, 2) Model
Input, 3) Gas region detection and 4) Gas extension
delimitation.
3.1 Training and Testing
The implementation was developed in Python 3.7
programming language, with Keras and TensorFlow
frameworks for U-Net and MLP-Mixer. We used the
Numpy package to manipulate the seismic data, and
the OpenCV and Matplotlib libraries to manipulate
the images. The machine used features hardware
consisting of an Intel(R) Core(TM) i7-6700 CPU @
3.40GHz, 16GB of RAM, and a 6GB GeForce GTX
1060 GPU.
3.2 Model Input
The public database called the F3 dataset (Section
2.1) contains 242 crossline and 449 inline lines.
The crossline lines were randomly divided into 162
for training, 40 for validation, and 40 for testing.
Likewise, the inline lines were divided into 329 for
training, 60 for validation, and 60 for testing. We
maintain the proportions according to (Santos et al.,
2019) for comparative purposes..
To input the gas region detection models, 128x128
patches were extracted with an overlap of 10, as
they showed better results in the MLP-Mixer than
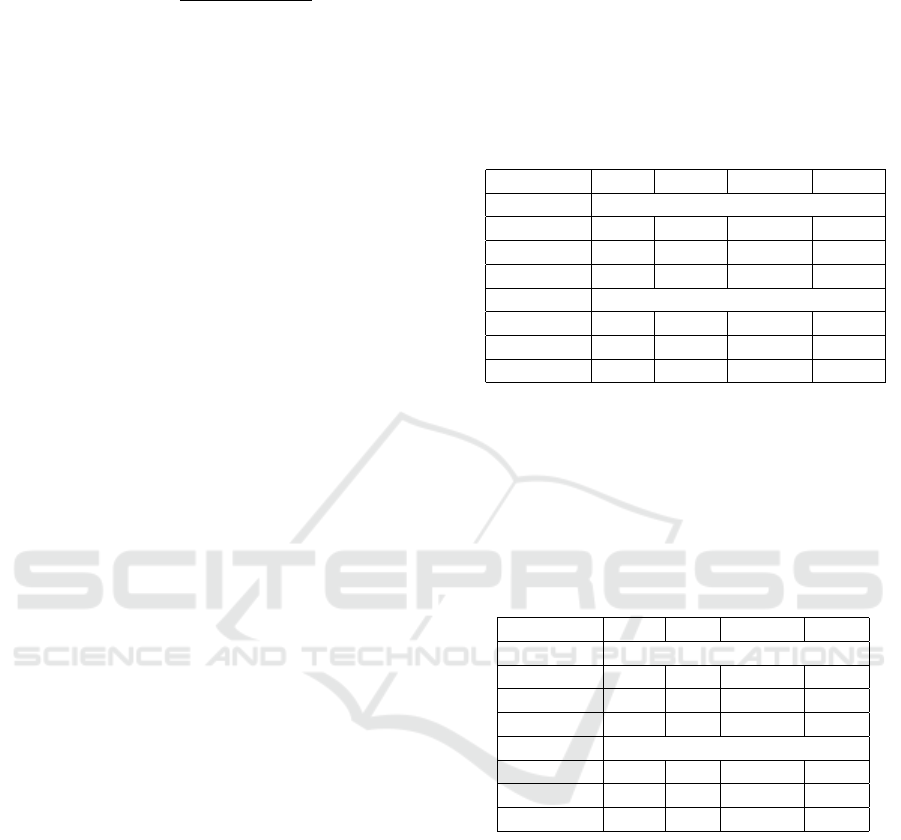
the results without overlap. Table 1 presents the
number of samples generated for training, validation,
and testing in the crossline and inline lines.
Table 1: Number of samples generated for gas region
detection models.
Files Gas No Gas Total
Crossline
Training 162 4133 16279 20412
Validation 40 1057 3983 5040
Test 40 64 336 400
Inline
Training 329 10112 51082 61194
Validation 60 1809 9351 11160
Test 60 164 796 960
For the input of the gas extension delimitation
model, we extract patches with 128x128 pixels
without overlappingg, as they did not show significant
improvements for U-Net. The number of samples
generated for training, validation, and testing in the
crossline and inline lines are presented in Table 2.
Table 2: Number of samples generated for the gas extension
delimitation models.
Files Gas No Gas Total
Crossline
Training 162 263 1357 1620
Validation 40 68 332 400
Test 40 64 336 400
Inline
Training 329 876 4388 5264
Validation 60 152 808 960
Test 60 164 796 960
3.3 Gas Region Detection
In the gas region detection step, two models were
generated: one for the inline lines and another for
the crossline lines, according to the division in the
Table 1. MLP-Mixer is a supervised classification
architecture. Thus, for training the models (crossline
and inline), the extracted patches were labeled as
patches that contained gas and patches that did not
contain gas.
For this work, we used the MLP-Mixer
implementation of (Benjamin-Etheredge, 2021)
for two classes. It has a patch size of 8 (The patch
size must be divisible by the input data size); 4 mixer
layer blocks; 64 MLP token dimension; MLP channel
Detection and Delimitation of Natural Gas in Seismic Images using MLP-Mixer and U-Net
581
dimension of 128; and, hidden dimension of 128, as
shown in Table 3.
Table 3: Settings used in MLP-Mixer.
Input 128x128x1
Patch size 8
MLP token dimension 64
MLP channel dimension 128
Hidden dimension 32
The training configuration was defined for 25
epochs, using sparse categorical cross-entropy as a
loss function and f1 score as a metric. The Table 4
presents the results for gas region detection in seismic
images.
Table 4: Result of the gas region detection step.
MLP-Mixer
Crossline Inline
ACC (%) 96.15 98.55
SEN(%) 87.61 95.24
SPEC(%) 98.27 99.2
AUC (%) 92.94 97.22
PREC(%) 92.61 95.87
F1 (%) 90.04 95.56
For comparative purposes, other models were also
used for the same delimitation task they were: ResNet
(He et al., 2015) and the DenseNet (Huang et al.,
2017). ResNet and DenseNet were used to extract
features, then a classification block was added to both
networks, as shown in Table 5.
Table 5: Classification block for the gas region detection
comparison models.
Dense 512 + Relu
Dropout 0.5
Dense 256 + Relu
Dense 2 + Softmax
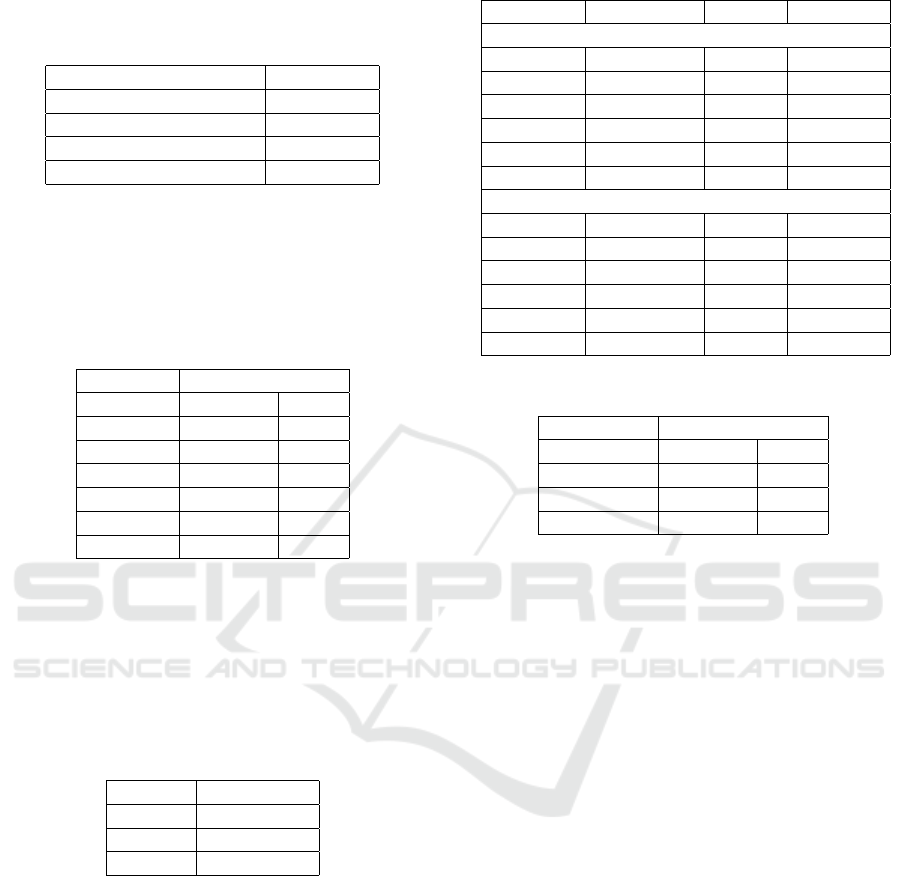
Table 6 presents results for gas region detection
in seismic images with comparison models. As
we can see, the MLP-Mixer achieved the best
gas detection results compared to the ResNet and
DenseNet models. Except for sensitivity and AUC in
the crossline, DenseNet obtained a higher result.
In addition to the results, the MLP-Mixer
presented a significantly superior performance
concerning the training time, as shown in Table 7.
This performance is because the MLP-mixer does
not increase depth (channel) along with the layers, as
with convolutional networks.
The MLP-Mixer proved to be an excellent
classifier for seismic images despite not using
Table 6: Comparison of methods for gas detection.
MLP-Mixer ResNet DenseNet
Crossline
ACC (%) 96.15 90.6 95.54
SEN(%) 87.61 59.94 88.91
SPEC(%) 98.27 98.19 97.18
AUC (%) 92.94 79.07 93.04
PREC(%) 92.61 89.15 88.65
F1 (%) 90.04 71.68 88.78
Inline
ACC (%) 98.55 98 97.03
SEN(%) 95.24 94.15 88.35
SPEC(%) 99.2 98.76 98.74
AUC (%) 97.22 96.45 93.54
PREC(%) 95.87 93.69 93.19
F1 (%) 95.56 93.92 90.71
Table 7: Comparison of models in relation to training time.
Time (min)
Crossline Inline
MLP-Mixer 33 101
ResNet 529 1308
DenseNet 837 2421
convolution and attention mechanisms as the main
models currently. It obtained competitive results in
a much shorter processing time.
3.4 Gas Extension Delimitation
In the delimitation step, we generated two models,
one for the inline lines and another for the crossline
lines. As U-Net is a semantic segmentation network,
we extracted 128x128 patches from the respective gas
and non-gas binary masks for training the models.
After some initial experiments with different
parameters, we set the U-Net training configuration
to 50 epochs with a batch size of 4, the Adam
optimization function with a learning rate of 0.00001,
decay of 0.000001, clipvalue = 0.5, and Dice as a loss
and metric function validation evaluation.
Table 8 presents the final result of the proposed
method. This result is the combination of the
detection step and the delimitation step. The inline
line method presents superior results to the crossline
method in the detection and delimitation step. The
reason is the outstanding amount of training images
for the inline.
Table 9 presents a comparison of the results
in relation to the work of (Santos et al., 2019).
Improvements in accuracy were observed with
99.6% (inline) and 99.55% (crossline); specificity
99.79%(inline), and 99.74%(crossline), showing that
ICEIS 2022 - 24th International Conference on Enterprise Information Systems
582
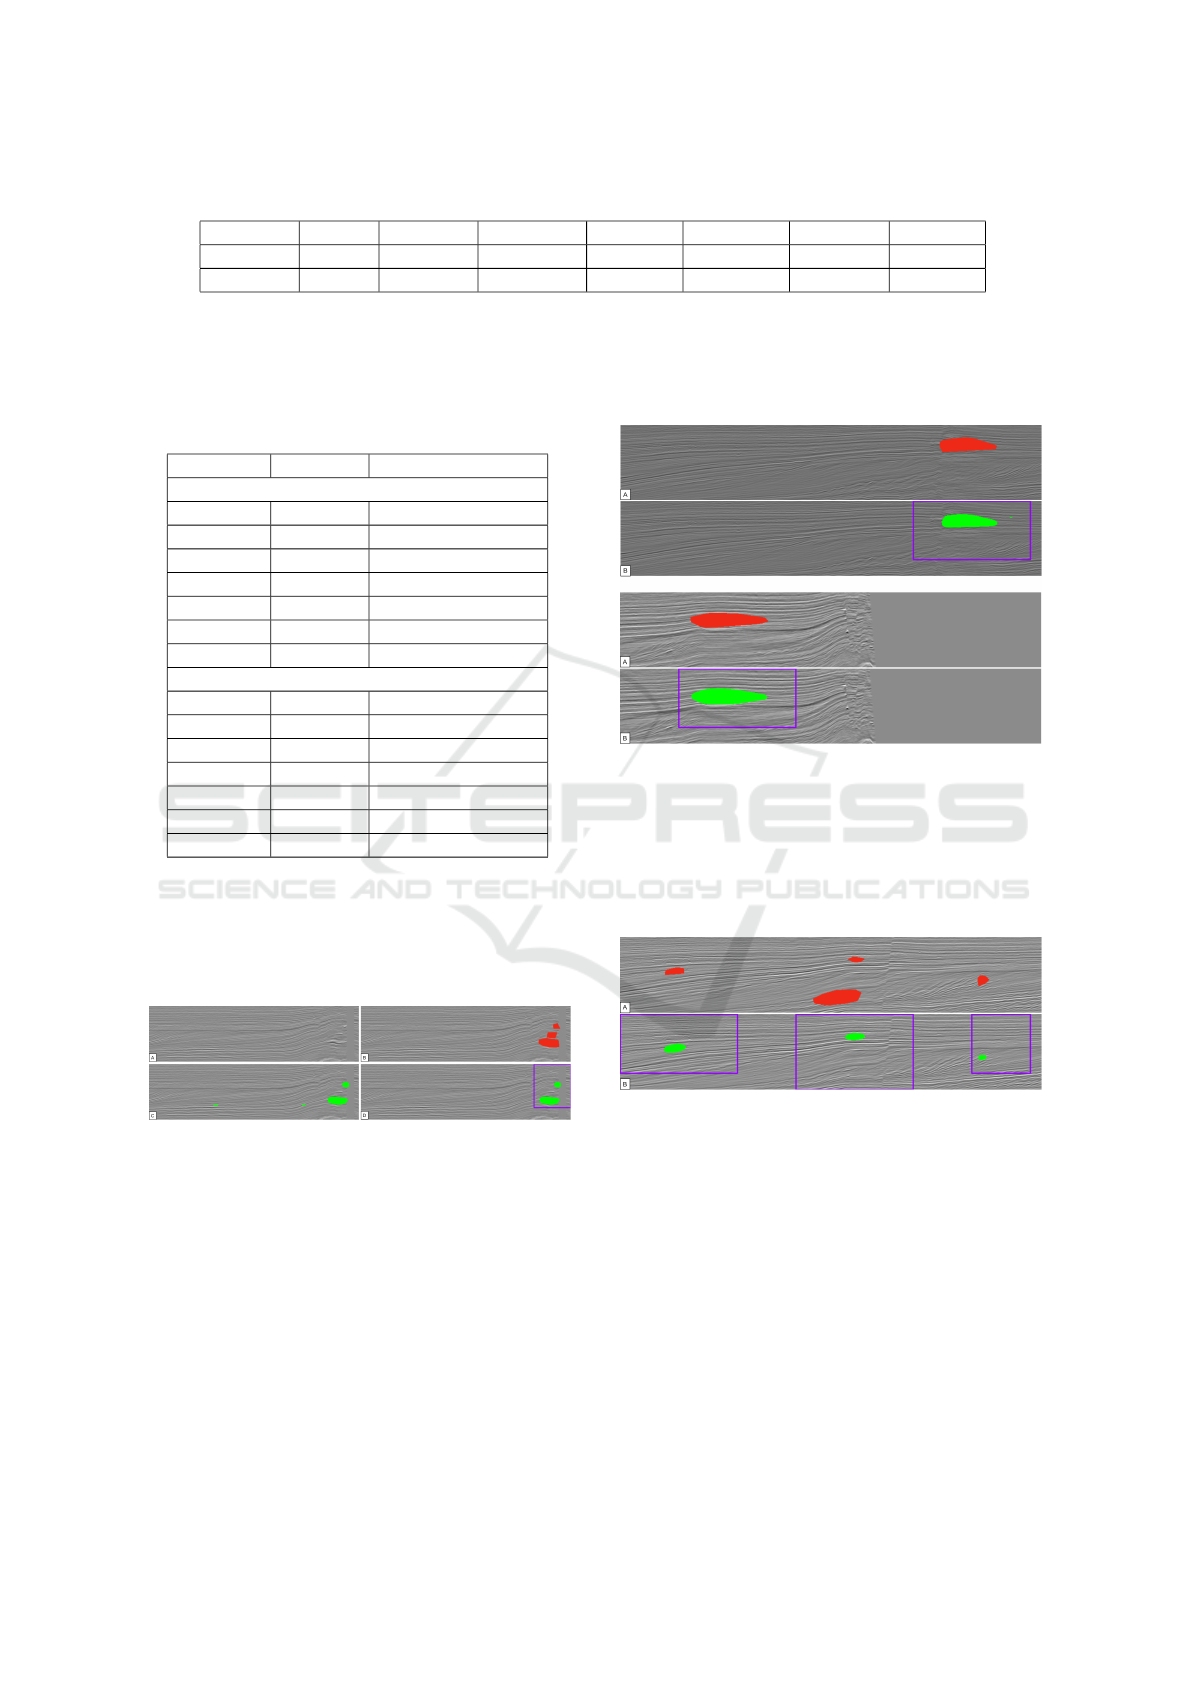
Table 8: Final result of the proposed method.
Base F1 (%) ACC (%) PREC (%) SEN (%) SPEC (%) AUC (%) Dice (%)
Inline 84.18 99.6 84.0 86.85 99.79 93.32 84.18
Crossline 80.3 99.55 80.49 82.74 99.73 91.23 80.3
the proposed model was able to reduce the number of
false positives. However, he could not overcome the
sensitivity.
Table 9: Comparison of the proposed method with another
work in the literature.
Proposed (Santos et al.,2019)
Crossline
F1 (%) 80.3 -
ACC (%) 99.55 96.83
PREC(%) 80.49 -
SEN(%) 82.74 94.77
SPEC(%) 99.73 96.87
AUC (%) 91.23 98.71
Dice (%) 80.3 -
Inline
F1 (%) 84.18 -
ACC (%) 99.6 97.16
PREC(%) 84.0 -
SEN(%) 86.85 97.83
SPEC(%) 99.79 97.15
AUC (%) 93.32 98.8
Dice (%) 84.18 -
Figure 6 presents a case that shows the
contribution of MLP-Mixer in reducing false
positives. As we can see in the picture 6 - C), U-Net
mistakes the prediction of gas in regions similar to
the region of interest.
Figure 6: Crossline 909: A) Input image, B) Specialist
marking, C) Gas extension delimitation isolated prediction
result, D) Proposed model. The expert mark (red), gas
region detection result (purple) and gas range delimitation
result (green).
The approach of (Santos et al., 2019) of working
with seismic trace (1D) has the advance of generating
more data samples. Due to data imbalance, accuracy
alone cannot reflect the method’s performance. The
precision shows that the proposed model could reduce
the number of false positives, and the sensitivity
indicates that the delimitation made by the U-Net
suffered from the number of gas samples.
Next, we will see some examples of the results
of the proposed method. The figure 7 shows the
result where the MLP-Mixer was able to detect the
gas region. And the U-Net precisely segments the gas.
Figure 7: Inline 86 and 597: A) specialist marking; B)
Prediction result for the proposed method. Result of
gas region detection (purple) and result of gas extension
delimitation (green).
Figure 8 also presents a good result from the
MLP-Mixer, but with the difference that there are
false negatives in the U-Net prediction.
Figure 8: Inline 221: A) specialist marking; B) Prediction
result for the proposed method. Result of gas region
detection (purple) and result of gas extension delimitation
(green).
Figure 9 presents a result where the MLP-Mixer
was able to detect the gas region. And the U-Net
precisely segments the gas.
Figure 8 also presents a good result from the
MLP-Mixer, but with the difference that there are
false negatives in the U-Net prediction.
Detection and Delimitation of Natural Gas in Seismic Images using MLP-Mixer and U-Net
583
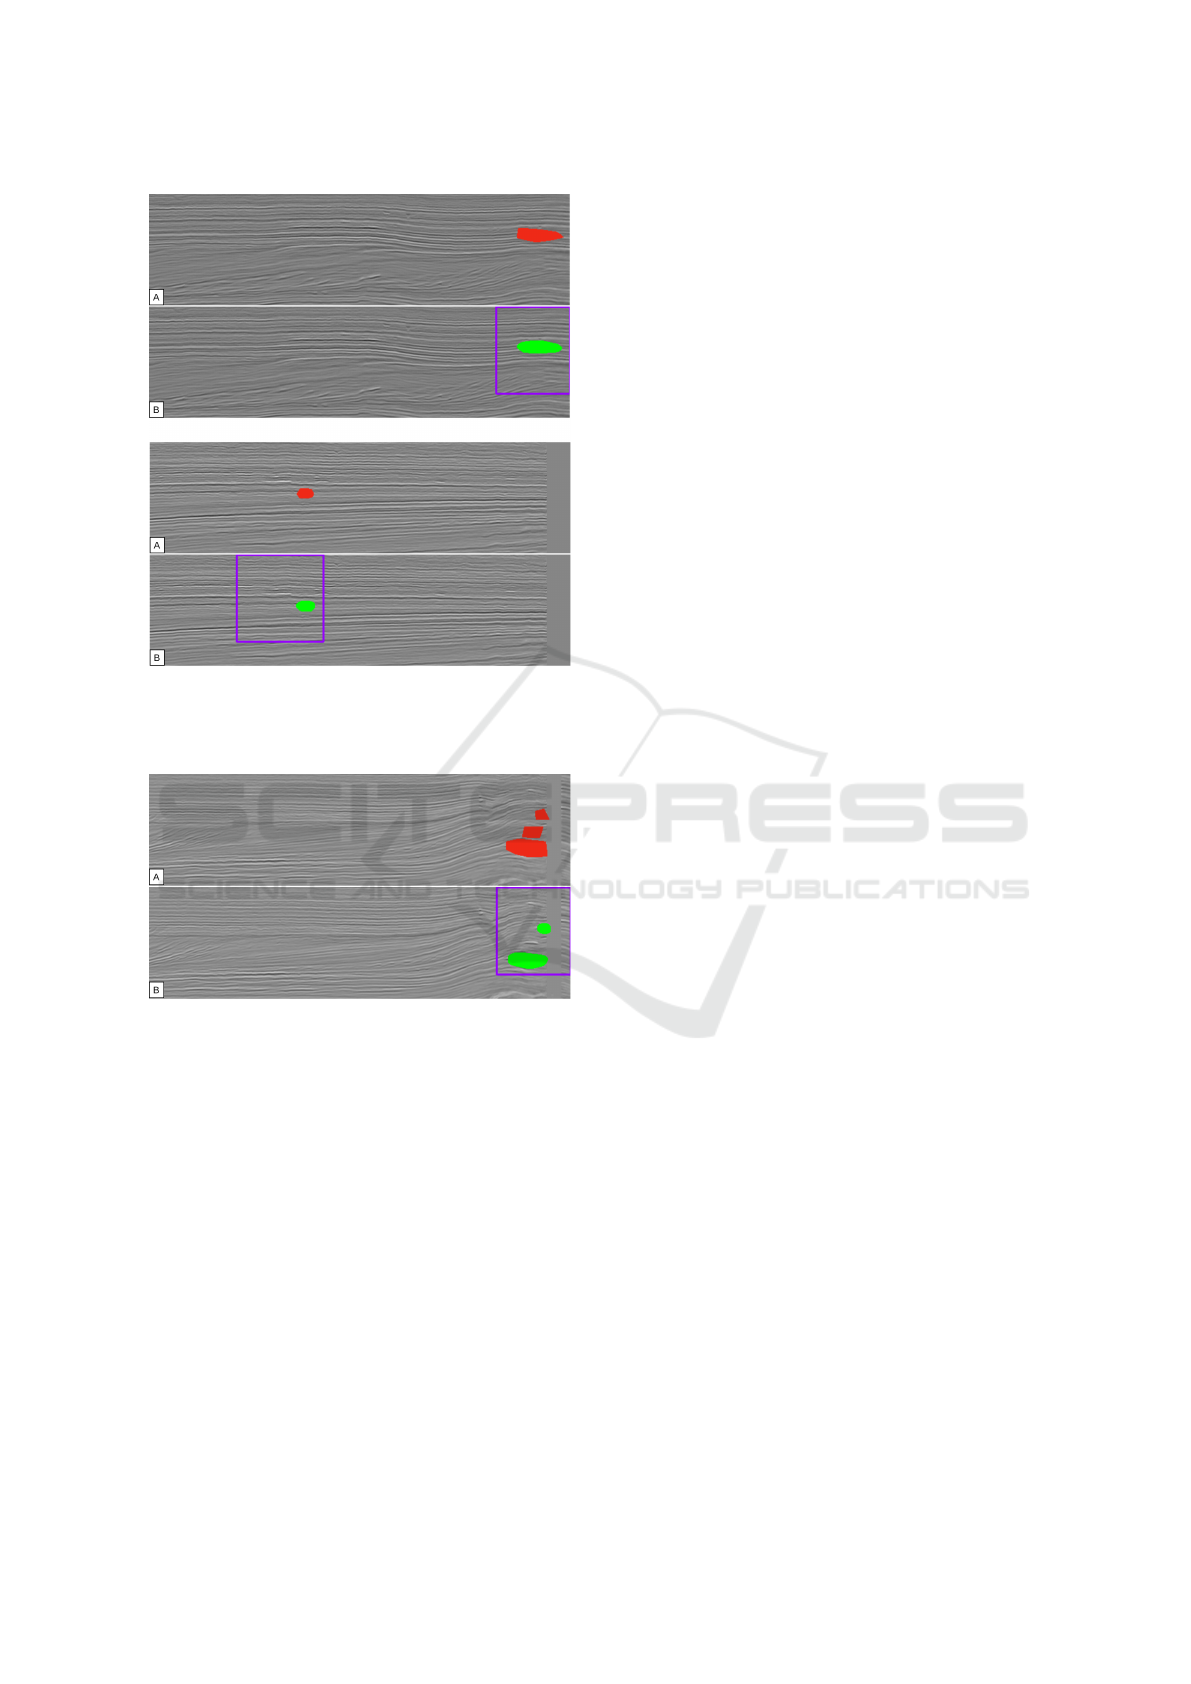
Figure 9: Crossline 511 and 100: A) specialist marking;
B) Prediction result for the proposed method. Result of
gas region detection (purple) and result of gas extension
delimitation (green).
Figure 10: Crossline 909: A) specialist marking; B)
Prediction result for the proposed method. Result of
gas region detection (purple) and result of gas extension
delimitation (green).
4 CONCLUSIONS
Due to its characteristics and the limited availability
of public data, the automatic detection and
delimitation of natural gas in seismic images
is a difficult task. Gas occurrences have different
locations and sizes, in addition to having a lot of noise
that is derived from the acquisition process. These
characteristics make the detection and delimitation
process challenging since this location is difficult,
even with the naked eye by the specialist.
The MLP-Mixer was very important to the method
in the gas detection regions. It managed to perform
well in the classification of regions and, consequently,
contributed to the delimitation of gas only in the
correct regions. The delimitation is a more difficult
task, but even so, U-Net managed to have a relevant
performance considering the imbalance of the gas and
non-gas areas.
In general, the results for detection and
delimitation of regions and gas were promising,
achieving advances in accuracy with 99.6% (inline)
and 99.55% (crossline); specificity 99.79% (inline)
and 99.74% (crossline), compared to related work.
As future work, we identified the need to:
1) Use transfer learning techniques, since seismic
data are scarce, deep learning models are sensitive
to the amount of data and data increase had
little contribution in experimental tests; 2) Use
other semantic segmentation techniques for gas
delimitation available in the literature; 3) And, finally,
the use of seismic bases from other regions to test the
generalization of the proposed model.
ACKNOWLEDGEMENTS
We thank the Conselho Nacional de Desenvolvimento
Cient
´
ıfico e Tecnol
´
ogico (CNPq), the Coordenac¸
˜
ao
de Aperfeic¸oamento de Pessoal de N
´
ıvel Superior
(CAPES), the N
´
ucleo de Computac¸
˜
ao Aplicada da
Universidade Federal do Maranh
˜
ao (NCA), and the
Tecgraf Institute (PUC-Rio) for their support to the
research.
REFERENCES
Benjamin-Etheredge (2021). mlp-mixer-keras. https://
github.com/Benjamin-Etheredge/mlp-mixer-keras0.
Cox, M. (1999). Static corrections for seismic reflection
surveys. Society of Exploration Geophysicists.
El Zini, J., Rizk, Y., and Awad, M. (2019). A deep transfer
learning framework for seismic data analysis: A case
study on bright spot detection. IEEE Transactions on
Geoscience and Remote Sensing.
He, K., Zhang, X., Ren, S., and Sun, J. (2015). Deep
residual learning for image recognition. CoRR,
abs/1512.03385.
Huang, G., Liu, Z., Van Der Maaten, L., and Weinberger,
K. Q. (2017). Densely connected convolutional
networks. In Proceedings of the IEEE conference on
computer vision and pattern recognition, pages 4700–
4708.
Nubis, T. (1987). Project f3 demo 2020.
Patel, D., Giertsen, C., Thurmond, J., Gjelberg, J., and
Grøller, E. (2008). The seismic analyzer: Interpreting
and illustrating 2d seismic data. IEEE Transactions on
ICEIS 2022 - 24th International Conference on Enterprise Information Systems
584

Visualization and Computer Graphics, 14(6):1571–
1578.
Rizk, Y., Partamian, H., and Awad, M. (2017). Toward real-
time seismic feature analysis for bright spot detection:
a distributed approach. IEEE Journal of Selected
Topics in Applied Earth Observations and Remote
Sensing, 11(1):322–331.
Ronneberger, O., Fischer, P., and Brox, T. (2015). U-
net: Convolutional networks for biomedical image
segmentation. In International Conference on
Medical image computing and computer-assisted
intervention, pages 234–241. Springer.
Santos, L. F., Silva, R. M. G. E., Gattass, M., and Silva,
A. C. (2019). Direct hydrocarbon indicators based
on long short-term memory neural network. In SEG
Technical Program Expanded Abstracts 2019, pages
2373–2377. Society of Exploration Geophysicists.
Schlumberger (2021a). Oilfield glossary.
Schlumberger (2021b). Oilfield glossary.
Teixeira, W., Fairchild, T. R., Toledo, M. C. M. d., and
Taioli, F. (2009). Decifrando a terra.
Tolstikhin, I., Houlsby, N., Kolesnikov, A., Beyer, L.,
Zhai, X., Unterthiner, T., Yung, J., Steiner, A.,
Keysers, D., Uszkoreit, J., et al. (2021). Mlp-mixer:
An all-mlp architecture for vision. arXiv preprint
arXiv:2105.01601.
Detection and Delimitation of Natural Gas in Seismic Images using MLP-Mixer and U-Net
585
