
A New Approach for Analyzing Financial Markets using Correlation
Networks and Population Analysis
Zahra Hatami
1 a
, Hesham Ali
1 b
,David Volkman
2 c
and Prasad Chetti
3 d
1
College of Information Science & Technology, University of Nebraska at Omaha,Omaha, U.S.A.
2
College of Business Administration, University of Nebraska at Omaha,Omaha, U.S.A.
3
School of Computer Science & Information Systems,Northwest Missouri State University, Maryville, U.S.A.
Keywords:
Financial Markets, Population Analysis, Network Models.
Abstract:
With the availability of massive data sets associated with stock markets, we now have opportunities to apply
newly developed big data techniques and data-driven methodologies to analyze these complicated markets.
Correlation network analysis makes it possible to structure large data in ways that facilitate finding common
patterns and mine-hidden information. In this study, we developed the population analysis with utilizing a
correlation network model to conduct a study on stock market data on companies for the years 2000 through
2004. We utilized companies’ parameters for behavior assessment based on the population analysis. After
creating the network model, we employed graph-based community algorithms, such as GLay, to identify
communities and stocks with similar features associated with their excess returns. Our analysis of the top
two communities revealed that companies in the finance sector have the highest share in the market, and
companies with a low amount of capitalization have a high excess return, similar to large companies. The
proposed correlation network model and the associated population analysis show that investing in companies
with high capitalization does not always guarantee higher rates of return on investment. Based on the proposed
approach, investors could get similar returns by investing in certain small companies.
1 INTRODUCTION
Investing in stock markets has continued to represent
challenges for many investors around the world. At-
tempting to understand the key aspects of stock mar-
kets, like when to buy or sell stocks or whether stocks
are performing well or poor, remains extremely dif-
ficult. Although many studies have addressed these
issues, they primarily focused on using simple sta-
tistical models. Fundamental analysis and technical
analysis are two ways to analyze stock markets from
a financial perspective (Bettman et al., 2009). The
fundamental analyst is to calculate the stock’s intrin-
sic value with the company’s information, analyze the
financial statements, and compare it with the current
value to make the right decision about buying and
selling the stock of the company. Technical analysis is
applied to find the right time to buy or sell a share by
a
https://orcid.org/0000-0002-6344-4421
b
https://orcid.org/0000-0002-8016-6144
c
https://orcid.org/0000-0002-7988-3517
d
https://orcid.org/0000-0002-3838-5781
observing and analyzing stock price behavior in the
past and using the patterns to predict the future price
movements. Researchers have analyzed the financial
markets from big data analytical perspective using
various computational and statistical methodologies,
including Artificial Intelligence, Machine Learning,
Artificial Neural Networks, Fuzzy Logic, and Support
Vector Machines(Gupta and Dhingra, 2012).
The financial market brings the opportunity for in-
vestors to have access to the large and complex daily
and monthly data. This data can be used by big data
analytical tools, such as network models and corre-
lation analysis. This study aims to use a population
analysis and correlation network model (CNM) ap-
proach to determine the specific sector that dominates
in the stock market. The purpose of applying pop-
ulation analysis is to compare different clusters, or
groups, of stocks with respect to a particular parame-
ter such as companies’ returns, economic sectors, and
companies’ capitalization. The network models allow
researchers to analyze each element in the network
and look for networks’ characteristics and features
that are not possible under traditional approaches.
Hatami, Z., Ali, H., Volkman, D. and Chetti, P.
A New Approach for Analyzing Financial Markets using Correlation Networks and Population Analysis.
DOI: 10.5220/0011073800003179
In Proceedings of the 24th International Conference on Enterprise Information Systems (ICEIS 2022) - Volume 1, pages 569-577
ISBN: 978-989-758-569-2; ISSN: 2184-4992
Copyright
c
2022 by SCITEPRESS – Science and Technology Publications, Lda. All rights reserved
569

The general objective of this research is to demon-
strate how network and community analysis can be
applied to stock market data. We propose to employ
CNM to create a correlation network of companies
based on the time-series data of companies’ excess
returns(ER). After creating a correlation network, we
applied the GLay clustering algorithm, which is a
community detection algorithm(Su et al., 2010), to
obtain a set of companies that have similarities in
their ER. Based on different communities from the
network, we identified the top two communities pro-
duced by the clustering algorithm for further anal-
ysis. We then identified the economic sectors that
dominated the market between the years 2000 through
2004 and also found their relevant capitalization. The
experimental results from the network suggested that,
in the short term, the ER for small-size companies
(low total capitalization) is the same as the large-size
companies. In other words, in order to have more
profit, investors should focus on small size companies
that can bring the same, or more, profit as large size
companies. In this study, we aimed to answer the fol-
lowing questions: What type of companies have the
similar behavior during 2000-2004 based on their ER
and amount of capitalization (Research Question 1:
RQ1), and Does any other factor affect their behav-
ior outside of network analysis (Research Question 2:
RQ2)? The remainder of this paper is organized as
follows. First, we comprise a literature review of re-
lated studies in different disciplines and financial mar-
ket analysis. The following section gives an overview
of correlation networks, graph models, and cluster-
ing analysis. Then, we explain the methodology and
discuss the implementation of the proposed approach.
Next, the experimental results of the study, and lastly,
we present our conclusion and offer recommendations
for future work.
2 LITERATURE REVIEW
Analysis of the network involves the recognition of
which entities are connected to others in a graph.
The entities and how they affect each other are im-
portant in finding the most influential entities in the
network. The strength of the relationships (i.e., the
strength of the edges) can be measured with differ-
ent kinds of correlation coefficients such as Pearson,
Kendall, and Spearman. The coefficient of continu-
ity is always between -1 and 1. A correlation coef-
ficient above 0 means that there is a positive corre-
lation; the closer the coefficient to +1, the stronger
the positive correlation. A correlation coefficient be-
low 0 means that there is a negative correlation be-
tween the two variables, and the closer the number
is to -1, the stronger the negative correlation. Vari-
ous correlation coefficients can be used as measure-
ments depending on the nature of the data that creates
the correlation network. For example, if the data are
normally distributed, the Pearson correlation coeffi-
cient will be used to establish the edges’ connections.
Pearson correlation-based network is an unweighted/
undirected network that constructs and measures the
network using Pearson correlation coefficients.
2.1 Correlation Networks in Various
Disciplines
Different research domains such as social comput-
ing (Hatami et al., 2021), bio-sciences, and civil en-
gineering used correlation networks in their analysis
(Chetti and Ali, 2020; Chetti and Ali, 2019; Cooper
et al., 2019; Dempsey and Ali, 2014; Fuchsberger and
Ali, 2017; Kim et al., 2018; Rastegari et al., 2019).
The theoretical framework behind the correlation net-
works can address different problems in different do-
mains. Another benefit of using the correlation net-
work is extracting hidden information by using ad-
vanced visualization tools such as clustering (Ba-
tushansky et al., 2016). In bio-science, using cluster-
ing methods on the complex network created based on
biological entities could help researchers recognize
active genes associated with various stages of disease
progression(Dempsey et al., 2011). The outcome of
the research could detect different early health condi-
tions in different patients. They also allow researchers
to utilize advanced visualization tools at different
granularity levels(Batushansky et al., 2016; Lancel-
lotta et al., 2018). Recently, researchers used the cor-
relation network in the civil engineering domain in
order to assess the safety, deterioration, and perfor-
mance of bridges and their infrastructures(Chetti and
Ali, 2020; Chetti and Ali, 2019; Fuchsberger and Ali,
2017).
2.2 Correlation Network Model in
Financial Domain
Financial markets have been analyzed by researchers
in the big data domain using different computa-
tional and statistical methodologies, such as Artifi-
cial Intelligence, Machine Learning, Artificial Neu-
ral Networks, Fuzzy Logic and Support Vector Ma-
chines(Gupta and Dhingra, 2012), minimum span-
ning trees (MSTs), and Planar Maximally Filtered
Graph, which is a topological generalization of the
MSTs(Bonanno et al., 2004; Tumminello et al.,
ICEIS 2022 - 24th International Conference on Enterprise Information Systems
570

2007). Financial markets bring the opportunity for in-
vestors to have access to the large and complex daily
and monthly data. This data can be used by big data
analytical tools such as network models and correla-
tion analysis. Correlation network modeling is one of
the computational methods that researchers apply to
the financial/stock market(Bonanno et al., 2004; Chi
et al., 2010; Hatami et al., 2022). The correlation
network in the financial domain can be created based
on different input variables such as prices or compa-
nies’ returns. A correlation network model (CNM)
can be built by assuming that each company/stock is
a node (a vertex) in the graph model, and two nodes
are connected by a directed/undirected edge if and
only if their correlation coefficient is above a partic-
ular threshold (such as 0.75 or above). In(Bonanno
et al., 2004; Chi et al., 2010), researchers established
the networks based on similarities between compa-
nies’ prices. In networks, companies are represented
by nodes, and similarities between companies’ prices
are represented by edges. The result of the study
revealed that finance sector
1
dominated the market
compared to other economic sectors
2
. In other stud-
ies (Chi et al., 2010), researchers established the net-
work as a worldwide network based on a few entities
such as price indices, companies, and stocks. The cor-
relation network analysis brings opportunities to the
researchers to uncover hidden information from the
network. For example, in(Gupta and Dhingra, 2012),
researchers could predict the next day’s events using
time series data in the correlation network using Hid-
den Markov Models to forecast the stock market. The
result of different studies using big data techniques
showed that governments could make use of the re-
sults of correlation networks while making economic
decisions(Kenett et al., 2012).
3 MATERIAL AND METHODS
Different data sets were used in this study. One
set of data was collected from the Center for Re-
search in Security Prices (CRSP). In addition, an-
other data set was collected from the Fama-French
(FF) data library. The CRSP dataset contained a list
of stocks/companies with their monthly information.
After data cleaning and filtering, we looked at com-
panies’ Standard Industrial Classification (SIC), ER,
and total capitalization (TCap) for all available stocks
1
A finance sector is a group of companies that fit into
one of the main categories such as banks and financial ser-
vices
2
Economic Sectors are large groups of the economy that
categorized according to their place in the production chain
in the U.S.. SIC is a code used to group companies
with similar products or services at the end of the re-
porting period. SIC is used to identify companies’
economic sectors. Economic sectors are groups that
are categorized according to their place in the pro-
duction chain. TCap results from the multiplication
of price and number of shares (in 1000s) for each
company. Based on the companies’ capitalization,
the companies’ size will be divided into ten categories
called deciles. In this study, companies that belong to
decile 1-5 are called small-size, and companies that
belong to decile 6-10 are called big-size companies.
ER was obtained by subtracting the return value (a
parameter in the CRSP data set) from the risk-free
value
3
(from the FF data set).
Under population analysis, correlation network
analysis is applied in time-series data in order to find
hidden information when it cannot be found using tra-
ditional approaches (Mi
´
skiewicz, 2012; Hatami et al.,
2022). In this study, cluster analysis was applied on
the network in order to group different companies
whose degree of correlation between two companies
is above a threshold.
After creating the communities/clusters, all the
parameters from CRSP were added to the companies
in each community for further analysis to do cluster
enrichment for that specific community. As the com-
munities are formed with high correlations among the
nodes, we can infer that the overall behavior of the
nodes within each community is the same.
3.1 Data Acquisition and Filtering
Two separate data sets were utilized in this research.
The Center for Research in Security Prices (CRSP)
is a variation of the research-quality stock database,
which contains monthly data of all companies from
1926 to 2018. This data set includes five parame-
ters/variables (Companies’ ID (CUSIP), date, return,
SIC, TCap). Another data set was collected from the
Fama-French (FF) data library. Risk-free was the only
parameter that was used from FF data set. As a major
parameter in this study, ER reflects the overall perfor-
mance of companies based on different factors such
as economic sectors and capitalization. ER values
range between -1 and 2. A value of -1 means 100%
loss, and a value of 2 means 200% gain. To study
the features of the correlation network for companies,
we should first establish the correlation network by
extracting data from different data sets. A network,
represented by a graph, is a collection of nodes and
3
risk-free is the rate of return of a hypothetical invest-
ment with no risk of financial loss over a given period of
time
A New Approach for Analyzing Financial Markets using Correlation Networks and Population Analysis
571

edges, N = (V, E), where each node represents a com-
pany, and an edge between two nodes reflects the re-
lationship between the corresponding companies. We
established the pilot study for the years 2000 to 2004
(inclusively). The reason for selecting these years is
because the 9/11 attacks happened during this period,
and the authors would like to study what sectors of
companies are better to invest in case of having an
unexpected event.
During the time period 2000 to 2004, some com-
panies had not existed for five years, resulting in some
missing data points for those companies. Therefore,
to avoid any biased results for this pilot study, only
companies with all data points for 12 months in these
five years were extracted. At the end of the data fil-
tering, out of 5280 companies, 3427 companies were
extracted for further analysis.
3.2 Population Analysis
The term ”population analysis” in the correlation net-
works analysis refers to comparing the group/cluster
of nodes/companies with respect to various param-
eters. Some parameters may be highly enriched in
one cluster compared to another cluster. Applying a
novel population analysis helps us compare individual
data points with other data points in different clusters
or populations regarding different performance lev-
els. In other words, population analysis allows us to
compare two or more clusters of companies with re-
spect to one or more enriched parameters. The results
of this analysis will allow us to discover the parame-
ters that significantly affect the cluster. For example,
if companies are enriched with company size in one
cluster, then we can recognize other factors related to
the companies for further analysis.
3.3 Correlation Networks and
Community Detection
The correlation network was created based on the ER.
The time-series data of ER for the 3427 companies
was recorded as an input matrix. In the matrix, there
were 60 data points (time-series data of 60 months)
for each company. Since the data set is normally dis-
tributed, we applied the Pearson correlation coeffi-
cient to the ER matrix. In the constructed correla-
tion network, each company as a node (vertex) is con-
nected to another company with an undirected edge if
their correlation coefficient is 0.75 or more and their
significance of correlation is less than or equal to 0.05.
This creates a correlation network with companies as
nodes along with highly correlated companies con-
nected by edges, as shown in Figure 1.
Figure 1: Correlation network of companies’ data between
2000 and 2004.
In this study, due to the high similarity between
companies’ ER, cluster analysis was applied on the
network as a data analysis shortcut tool in order to
group different companies whose degree of correla-
tion between two companies is above a threshold.
Cluster analysis, or clustering, is a process by which
a set of objects can be separated into groups. Each
partition is called a cluster. The members of each
cluster are very similar to each other in terms of their
properties, and, in turn, the similarity between clus-
ters is minimal. In this case, the purpose of cluster-
ing is to assign similar objects into one cluster and
label with object’s membership in the cluster. The
financial market network is one of the most com-
plex networks, which brings significant challenges to
visualization. Creating clusters from this complex
network consumes considerable time and computa-
tional resources, and the results are not always use-
ful. By using a specific topology, we have an op-
portunity to visualize the clusters from the commu-
nity structure. Therefore, for this project, we ap-
plied GLay community structure detection algorithm
(available in Cytoscape(Shannon et al., 2003) tool)
that identified as an efficient layout for very large
networks. GLay community clustering was applied
to the network with all default parameters in Cy-
toscape(Shannon et al., 2003) on the obtained correla-
tion network to produce communities/clusters. GLay
clustering was used since it has the ability for disin-
tegration and could be used for large and complex
networks that contain a large number of nodes and
edges(Su et al., 2010). In this study, from 3427 com-
panies, 2580 companies were involved in the network
based on the above-referenced network criteria. Out
of 2580 companies, 2477 nodes were placed in two
ICEIS 2022 - 24th International Conference on Enterprise Information Systems
572
communities (communities one and two). The subset
of these two large communities are shown in Figure
2 and 3. Hence, communities one and two were con-
sidered for further analysis, and various experiments
were conducted on these two communities.
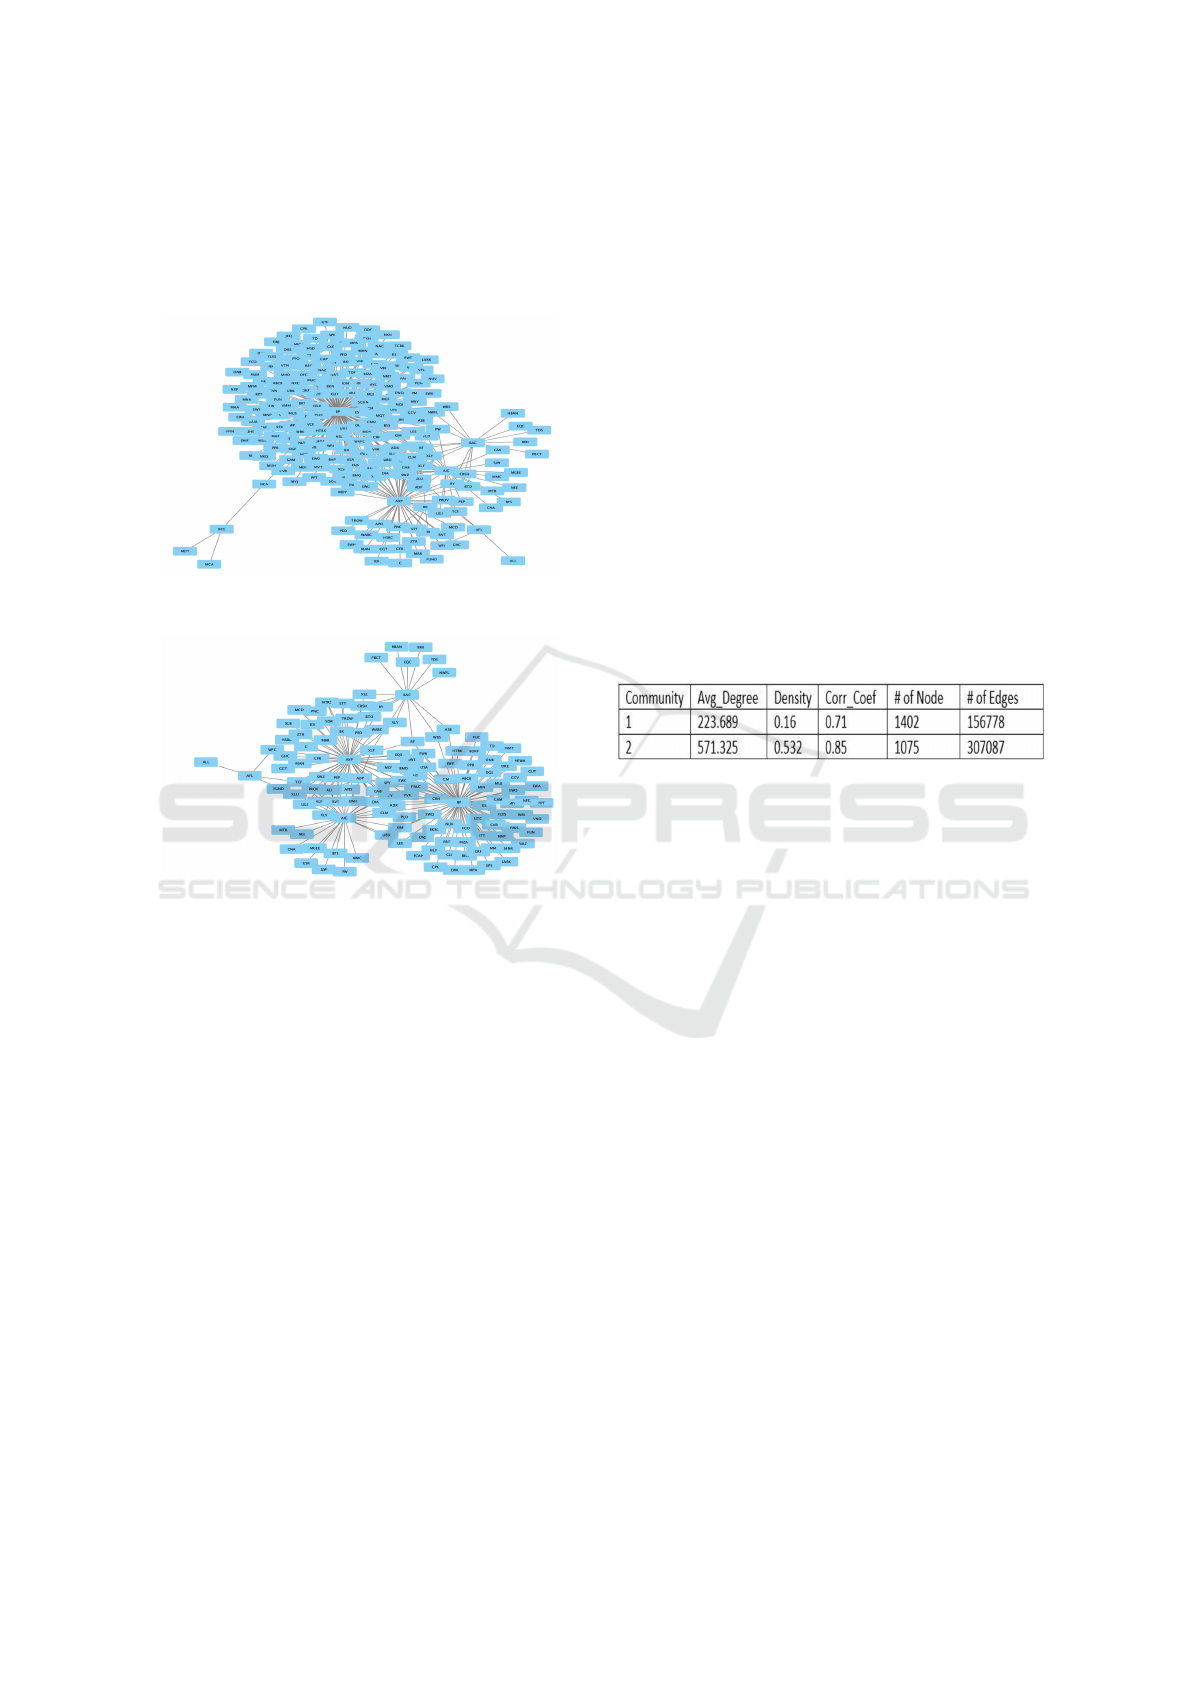
Figure 2: Subset-Community one network with 1402 nodes
and 156778 edges.
Figure 3: Subset-Community two network with 1075 nodes
and 307087 edges.
4 EXPERIMENTAL RESULTS
This section discusses various network properties and
the application of the population analysis on the cor-
relation network.
4.1 Network Properties of the
Communities
The correlation network in Figure 1 represents 3427
companies (nodes) and 657890 relationships (edges).
This network has 25 communities that are formed
with a correlation of 0.75 or greater between edges.
This network is a scale-free network that follows a
power-law node degree distribution. The power-law
degree distribution means there are many nodes with
fewer degrees and fewer number of nodes with more
degrees. Two top communities (with respect to the
number of nodes) were selected from this network,
and the communities’ statistics are shown in Table 1.
Community 1 has 1402 nodes and 156778 edges, and
Community 2 has 1075 nodes and 307087 edges.
Some of the network statistics/properties of the
top two clusters are shown in Table 1. The aver-
age degree of each cluster is the average number of
edges of all nodes.The cluster density describes the
potential number of edges present in the sub-network
compared to the possible number of edges in the sub-
network. The higher the clustering coefficient, the
higher the degree to which nodes in a graph are in-
clined to cluster together(Watts and Strogatz, 1998).
The higher values of the average clustering coefficient
for each cluster/sub-network indicate that the nodes
inside each cluster tend to be part of that cluster only.
Table 1 shows that Community 2 has fewer nodes but
has the highest clustering coefficient of 0.85. Once
again, Community 2 has a higher density (0.532)
compared to Community 1.
Table 1: Network statistics of top two communities.
4.2 Cross-tabulation Properties
In this study, the data set obtained from communi-
ties was analyzed based on various parameters, such
as economic sectors, companies’ capitalization, and
their degrees. Economic sectors are large groups of
the economy, grouped according to their place in the
production chain, by their kind of work (product or
service) or ownership. There are 12 economic sec-
tors in the economic era: consumer staples (NoDur),
consumer discretionary (Durbl), industrial (Manuf),
basic materials (Chems), energy (Energy), informa-
tion technology (BusEq), communications (Telcm),
utility (Util), real estate (Shops), health (Hlth), fi-
nance(Finance), and other(Other).
The degree indicates how many times each com-
pany is connected to other companies based on sim-
ilarities in their ER. According to the degree range
for the companies, we ranked the number of degrees
into five categories. For example, rank one shows de-
grees between 1-200, and rank five shows degrees be-
tween 800-1000. The higher rank means more simi-
larity with other companies within the cluster.
Companies’ capitalization results from the multi-
plication of price and number of shares (in 1000s) for
each company. In the financial domain, a company’s
capitalization is divided into ten categories that are
called deciles. A decile is a quantitative method of
splitting up a set of ranked data into ten equally large
A New Approach for Analyzing Financial Markets using Correlation Networks and Population Analysis
573
subsections
4
. The first category has the lowest, and
the tenth category has the highest amount of capital-
ization.
4.3 Cross-tabulation Results for
Communities One and Two
Since Communities 1 and 2 have the highest num-
ber of companies in their community, in this sec-
tion, we report the result of the cross-tabulation analy-
sis between degree-ranked, capitalization-ranked and
economic sectors for companies belonging to these
communities. In 2000-2004, the finance sector dom-
inated the market with 36%, and consumer discre-
tionary with 2% had the lowest share in the market.
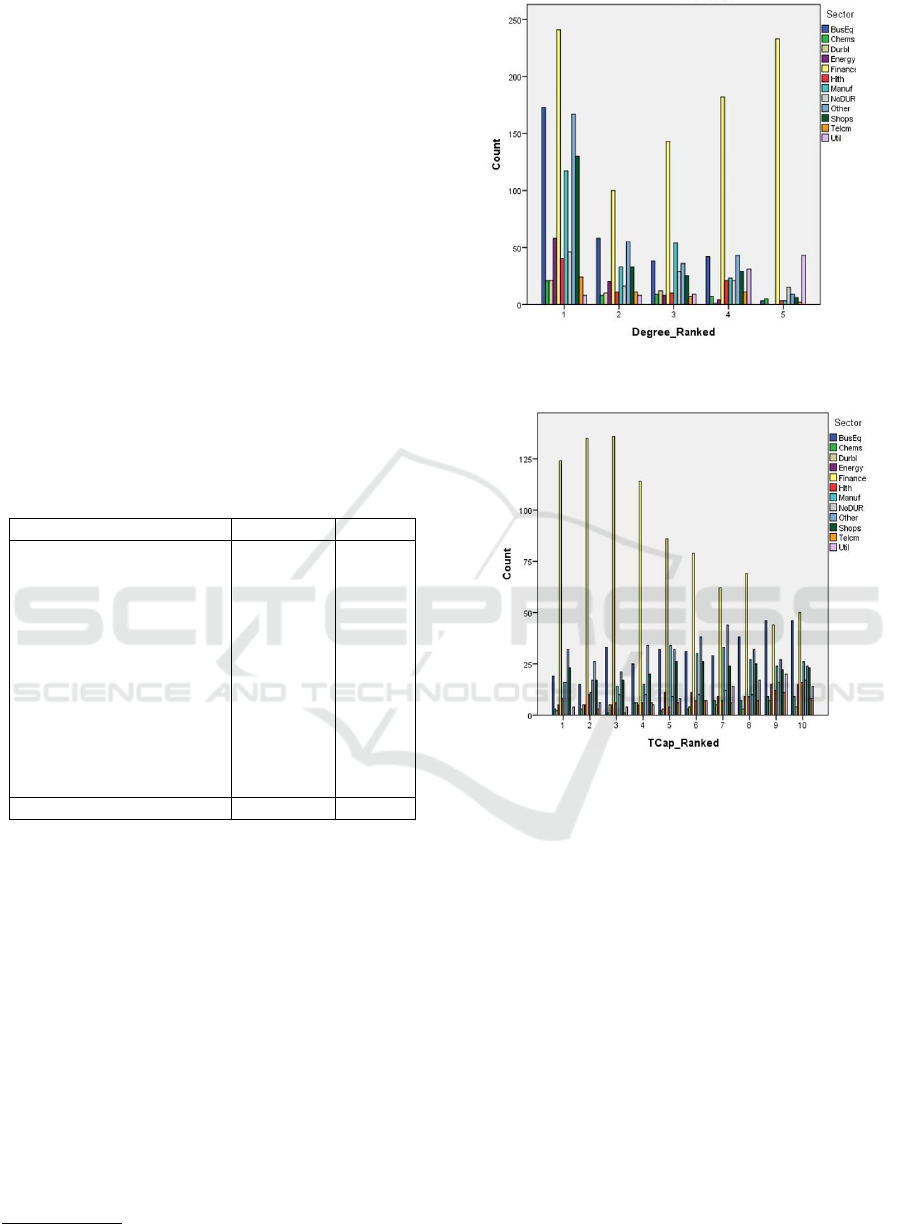
The cross-tabulation analysis shows that, for ranked
degrees one through five, the finance sector had the
highest number of companies in the market followed
by the information technology sector (Table 2 & Fig-
ure 4).
Table 2: Sector statistics for 2526 companies in 2000-2004.
Sector Frequency Percent
Consumer Staples 127 5%
Industrial 230 9%
Energy 90 4%
Basic Materials 50 2%
Information Technology 314 12%
Communications 55 2%
Utility 99 4%
Real Estate 223 9%
Health 85 3%
Finance 899 36%
Consumer Discretionary 44 2%
Other 310 12%
Total 2526 100%
Applying cross-tabulation between economic sec-
tors and capitalization (deciles) shows that companies
belonging to the finance sector for all ten deciles have
the highest share in the market during the time period
2000-2004 (Figure 5).
Finally, a cross-tabulation analysis between
degree-ranked and capitalization shows that the high-
est number of degrees belongs to companies that have
the lowest amount of capitalization (ranked 1-4). In
other words, companies that have a low amount of
capitalization (deciles 1-4) have the most similarity in
their ER with other companies. That means they have
the same ER as other companies considered large
companies (Figure 6).
As a result of this analysis, we can say that com-
panies belonging to the finance sector from 2000 to
4
https://cleartax.in/g/terms/decile
Figure 4: Cross-tabulation between economic sectors and
ranked degrees.
Figure 5: Cross-tabulation between economic sectors and
ranked capitalization in 2000-2004.
2004 have the highest degree of relationship (simi-
larity in their ER) with other companies while they
have the lowest amount of capitalization. Further-
more, based on this analysis, we can say that compa-
nies that have the most similarities in their ER move-
ments compared to others in the community are those
that even have the lowest amounts of capitalization.
4.3.1 Analysis of 50 Randomly Picked
Companies in Community One with
Respect to Input Capitalization and
Economic Sectors
For this part of analysis, we randomly picked the 50
companies in Community 1 as one of the largest com-
munities in the correlation network for analyzing cap-
italization movements. In this community, 80% of
companies belonged to the finance sector with cap-
italization ranked 1-4, and the remaining 20% were
ICEIS 2022 - 24th International Conference on Enterprise Information Systems
574
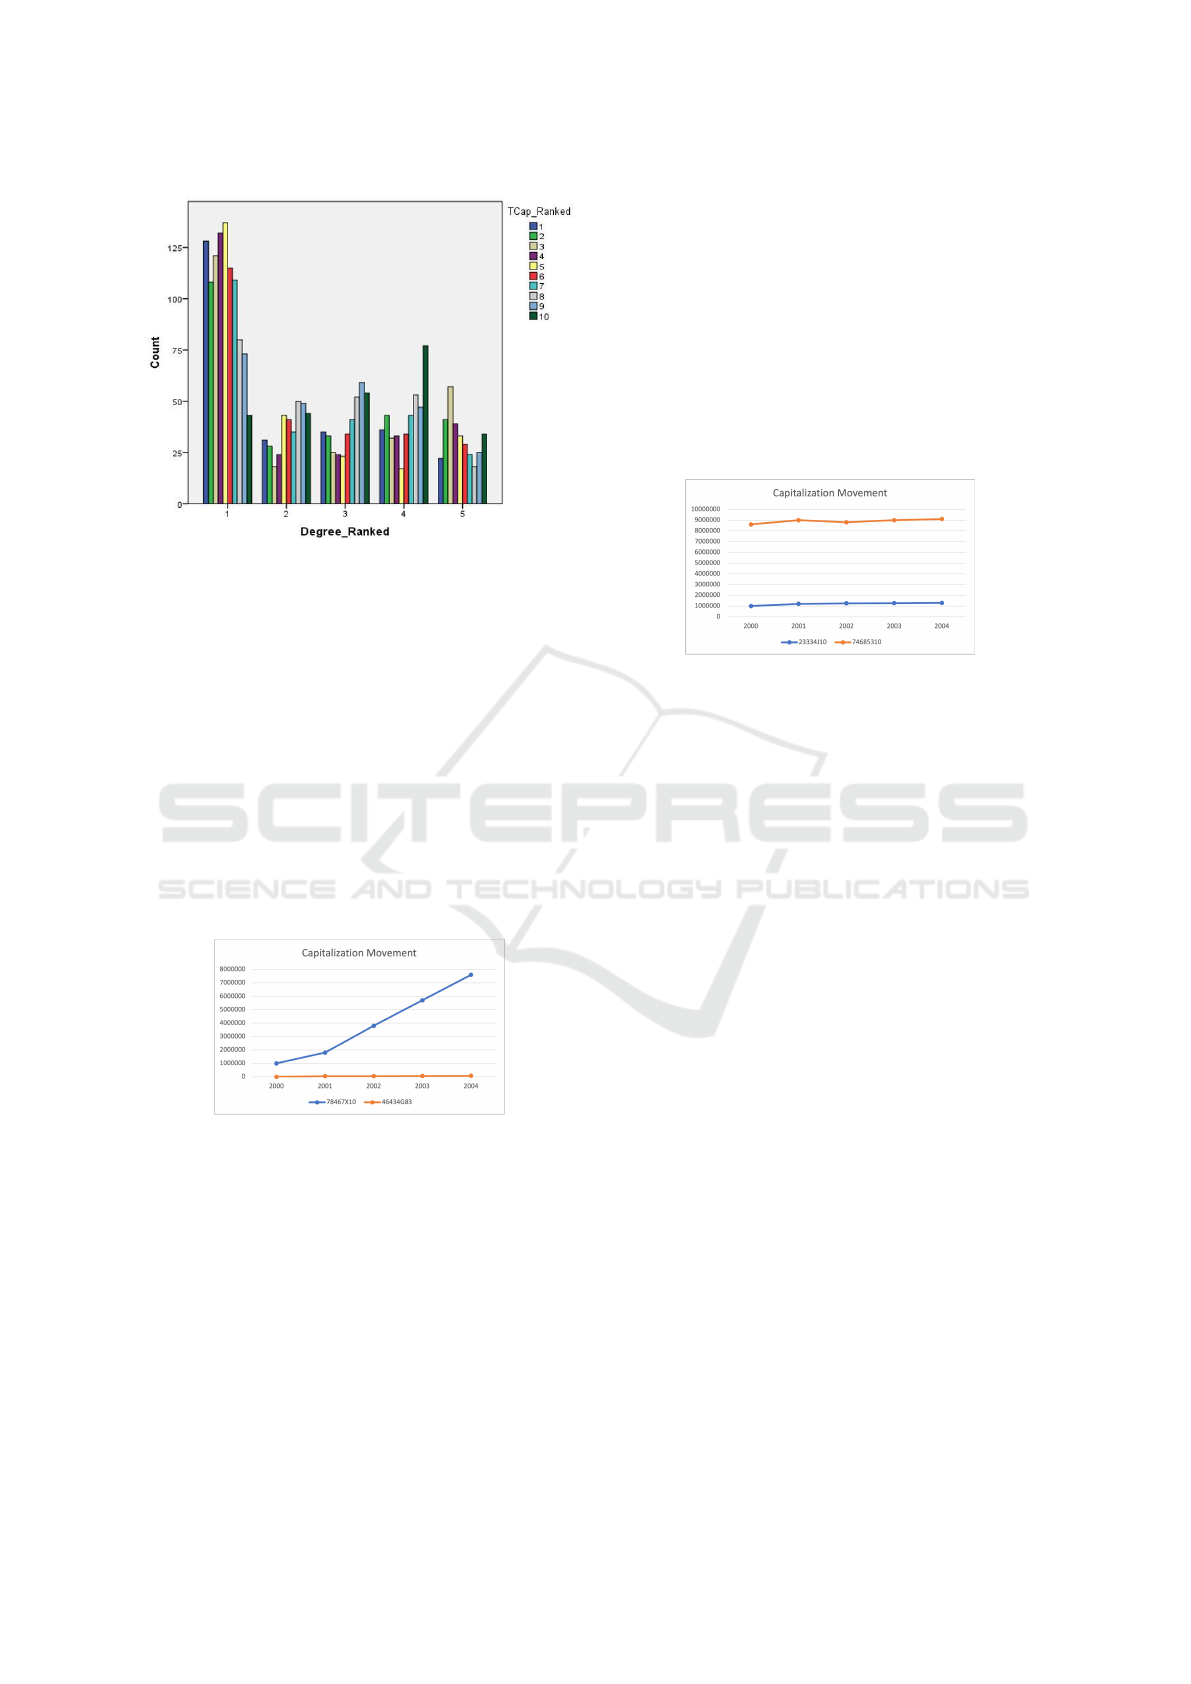
Figure 6: Cross-tabulation between ranked degree and
ranked capitalization in 2000-2004.
companies belonging to other economic sectors.
As another comparison in Community 1, we com-
pared the behavior of one high degree and one low
degree company in the finance sector. The company
ID ”46434G83” belonged to the highest-degree com-
pany and the company ID ”78467X10” belonged to
the lowest-degree company. Tracking their capitaliza-
tion showed that company 46434G83, belongs to the
lowest-ranked capitalization decile (decile 2), while it
has the most similarity in its ER compared to com-
pany 78467X10 as one of the largest size companies
in the market (decile 9). Figure 7 shows the capital-
ization trend for these two companies in the finance
sector in Community 1 during 2000-2004.
Figure 7: Comparison of average capitalization val-
ues of two companies from Community one in 2000-
2004(Horizontal axis stands for ”year” and vertical axis is
”amount of capitalization”).
4.3.2 Analysis of 50 Randomly Picked
Companies in Community Two with
Respect to Input Capitalization and
Economic Sectors
We applied the same analysis procedure on the next
largest community (Community 2), and again, 50
companies were randomly picked. In this community,
96% of companies are in the finance sector, and from
this 96%, 69% belong to capitalization rank of 1-4.
As another comparison in Community 2, we com-
pared the behavior of one high-degree and one low-
degree company in the finance sector. The com-
pany with CUSIP ”23334J10” and the company
with CUSIP ”74685310” were selected. Tracking
their capitalization showed that company 23334J10
belongs to the lowest-ranked capitalization decile
(decile 3), while it has the most similarity in its ER
compared to company 74685310 as one of the largest
sized companies in the market (decile 7). Figure 8
shows the capitalization trend for these two compa-
nies in the finance sector in Community 2.
Figure 8: Comparison of average capitalization values of
two companies from Community two in 2000-2004 (Hori-
zontal axis stands for ”year” and vertical axis is ”amount of
capitalization”).
5 CONCLUSION
With the growing availability of financial data, new
approaches are needed to take full advantage of such
data and provide investors insightful knowledge about
the behavior of companies in the financial markets.
This research proposes a new approach for analyz-
ing financial markets and extracting useful informa-
tion from the large amount of financial data. Due to
the complexity of financial market data, the proposed
approach that utilizes the concept of population anal-
ysis and correlation networks, along with associated
enrichment analysis, allowed us to identify behavioral
patterns of the financial market that are difficult to
identify using traditional approaches.
To test our proposed approach, we conducted a
case study on the stock market data of the United
States for the years 2000-2004. We proposed a cor-
relation network model along with population analy-
sis to conduct the study. We constructed a correla-
tion network based on companies’ ER. After creating
the network and applying clustering algorithms, we
extracted the top two communities and analyzed the
associated companies. We collected various relevant
information about the companies, such as the amount
of their capitalization and economic sectors. Based
on the clustering analysis, we found that companies
in finance sectors have the highest share in the market
A New Approach for Analyzing Financial Markets using Correlation Networks and Population Analysis
575

as compared to other sectors. We also showed that
companies in the finance sector have similarities in
their ER movements as to that of big-size companies,
even though they mostly had the lowest capitalization.
Based on the obtained results, it can be concluded that
investment in a small company with low capitaliza-
tion in the finance sector, even during the crises, may
yield a higher return than investment in large compa-
nies. From 2000 to 2004, companies in the finance
sector kept their consistency with low capitalization
and got the same ER as big companies with high cap-
italization (RQ1). Using the population analysis, we
did not find any parameters outside network charac-
teristics that significantly affected the behavior of the
companies under study (RQ2).
The proposed model and the reported results rep-
resent a starting point for a new direction in analyz-
ing financial markets. The results show the viabil-
ity of this new approach. However, additional studies
with larger and more diverse data sets are necessary
to make a case for utilizing the concept of population
analysis in making important financial decisions. The
limitation of this study is that we analyzed the market
for a limited sample during the 2000-2004 time pe-
riod. To further validate the obtained results, we plan
to conduct a more comprehensive study using the pro-
posed approach for different time periods and utiliz-
ing different types of data sets. We intend to apply
the concept of population analysis on different sets of
data tied to independently-established major crises in
order to recognize the patterns that may be otherwise
obfuscated. In addition to ER, future studies also in-
clude exploring other indicators such as different eco-
nomic sectors and companies’ sizes for comparing the
behavior of companies in financial markets.
REFERENCES
Batushansky, A., Toubiana, D., and Fait, A. (2016).
Correlation-based network generation, visualization,
and analysis as a powerful tool in biological studies:
a case study in cancer cell metabolism. BioMed re-
search international, 2016.
Bettman, J. L., Sault, S. J., and Schultz, E. L. (2009). Fun-
damental and technical analysis: substitutes or com-
plements? Accounting & Finance, 49(1):21–36.
Bonanno, G., Caldarelli, G., Lillo, F., Micciche, S., Vande-
walle, N., and Mantegna, R. N. (2004). Networks of
equities in financial markets. The European Physical
Journal B, 38(2):363–371.
Chetti, P. and Ali, H. (2019). Analyzing the structural health
of civil infrastructures using correlation networks and
population analysis. In Proceedings of the Eighth In-
ternational Conference on Data Analytics, pages 12–
19.
Chetti, P. and Ali, H. (2020). Estimating the inspection
frequencies of civil infrastructures using correlation
networks and population analysis. International Jour-
nal on Advances in Intelligent Systems, 13(1&2):125–
136.
Chi, K. T., Liu, J., and Lau, F. C. (2010). A network per-
spective of the stock market. Journal of Empirical
Finance, 17(4):659–667.
Cooper, K., Hassan, W., and Ali, H. (2019). Identification
of temporal network changes in short-course gene ex-
pression from c. elegans reveals structural volatility.
International Journal of Computational Biology and
Drug Design, 12(2):171–188.
Dempsey, K., Thapa, I., Bastola, D., and Ali, H. (2011).
Identifying modular function via edge annotation in
gene correlation networks using gene ontology search.
In 2011 IEEE International Conference on Bioinfor-
matics and Biomedicine Workshops (BIBMW), pages
255–261. IEEE.
Dempsey, K. M. and Ali, H. H. (2014). Identifying aging-
related genes in mouse hippocampus using gateway
nodes. BMC systems biology, 8(1):62.
Fuchsberger, A. and Ali, H. (2017). A correlation network
model for structural health monitoring and analyzing
safety issues in civil infrastructures. In Proceedings of
the 50th Hawaii International Conference on System
Sciences.
Gupta, A. and Dhingra, B. (2012). Stock market predic-
tion using hidden markov models. In 2012 Students
Conference on Engineering and Systems, pages 1–4.
IEEE.
Hatami, Z., Chetti, P., Ali, H., and Volkman, D. (2022).
A novel population analysis approach for analyzing
financial markets under crises – 2008 economic crash
and covid-19 pandemic.
Hatami, Z., Hall, M., and Thorne, N. (2021). Identifying
early opinion leaders on covid-19 on twitter. In In-
ternational Conference on Human-Computer Interac-
tion, pages 280–297. Springer.
Kenett, D. Y., Preis, T., Gur-Gershgoren, G., and Ben-
Jacob, E. (2012). Dependency network and node in-
fluence: Application to the study of financial mar-
kets. International Journal of Bifurcation and Chaos,
22(07):1250181.
Kim, S., Thapa, I., and Ali, H. H. (2018). A graph-theoretic
approach for identifying bacterial inter-correlations
and functional pathways in microbiome data. In 2018
IEEE International Conference on Bioinformatics and
Biomedicine (BIBM), pages 405–411. IEEE.
Lancellotta, P. I., Str
¨
oele, V., Braga, R. M., David, J. M. N.,
and Campos, F. (2018). Semantic analysis and com-
plex networks as conjugated techniques supporting
decision making. In ICEIS (2), pages 195–202.
Mi
´
skiewicz, J. (2012). Analysis of time series correlation.
the choice of distance metrics and network structure.
Acta Phys. Pol. A, 121:B–89.
Rastegari, E., Azizian, S., and Ali, H. (2019). Machine
learning and similarity network approaches to support
automatic classification of parkinson’s diseases using
accelerometer-based gait analysis. In Proceedings of
ICEIS 2022 - 24th International Conference on Enterprise Information Systems
576

the 52nd Hawaii International Conference on System
Sciences.
Shannon, P., Markiel, A., Ozier, O., Baliga, N. S., Wang,
J. T., Ramage, D., Amin, N., Schwikowski, B., and
Ideker, T. (2003). Cytoscape: a software environment
for integrated models of biomolecular interaction net-
works. Genome research, 13(11):2498–2504.
Su, G., Kuchinsky, A., Morris, J. H., States, D. J., and
Meng, F. (2010). Glay: community structure analysis
of biological networks. Bioinformatics, 26(24):3135–
3137.
Tumminello, M., Di Matteo, T., Aste, T., and Mantegna,
R. N. (2007). Correlation based networks of equity
returns sampled at different time horizons. The Euro-
pean Physical Journal B, 55(2):209–217.
Watts, D. J. and Strogatz, S. H. (1998). Collective dynam-
ics of ‘small-world’networks. nature, 393(6684):440–
442.
A New Approach for Analyzing Financial Markets using Correlation Networks and Population Analysis
577
