
Determining the Workload of Driving Scenarios using Ratings
to Support Safety and Usability Assessments
Paul Green
a
University of Michigan Transportation Research Institute (UMTRI), 2901 Baxter Road, Ann Arbor, Michigan, U.S.A.
Keywords: Driving Workload, Driver Workload, Driver Distraction, Vehicle Automation, Takeover Time.
Abstract: How long will it take a driver to take over if the automation fails? Is a particular driver interface too
distracting? How comparable are the workloads from 2 studies that involve different roads and traffic? The
answer to these driving safety related questions depends upon the workload drivers experience, which should
be calculable from data or descriptions of road geometry and traffic.
For this purpose, 24 subjects rated the workload of 200 driving scenarios on a 0 to 100 scale. Those scenarios
were combinations of road type (urban, rural, expressways, residential streets), traffic, road geometry, the
lane driven, and other factors (e.g., 4-lane, straight rural road with 8-foot paved shoulder and 8-foot grass strip
beyond that).
Finding 1: Those ratings were found to be reliable and well correlated (r=0.75) with ratings collected using
the anchored-clip rating method. Finding 2: Workload was predicted by an additive model that used a table
of values provided herein. (For example, for urban roads, add 9 points to the base rating for heavy traffic, but
12 points for expressways.) In fact, traffic consistently had the largest effect on workload ratings, with the
difference between no traffic and heavy traffic being 50 %.
1 INTRODUCTION
1.1 Driving Workload Is a Topic
Central to Those Studying Driving
The issue of how much workload is too much for a
driver has been a persistent and important issue for
decades. Drivers can respond to high workload in
several ways.
They can shed load. This could mean they stop
paying attention to in-vehicle tasks or stop
paying attention to some external tasks, such
as scanning mirrors.
They can reduce the quality of performance,
such as allowing their control over steering to
degrade.
They can allocate tasks to others. “Here, you
steer while I operate the foot pedals.”
However, task allocation invariably requires
communication and coordination, which can
add workload.
a
https://orcid.org/0000-0002-1864-3931
Whatever the solution is to reduce overload, there
are invariably negative safety consequences.
Research interest in driving workload has been in
3 phases. The first phase of research was associated
with fundamental issues of highway design, for
example, the difficulty of driving a horizontal curve
of some radius or reading 1 or more road signs over
some distance (e.g., Messer, 1980).
The second phase was associated with driver
distraction related primarily to interior tasks (e.g.,
Green, 2010; Elwart, Green, & Lin, 2015) with the
initial concern being navigation systems. These
concerns led to practices such as the NHTSA
guidelines (U.S. Department of Transportation, 2014)
and SAE Recommended Practice J2364 (Society of
Automotive Engineers, 2015) and SAE
Recommended Practice J2365 (Society of
Automotive Engineers, 2016). Curiously, most
distraction guidelines either do not specify the
workload of the primary driving task or assume it is a
single, fixed, and unspecified level.
The third and most recent phase is associated with
automated vehicles and driver takeover from
96
Green, P.
Determining the Workload of Driving Scenarios using Ratings to Support Safety and Usability Assessments.
DOI: 10.5220/0011072200003191
In Proceedings of the 8th International Conference on Vehicle Technology and Intelligent Transport Systems (VEHITS 2022), pages 96-104
ISBN: 978-989-758-573-9; ISSN: 2184-495X
Copyright
c
2022 by SCITEPRESS – Science and Technology Publications, Lda. All rights reserved

automation, often unexpectedly (e.g., Yun, Oh,
Myung, 2019). Surprisingly, most studies do not
control for the workload of the primary driving task,
even though takeover time should depend upon the
scenario in which the driver is taking over.
1.2 There Are Several Measurement
Methods
There is an abundance of research on how to measure
the workload of driving. They include:
(1) asking drivers to rate the workload of the
elements of the driving task on a scale such as
the NASA Task Loading Index (TLX, Hart &
Staveland, 1988; Hart & Wickens, 1990; Hart,
2006),
(2) measuring the physical response of drivers to
driving, using measures such as heart rate (e.g.,
Taggart & Gibbons, 1967; Backs, Lenneman,
Wetzel & Green, 2004) and heart rate variability
(e.g., Meseguer, Calafate, & Cano, 2018) or skin
conductance (e.g., Reimer, Mehler, Coughlin,
Godfrey, & Tan, 2009),
(3) measuring primary task performance such as
lane variability (e.g., Green, Cullinane, Zylstra,
& Smith, 2004) or steering wheel motions (e.g.,
Macdonald & Hoffmann, 1980),
(4) measuring secondary task performance such as
the n-back task (e.g., Mehler, Reimer, & Dusek,
2011) or the peripheral detection task (e.g.,
Jahn, Oehme, Krems, & Gelau, 2005), and
finally,
(5) measuring how much people need to see when
they drive, such as the visual occlusion task
(e.g., Senders, Kristofferson, Levison, Dietrich,
Ward, 1967; Kujala, Kircher, & Ahlström,
2021). Each method has its own strengths and
weaknesses.
In contrast, there is a shortage of research that
allows one to estimate workload for a particular
driving situation. The key factors that affect driving
workload have been well identified -- traffic, road
geometry, sight distance, surface coefficient of
friction, and other factors. Some studies of this topic
even provide equations to estimate workload (e.g.,
Hulse, Dingus, Fischer, Wierwille, 1989; Piechulla,
Mayser, Gehrke, & König, 2003). Also informative,
are related efforts to predict crashes, and those factors
should be linked to workload (e.g., Karlaftis &
Golias, 2002; Abdel-Aty, Keller, & Brady, 2005).
However, what is lacking is research to develop
broadly applicable equations to calculate driving
workload.
1.3 Green’s Anchored Rating Method
Provides Repeatable Workload
Measurements
At the University of Michigan Transportation
Research Institute (UMTRI), research has been
conducted over 20 plus years on improved measures
of workload and quantifying and calculating the
workload of driving based on road geometry, traffic,
sight distance, and the surface coefficient of friction.
Examples include Wooldridge, Bauer, Green, &
Fitzpatrick (2000), Tsimhoni, Green, & Watanabe
(2001), Schweitzer & Green (2006), Lin, Green,
Kang, & Lo (2012), Liu, Green, & Liu (2019), and
Green (2022).
This paper describes the second part of a 2-part
experiment in that UMTRI effort and is an extension
of work reported in Schweitzer and Green (2006) and
Green (2022). In the first part of the experiment,
reported in the publications previously cited, 24
subjects in a driving simulator rated the workload of
driving in scenes shown on video clips relative to 2
anchor clips (with values of 2 to 6, Figure 1).
Figure 1: Screen Showing Anchor Clips.
Included in the set examined were rural (2 lane)
and urban (4 lane) roads, which could either be
straight or curved and had 3 Levels of Service (A, C,
E). Also examined were expressways which were
straight and either with or without merging traffic.
For expressways with 3 lanes in each direction, the
same 3 Levels of Service were examined, as well as
the lane in which subjects were driving (left, middle,
right).
Note: Level of Service is a means to grade the
quality of traffic flow on a road segment.
Grades range from A through F, where A is
excellent and F is failing. For the application
here, each letter grade corresponds to a
specific range of vehicles/lane/hour.
Determining the Workload of Driving Scenarios using Ratings to Support Safety and Usability Assessments
97

The response of a typical subject to 2 clips in
succession would resemble the following. “Ok. This
workload of this clip is in between the 2 examples,
but slightly closer to the lower workload example
clip, so I will call it 3 and a half.” (Note: Subjects
rated workload to the nearest half point.) “For this
next clip, the workload is quite high, greater than the
6. I would call it an 8.”
Two key findings emerged from the first part of
this experiment. First, the ratings were highly
consistent both within and between subjects. If a
subject saw a video clip and rated the workload of
driving that scene, rated another 50 different clips
over a 1-hour period, and then rated the initial clip
again, the second rating would often be within a half
point of the first rating of 1 to 10 range typically used.
There is no evidence that subjects remembered seeing
that clip previously. Furthermore, if 2 clips were from
the same category (e.g., driving on a straight section
of an expressway in the center lane with Level of
Service C), then their ratings were very similar.
Second, there is a very strong relationship
between measures of driving and rated workload,
expressed by several equations. This could be
accomplished because the clips that subjects rated
were collected by an instrumented test vehicle, and
for each clip rated, objective driving measures were
available such as the speed of the subject vehicle, the
gap to the lead vehicle, and others. As an example, in
one of the simpler equations, the mean workload
rating was predicted as follows:
Mean Workload Rating =
8.86 -3.00(LogMnR125) + 0.47(MnTrafficCount)
where:
LogMnR125 = Logarithm of the mean of the
distance in meters to the lead vehicle in the same lane
as the subject averaged over 30 sec. If there was no
vehicle within 125 m, the range of the radar, then the
distance was set to 125 m.
MnTraffficCount = Mean number of vehicles
detected by the subject vehicle radar (15-degree field
of view) averaged over 30 s.
This equation predicted more than 82 % of the
variance in the mean workload ratings for driving on
expressways (exclusive of the right merge situations),
which is extremely high.
1.4 Workload Predictions Were
Needed for a Wider Variety of
Conditions than Were Examined in
Part 1 of the Experiment
Given the success in quantifying workload in the first
part of the experiment, the coverage of workload
estimation equations was expanded to a wider variety
of road types and characteristics, which is the focus
of this paper.
In the first part of the experiment, each clip was
shown twice and 2 clips in the same category were
also shown to each subject. As the repeatability of
measurement method had been well established,
repeated rating of the same or similar scenario did not
occur in part 2 of the experiment.
Furthermore, finding clips in the database that
matched the combination of factors of interest was a
very time consuming task. Given the funding and the
program schedule, there was only time to test each
subject once, with session times of 2 hours or less,
including part 1 of the experiment. Accordingly, a
more efficient planning and data collection method
was explored.
Specifically, part 2 of the experiment addressed
the following 2 issues.
1. Are direct ratings of the workload of driving
based on verbal descriptions correlated with the
highly reliable anchored workload ratings?
2. How do various road characteristics, such as, if
it is hilly or not, or what is on the side of the road
or serves as a boundary, (e.g., shoulder width,
guardrail) affect the direct ratings?
2 METHOD
2.1 In Part 2 of the Experiment
(Reported Here), Subjects Rated
the Workload of Scenarios based
on a Written Descriptions of Them
The same 24 licensed drivers from part 1 (4 men and
4 women in each of 3 age groups, 18-30, 35-55, 65+)
completed a form in which a base use case was
described for each road type (2 lane straight road, 1-
lane paved shoulder on each side, wide grassy
median, no guardrails). For each use case, ratings on
multiple traffic levels (e.g., none, some) were
collected. Subjects rated each use case on a 0 to 100
scale. No anchors were provided. Subsequently,
subjects rated the workload of variations of the base
case (e.g., 3 lanes with center passing left turn lane
instead of 2 lanes). This incremental method was used
so the ratings would be consistent. Included in the 200
combinations rated were all the conditions from part
1, which subjects had seen, but were never described,
to bridge the 2 parts of the experiment.
VEHITS 2022 - 8th International Conference on Vehicle Technology and Intelligent Transport Systems
98
3 FINDINGS
3.1 The Anchored Clip Ratings Could
Be Reliably Estimated from the
Ratings of Written Descriptions
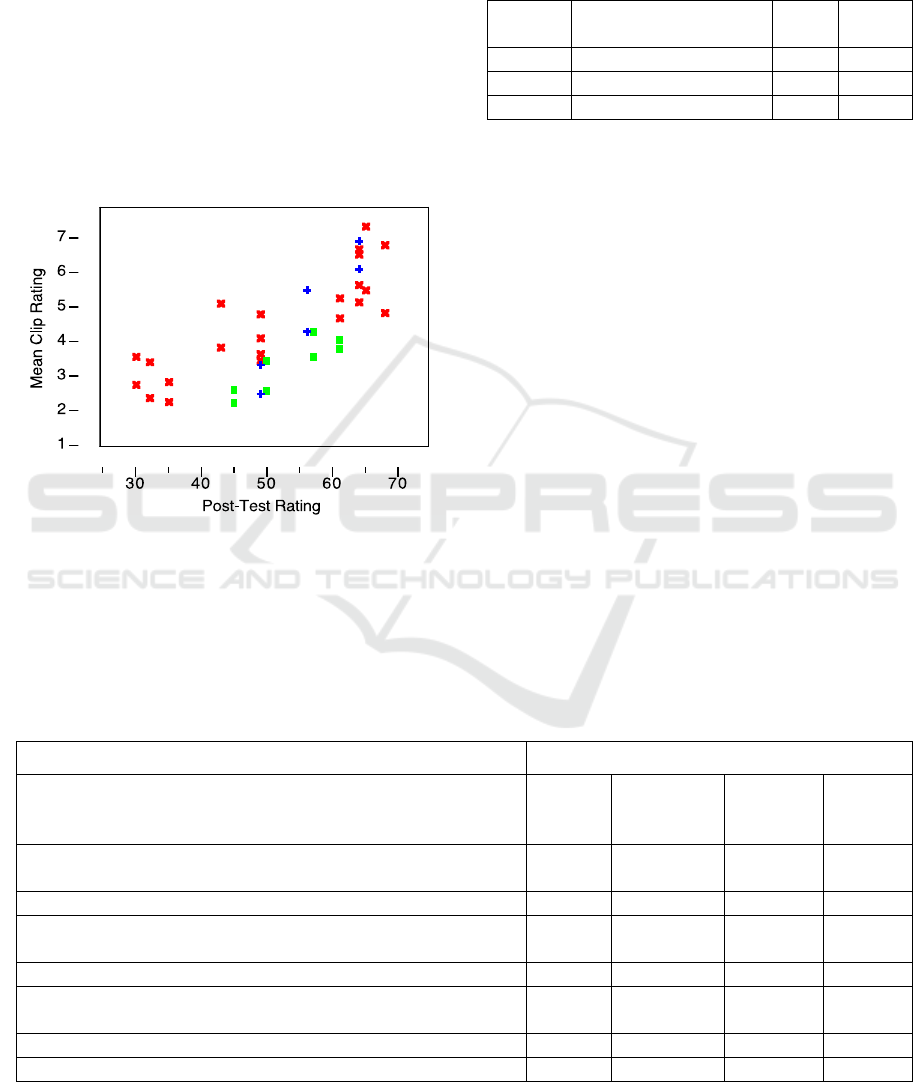
The overall correlation of the 2 sets of ratings was
0.75 (Figure 2). The ratings of the same clips
separated in time (again, by about an hour) was
almost identical (r=0.76), which supports the use of
the method. Bear in mind that in part 1, subjects rated
numerous clips, so they spent a great deal of time
thinking about them.
Figure 2: Correlation of Post-Test Ratings
with Mean Workload (Clip) Ratings.
Note: X=Expressway; box=Rural; +=Urban
To connect the data from part 1 (anchored video
clip ratings) and part 2 (direct ratings of text
descriptions) regression analysis was used (Table 1).
The distributions of the data suggested 3 separate
equations be used, 1 for each road type.
Table 1: Relationships between Anchored Clip Ratings
(part 1) and Direct Ratings (part 2).
Road
Type
Anchored Clip Rating
(from Part 1)
r
2
# Data
Points
X-wa
y
0.0012 +0.090*(DR) 0.73 22
Rural -2.13 + 0.10*(DR) 0.76 8
Urban -8.68 +0.24*(DR) 0.89 6
DR=Direct Rating (0 to 100) from part 2
3.2 Workload Ratings Were Obtained
for a Wide Variety of Conditions on
Rural, Urban and Residential
Roads, and Expressways
Table 2 (on the next page) shows the part 2 ratings for
rural roads, sorted in order of increasing workload.
Those mean ratings varied from 40 to 74 on a 0 to 100
scale. Changing from the base case to a mountain
road increased the rated workload by 50 %.
Narrowing the shoulder to 1 foot (from 8) increased
the workload to a similar level of approaching a stop
sign or traffic light (all changes of roughly 10 points).
According to these data, other changes only altered
the ratings by a few percent.
For urban roads, with ratings varying from 45 to
80 (Table 3, on the next page), the major increases
were associated with going from the base case to a
downtown (about 30% increase) which was similar to
the change from no traffic to heavy traffic. Increases
from no/little traffic to some traffic and some traffic
to heavy traffic were both about 8 points.
Table 2: Mean Part 2 Workload Ratings for Rural Roads.
Scenario
Total # Lanes
2
3 (Center
Pass/Turn
Lane)
4 (in Left
Lane)
Mean
Base case=straight road 8 foot paved shoulder
+ 8 foo
t
g
rass
b
e
y
on
d
tha
t
40 / 54 44 / 56 45 / 57 43 / 56
Base case excep
t
g
entle curves o
r
hill 47 / 59 49 / 60 50 / 61 49 / 60
Base case with 1-foot shoulder, mailboxes, rocks, vegetation
b
e
y
on
d
53 / 62 53 / 64 54 / 64 53 / 63
Base case + a
t
o
r
approachin
g
intersection with traffic li
g
h
t
51 / 62 52 / 63 55 / 64 53 / 63
Base case + at or approaching intersection with a stop sign for
the crossin
g
road onl
y
53 / 62 54 / 65 55 / 67 54 / 65
Base case excep
t
ver
y
curve
d
o
r
hill
y
road (mountain road) 64 / 74 65 / 74 63 / 74 64 / 74
Mean 51 / 62 53 / 64 54 / 65 53 / 63
Note: The 2 values in each cell are for no or little traffic (left) and some traffic (right). The heavy traffic scenario was not
included because if traffic is heavy, there is a reasonable probability the situation is urban.
Determining the Workload of Driving Scenarios using Ratings to Support Safety and Usability Assessments
99

Table 3: Mean Part 2 Workload Ratings for Urban Roads.
Scenario
Total # Lanes
2
3
(Center
Turn)
4
(with Turn
Lane)
5 or More Mean
Base case=straight road, cars parked
on side, no stores, 10 intersect/mi,
most w/ lights, no or few pedestrians
45/53/63 47/54/63 49/56/64 52/61/70 48/56/65
Base case but stores or gas station on
corner
49/57/67 51/58/67 52/59 56/63/73 52/59/69
Base case but numerous stores &
pedestrians (“downtown”), midblock
driveways, no double parking
62/69/76 64/71/78 65/73/81 70/76/84 65/72/80
Mean 52/60/69 54/61/69 55/63/71 59/67/76 55/63/71
Table 4: Mean Part 2 Ratings for 6-Lane Expressways (3 per Direction).
Scenario
Lane Being Driven
Mean
Left Middle Right
Base case = straight road, 1-lane
paved shoulder on each side, wide
grassy median, no guardrails needed
30 / 43 / 63 32 / 49 / 64 35 / 49 / 68 32 / 47 / 65
Base case+ Curved or hilly 45 / 58 / 72 45 / 59 / 70 46 / 59 / 71 45 / 59 / 71
Base case + Interchange
(entrance/exit) in view or at it
40 / 54 / 72 44 / 56 / 73 48 / 61 / 75 44 / 57 / 73
Base case + Lane drop (e.g., 3 to 2
lanes) in your or adjacent lane
50 / 58 / 74 46 / 60 / 73 51 / 62 / 75 49 / 60 / 74
Base case but 3-foot shoulder &
guardrail instead
49 / 61 / 74 47 / 61 / 73 51 / 63 / 79 49 / 62 / 75
Base case + Construction:
Approaching or driving in lane shift
or narrow lanes with concrete
barriers, no shoulder
59 / 69 / 80 60 / 71 / 80 61 / 72 / 82 60 / 70 / 81
Base case + Approach or driving
through crash scene
62 / 69 / 80 61 / 71 / 81 63 / 70 / 81 62 / 70 / 81
Mean 47 / 58 / 73 47 / 61 / 74 51 / 62 / 76 49 / 61 / 74
Note: The 3 values in each cell are no traffic (left), some traffic (middle), heavy (right).
Table 4, on the next page, shows the rating for
expressways, ranging from 30 to 82. The expressway
scenario included the most difficult scenario, driving
through construction in heavy traffic. Interestingly,
this was rated as more demanding than a mountain
road. As a footnote, no details were provided about
the mountain road, in particular, details about drop
offs.
Table 5, on the next page, shows the residential
data, with mean ratings varying from 38 to 64, less
than for other situations. As suburban streets rarely
have traffic, only no or little traffic scenarios were
considered. The primary factor examined was the
number of driveways per block, with each increment
in the number of driveways increasing the workload
by about 6.
VEHITS 2022 - 8th International Conference on Vehicle Technology and Intelligent Transport Systems
100

Table 5: Mean Part 2 Ratings for Residential/Suburban Streets.
Scenario
Driveways (per Side of the Road)
Mean
0-<2/Block (0.1 miles) 2-5/Block > 5/Block
Base case, straight road, no parked cars,
no intersection nearb
y
38 44 50 44
Base case,
b
u
t
>0 - 25% of curb has
p
arke
d
cars 46 51 58 52
Base case,
b
u
t
curved o
r
hill
y
505460 55
Base case,
b
u
t
>25% of curb has
p
arked cars 52 58 64 58
Base case, but at or approaching signed
intersection, where
y
ou nee
d
to stop
55 59 64 59
Mean 48 53 59 54
Table 6: Additive Model to Estimate Workload.
Road
Type
Modifier
Road Lane Traffic Driveways
Rural
Mean
Workload
= 58
-8 Base case -1 2 Lanes -5 None/
Little
-3 Gentle curve/hill 1 3 Lanes
(in left)
+5 Some
-3 1-ft shoulder +2 4 Lanes
(in left)
+1 At, approach li
g
h
t
+2 Stop si
g
n fo
r
others
+11 Ver
y
hill
y
, curve
d
Urban
Mean
Workload
= 63
-7 Base case -3 2 Lanes -6 None/
Little
-3 Corne
r
b
usiness -2 3 Lanes -3 Some
+9 Downtown +0 4 Lanes +9 Heav
y
+4 >=5 Lanes
Xway
Mean
Workload
= 61
-13 Base case -1 Left -12 None/
Little
-3 Curved/hill
y
0Middle0Some
-3 Exi
t
+2Ri
g
h
t
+12 Heav
y
0 Lane Drop
+1 Guardrail
+10 Construction
+10 Crash
Residential
Mean
Workload
= 54
-10 Base -6 Few
-2 Some
p
arkin
g
-1 Some
+1 Curved/hill
y
+5 Man
y
+4 Man
y
p
arked cars
+5 Intersection
3.3 Subjects Used an Additive Model to
Estimate Workload
Each factor added a fixed amount to the rated
workload (Table 6), with some variation appearing to
be due to rounding errors. To estimate the rated
workload in a situation, one adds or subtracts the
adjustment value to the value for the base case. As an
example, the prediction of workload for a rural road
minimum case is 58 (mean) + road modifier (base
case, -8) + lane factor (2 lanes, -1) + traffic
(little/none, -5) for a total of 44, versus 40 provided
Determining the Workload of Driving Scenarios using Ratings to Support Safety and Usability Assessments
101

by subjects. To provide another example, for a 4 lane
mountain road with some traffic, the table based total
is 58+11+2+5=76 (versus 74 in the table).
To estimate the anchored clip ratings, use the data
(e.g., traffic, road geometry, lane driven) for that road
type, in the same equation, to estimate the workload
in the anchored clip rating task. For example, in the
rural 2-lane road example given (no traffic) with a
computed workload = 44 and a subject reported
workload = 40 were about 2.3 and 1.9 respectively.
As a reminder, the anchored clip ratings were
reported by each subject to the nearest ½ point, so
these differences are within the limits of
measurement error. However, these ratings are not
perfect, and there are instances where some
combinations can yield negative values for anchored
workload when computed from the ratings of road
descriptions. But collectively, the data from these 2
procedures show that (1) ratings of workload can
be reliably determined and (2) the workload for
wide variety of road and traffic situations can be
calculated from the data provided herein.
4 CONCLUSIONS /
APPLICATIONS
4.1 Make Workload Quantifiable and
Comparable in Studies
For research studies, the primary workload can be
quantified for a wide range of driving situations,
providing a means to compare test conditions of
different studies using the table of factors provided
herein for each road type. In fact, road and traffic
combinations that appear to be very different in
theory could impose the same workload on the driver,
and therefore be directly comparable if the method
and data presented herein were used to quantify them.
So a hilly, curved, rural road with 2 lanes and no
traffic, in theory, would have a similar workload, (58
+ 11 -1 -5 = 63) as a very hilly, 2-lane rural road with
no traffic as a 2-lane rural road with some traffic
when approaching a traffic light (58 + 1 -1 + 5 = 63).
4.2 Provide a Basis for Implementing
Workload Managers
There has been a concern that guidelines that specify
what is excessively distracting are too limiting
because those guidelines do not consider the
workload the driver is experiencing at any moment.
The workload of driving in Tokyo is quite different
from driving in the deserts of the American
southwest. Using map data and/or data from vehicle
sensors (vehicle speed and gaps to other vehicles) as
described herein, a workload manager could adjust
what the driver could do at any given moment. In
some instances, street addresses could be entered. In
others, even just 1 button press could be excessively
distracting.
4.3 Support the Implementation of
Vehicle Automation
As was described in the introduction, a major issue is
how long it will take a driver to takeover if the
automation suddenly fails or is unable to drive
properly in some situation. Knowing how difficult the
driving situation is can help set those thresholds.
Furthermore, it could be that high workload levels not
only pose problems for drivers, but for automation as
well. In those instances, the automation system could
inform the driver that workload is getting high and
advice the driver of such, with some drivers either
paying greater attention to the driving scene or
making a discretionary takeover.
5 FINAL THOUGHTS
5.1 This Study Is Not Perfect
In this study, the direct rating method has not been
validated in real vehicles, only in simulation. The
anchored workload ratings are extrapolations of those
ratings, and they too have not been validated against
on-road assessments. However, the rating methods
have been shown to be highly reliable and the data are
easy to collect. The direct ratings are consistent, at
least within road types.
Furthermore, this paper provides methods to
calculate the workload of the task of driving using
either the anchored workload or direct rating method.
The direct rating method was extremely efficient and
a large number of use cases were explored. Equations
to convert between the 2 scales are provided. The
results of experiments conducted using this method
can be applied to fundamental studies of driving
related to highway design, driver distraction,
automated vehicles, and other topics. Logical next
steps are (1) to match the predictions of the numerous
machine vision studies that consider the driving task
and (2) to assimilate ideas from scenario description
languages being developed to support automated
vehicle research (e.g., Zhang, Khastgir, & Jennings,
2020; Braun, Ries, Kortke, Turner, Otten, & Sax,
VEHITS 2022 - 8th International Conference on Vehicle Technology and Intelligent Transport Systems
102

2021) and as well as crash typologies (Najm, Smith,
& Yanagisawa, 2007). Those languages and
typologies could provide a framework for workload
ratings.
REFERENCES
Abdel-Aty, M., Keller, J., & Brady, P. A. (2005). Analysis
of types of crashes at signalized intersections by using
complete crash data and tree-based regression.
Transportation Research Record, 1908(1), 37-45.
Backs, R.W., Lenneman, J.K., Wetzel, J.M., & Green, P.
(2004). Cardiac measures of driver workload during
simulated driving with and without visual occlusion.
Human Factors. 45(4), 525-538.
Braun, T., Ries, L., Körtke, F., Turner, L. R., Otten, S., &
Sax, E. (2021). Collection of requirements and model-
based approach for scenario description. In VEHITS,
634-645.
Brookhuis, K. A., & De Waard, D. (2010). Monitoring
drivers’ mental workload in driving simulators using
physiological measures. Accident Analysis &
Prevention. 42(3), 898-903.
Elwart, T., Green, P., & Lin, B. (2015). Predicting driver
distraction using computed occlusion task times:
Estimation of task element times and distributions
(technical report ATLAS-2015-01, UMTRI 2015-8).
Ann Arbor, MI: University of Michigan Transportation
Research Institute.
Green, P. (2008). Driver interface/HMI standards to
minimize driver distraction/overload (SAE paper 2008-
21-2002). Convergence Conference Proceedings.
Warrendale, PA: Society of Automotive Engineers.
Green, P. (2010). Driver distraction/overload research and
engineering: Problems and solutions (SAE paper 2010-
01-2331). Convergence Conference Proceedings.
Warrendale, PA: Society of Automotive Engineers.
Green, P. (2022, to appear). Estimating the workload of
driving using video clips as anchors (2022 SAE Annual
Congress).
Green, P., Cullinane, B., Zylstra, B., & Smith, D. (2004).
Typical values for driving performance with emphasis
on the standard deviation of lane position: A summary
of literature (Technical Report UMTRI-2003-42). Ann
Arbor, MI: The University of Michigan Transportation
Research Institute.
Hart, S. G. (2006). NASA-task load index (NASA-TLX):
20 years later. Proceedings of the Human Factors and
Ergonomics Society Annual Meeting. 904-908.
Hart, S. G. & Staveland, L. E. (1988). Development of
NASA TLX (Task Load Index): Results of empirical
and theoretical research. In P. A. Hancock and N.
Meshkati (Eds.) Human Mental Workload. Amsterdam,
The Netherlands: North Holland Press, 139-183.
Hart, S.G. & Wickens, C.D. (1990). Workload assessment
and prediction (chapter 9), in Booher (ed), Manprint,
Dordrecht, Germany: Van Nostrand Reinhold, 257 –
296.
Hulse, M. C., Dingus, T. A., Fischer, T., & Wierwille,
W.W. (1989). The influence of roadway parameters on
driver perception of attentional demand. Advances in
Industrial Ergonomics and Safety I. New-York: Taylor
and Francis, 451-456.
Jahn, G., Oehme, A., Krems, J. F., & Gelau, C. (2005).
Peripheral detection as a workload measure in driving:
Effects of traffic complexity and route guidance system
use in a driving study. Transportation Research Part F:
Traffic Psychology and Behaviour.
8(3), 255-275.
Karlaftis, M. G., & Golias, I. (2002). Effects of road
geometry and traffic volumes on rural roadway accident
rates. Accident Analysis & Prevention. 34(3), 357-365.
Kujala, T., Kircher, K., & Ahlström, C. (2021). A review of
occlusion as a tool to assess attentional demand in
driving. Human Factors (to appear).
Lin, B.T.W., Green, P., Kang, T-P., & Lo, E-W. (2012).
Development and evaluation of new anchors for ratings
of driving workload (technical report UMTRI 2012-
14). Ann Arbor, MI: University of Michigan
Transportation Research Institute
Liu, K. Green, P., & Liu, Y. (2019). Traffic and ratings of
driver workload: The effect of the number of vehicles
and their distance headways. Proceedings of the Human
Factors and Ergonomics Society, 2134-2138.
Macdonald, W. A., & Hoffmann, E. R. (1980). Review of
relationships between steering wheel reversal rate and
driving task demand. Human Factors. 22(6), 733-739.
Mehler, B., Reimer, B., & Dusek, J. A. (2011). MIT
AgeLab delayed digit recall task (n-back). Cambridge,
MA: Massachusetts Institute of Technology, 17.
Meseguer, J. E., Calafate, C. T., & Cano, J. C. (2018). On
the correlation between heart rate and driving style in
real driving scenarios. Mobile Networks and
Applications, 23(1) 128-135.
Messer, C.J. (1980). Methodology for evaluating geometric
design consistency, Transportation Research Record #
757. Washington, D.C.: National Academy of Sciences,
Transportation Research Board, 7-14.
Najm, W.G., Smith, J.D. & Yanagisawa, M. (2007). Pre-
Crash scenario typology for crash avoidance research
(DOT HS 810 767), Washington, D.C.: U.S.
Department of Transportation, National Highway
Traffic Safety Administration,
Piechulla, W., Mayser, C., Gehrke, H., & König, W. (2003).
Reducing drivers' mental workload by means of an
adaptive man-machine interface. Transportation
Research Part F, 6, 233-248.
Reimer, B., Mehler, B., Coughlin, J. F., Godfrey, K. M., &
Tan, C. (2009, September). An on-road assessment of
the impact of cognitive workload on physiological
arousal in young adult drivers. In Proceedings of the 1st
International Conference on Automotive User
Interfaces and Interactive Vehicular Applications, 115-
118.
Senders, J.W., Kristofferson, A.B., Levison, W.H.,
Dietrich, C.W., & Ward, J.L. (1967). The attentional
demand of automobile driving, Highway Research
Record # 195. Washington, D.C.: National Academy of
Sciences, Transportation Research Board, 15-33.
Determining the Workload of Driving Scenarios using Ratings to Support Safety and Usability Assessments
103

Schweitzer, J. & Green, P.A. (2006). Task acceptability and
workload of driving urban roads, highways, and
expressway: ratings from video clips (technical report
UMTRI-2006-19). Ann Arbor, MI: University of
Michigan Transportation Research Institute.
Society of Automotive Engineers (2015). Navigation and
route guidance function accessibility while driving
(SAE Recommended Practice J2364). Warrendale, PA:
Society of Automotive Engineers.
Society of Automotive Engineers (2016). Calculation of the
time to complete in-vehicle navigation and route
guidance tasks (SAE Recommended Practice J2365).
Warrendale, PA: Society of Automotive Engineers.
Taggart, P. & Gibbons, D. (1967). Motor-car driving and
the heart rate. British Medical Journal, 1(5537), 411.
Tsimhoni, O., Green, P., & Watanabe, H., (2001).
Detecting and reading text on HUDS: Effects of driving
workload and message location, paper presented at the
ITS-A Annual Meeting (CD-ROM).
U.S. Department of Transportation (2014, September 16).
Visual-manual NHTSA driver distraction guidelines for
in-vehicle electronic devices (79 FR 55530, pages
55530-55534, Docket NHTSA-2014-0088, document
2014-21991). Washington, D.C.: U.S. Department of
Transportation, National Highway Traffic Safety
Administration.
Wooldridge, M., Bauer, K., Green, P., & Fitzpatrick, K.
(2000). Comparison of workload values obtained from
test track, simulator, and on-road experiments, paper
presented at the Transportation Research Board Annual
Meeting, Washington, D.C.
Yun, Y., Oh, H., & Myung, R. (2019, November). The
effect of takeover lead time on driver workload.
Proceedings of the Human Factors and Ergonomics
Society Annual Meeting, 1872-1873.
Zhang, X., Khastgir, S., & Jennings, P. (2020, October).
Scenario description language for automated driving
systems: A two-level abstraction approach. In 2020
IEEE International Conference on Systems, Man, and
Cybernetics (SMC), New York, NY: IEEE, 973-980.
VEHITS 2022 - 8th International Conference on Vehicle Technology and Intelligent Transport Systems
104
