
Mining Experienced Developers in Open-source Projects
Quentin Perez
a
, Christelle Urtado
b
and Sylvain Vauttier
c
EuroMov Digital Health in Motion, Univ. Montpellier, IMT Mines Ales, Ales, France
Keywords:
Software Engineering, Artificial Intelligence, Developer Classification, Empirical Software Engineering.
Abstract:
Experienced developers are key for the success of software development projects. In open-source software
development, due to openness and distance, one cannot always rely on interpersonal interactions to know who
these key people are. Automating the mining of experienced developers is not an easy task either, because
of the subjectivity and relativity of what experience is and also because the material to search from (code
and development-related metadata) does not obviously relate developers to their capabilities. Some research
works propose developer profiling or clustering solutions though, from which we take inspiration. This pa-
per advocates that it is possible to learn from tangible metrics extracted from code and development-related
artifacts who are the experienced developers. It uses a supervised learning-based approach trained with a man-
ually labeled dataset of 703 developers from 17 open-source projects from GitHub for which 23 metrics are
automatically extracted. Experienced developers classification results show a high F1 measure. A companion
explainability study analyzes which metrics are the most influential.
1 INTRODUCTION
Thanks to their knowledge and skills, experienced de-
velopers are key to software projects. Indeed, Booch
advocates that “every project should have exactly one
identifiable architect, although for larger projects, the
principal architect should be backed up by an ar-
chitecture team of modest size” (Booch, 1996). Ex-
perienced developers are often those who possess
both the historical and technical knowledge of the
project. This technical knowledge often overlaps
with the knowledge of the project’s software architec-
ture. Kruchten (Kruchten, 1999) argues that software
project architects are often experienced developers
who master various concepts and technologies. The
loss of this knowledge, that could be induced by peo-
ple leaving a project, is detrimental and imply human
and technical management issues (Izquierdo-Cortazar
et al., 2009). Therefore, the identification of expe-
rienced developers is a step towards better practices
for the management of development teams. In open-
source projects, where interpersonal relations are not
followed as easily as they are in company teams, iden-
tifying experienced developers through human inter-
actions is not always possible.
To overcome this issue, this paper investigates the
possibility of mining experienced developers auto-
a
https://orcid.org/0000-0002-1534-4821
b
https://orcid.org/0000-0002-6711-8455
c
https://orcid.org/0000-0002-5812-1230
matically, based on tangible metrics extracted from
code and development-related artifacts from open-
source software projects. It proposes a complete ap-
proach for mining experienced developers based on
software metrics, as descriptive features of the prob-
lem, and supervised learning, as a binary classifica-
tion method. As a first step, we create a dataset
of 703 developers (contributors to projects) extracted
from 17 Java open-source projects hosted on GitHub.
Then, developers are manually labeled as being ex-
perienced or not, using manual searches in profes-
sional social networks and project documentation.
To deal with an imbalanced dataset (lack of data in
the experienced developer class) synthetic data gen-
eration (over-sampling using K-Means SMOTE) is
used. Then, various classification methods are bench-
marked from which Random Forest (RF) happens to
be the most efficient. The classification reaches a
good F1 measure, with well balanced recall and pre-
cision. Results prove that supervised classification is
a valid approach to automatically mine experienced
developers from project contributors using software
metrics. Moreover, the classifier explanation (using
the SHAP technique) provides valuable insight about
the prominent characteristics in experienced devel-
oper profiles and, more specifically, architectural ac-
tivities.
The remainder of this paper is organized as fol-
lows. Section 2 presents state-of-the art approaches
to profile or cluster developers based on their expe-
Perez, Q., Urtado, C. and Vauttier, S.
Mining Experienced Developers in Open-source Projects.
DOI: 10.5220/0011071800003176
In Proceedings of the 17th International Conference on Evaluation of Novel Approaches to Software Engineering (ENASE 2022), pages 443-452
ISBN: 978-989-758-568-5; ISSN: 2184-4895
Copyright
c
2022 by SCITEPRESS – Science and Technology Publications, Lda. All rights reserved
443

rience. Section 3 details our proposed experienced
developer mining approach. Section 4 presents and
analyzes our results. Section 5 discusses threats to va-
lidity. Section 6 concludes and provides perspectives
about this work.
2 RELATED WORKS ON
DEVELOPER PROFILING AND
CLUSTERING
Several works exist that identify experienced devel-
opers or domains of expertise in software projects
(Greene and Fischer, 2016; dos Santos et al., 2018;
Hauff and Gousios, 2015; Teyton et al., 2013, 2014;
Di Bella et al., 2013; Kagdi et al., 2008; Schuler and
Zimmermann, 2008; Sindhgatta, 2008; Mockus and
Herbsleb, 2002). Approaches fall into two categories:
profiling and clustering.
2.1 Profiling
Profiling approaches discover experts for a single or
several technologies in a given project.
Mockus et al. (Mockus and Herbsleb, 2002) pro-
pose Expertise Browser to find expertise domains in
project artifacts (documentation, code, product, etc.)
using various data sources (repository data, documen-
tation, etc.). Expertise Browser is based on their pro-
posed concept of Experience Atom that models a de-
veloper’s expertise on the basis of the modifications
made on a project artifact. The collection of these Ex-
perience Atoms on each program unit composes the
expertise of the developer.
Singhgatta (Sindhgatta, 2008) uses repository data
and source code combined with clustering (K-Means)
to extract key concepts of expertise such as security,
database or multi-threading. Expertise concepts are
then linked to developers using repository logs. It thus
measures an expertise level on each expertise concept
for each developer.
Schuler et al. (Schuler and Zimmermann, 2008)
profile developers using CVS data and source code.
They have implemented a system to measure the soft-
ware expertise at the method level. They argue that a
developer that changes a method must understand its
functionality and therefore has an expertise. To do so,
they count the number of methods used and changed
by developers. Each method in the project is attach to
all developers that have worked on it. Developers that
changed or used the highest number of methods are
considered to be experts.
LIBTIC (Teyton et al., 2013) is an approach cre-
ated by Teyton et al. to find library experts. As pro-
posed by Kagdi et al. (Kagdi et al., 2008), LIBTIC
computes vectors to characterize expertise levels of
developers. However, LIBTIC is focused on library
usage. Data encoded in vectors come both from the
source code of libraries (jar archive) and developers’
Git repositories. It evaluates how developers mas-
ter libraries and identifies the required expertise in
project.
XTic (Teyton et al., 2014) is the most versatile ap-
proach. It uses source code and repository data. Tey-
ton et al. (Teyton et al., 2014) analyze syntactical
modifications made in a project. Skills of a given de-
veloper are represented as a collection of syntactical
patterns. The level of expertise is a positive number
representing how many times syntactical patterns ap-
pear for a given developer. Xtic provides a domain
specific language to describe specific developer pro-
files to be searched for according to technologies that
have to be mastered.
Hauff et al. (Hauff and Gousios, 2015) extract
ontological concepts from job advertisements on pro-
gramming, methodology or technologies. The same
extraction is performed on README files in GitHub
repositories for a given developer. All extracted con-
cepts, methodology and technologies to master for
jobs and mastered by the developers, are weighted.
Developer skills are then associated to job advertise-
ments by linking concepts with same weights in job
advertisements and GitHub README files. This ap-
proach does not use data directly related to the source
code.
CVExplorer (Greene and Fischer, 2016) uses
metadata and README files from GitHub to gener-
ate a lattice of technologies mentioned by developers
in README files of GitHub projects. The visualisa-
tion of lattice nodes uses a tag cloud. Users can select
tag clouds to navigate through the lattice and refine a
developer’s profile according to their needs.
Santos et al. (dos Santos et al., 2018) define five
skill scores to rank developers. Each skill is based on
metrics (number of imports, lines of codes, number
of projects, etc.) and thresholds are defined for each.
According to values and thresholds, a rank is assigned
to each developer.
2.2 Clustering
Clustering approaches group developers according to
their skills or their experience in a given project.
Kagdi et al. (Kagdi et al., 2008) identify three
groups of expert developers. These groups corre-
sponds to three granularity levels in object-oriented
projects: file, package and system. Kagdi et al. mea-
ENASE 2022 - 17th International Conference on Evaluation of Novel Approaches to Software Engineering
444

sure and vectorize contributions for each developer on
project files and the number of days in the project.
These vectors are then used to compute an exper-
tise factor called XFactor for each developer. By this
means, experts are found at different granularity lev-
els of the application.
Di Bella et al. (Di Bella et al., 2013) classify de-
velopers in four groups (Core, Active, Occasional and
Rare) using clustering methods. Their classification is
said to be “onion-like” and has been firstly described
by Nakakoji et al. (Nakakoji et al., 2002). They
extract metrics for each developer (such as number
of commits, inter-commit days, lines of codes) from
source code and Git data. They use data-mining meth-
ods (Principal Component Analysis and Factor Anal-
ysis) combined to unsupervised learning (K-Means)
to classify developers in those predefined four groups.
Despite these works, to our knowledge, this pa-
per is the first to mine experienced developers us-
ing supervised learning combined to software met-
rics. Besides, only three approaches profile architec-
tural skills (Teyton et al., 2014; Greene and Fischer,
2016; dos Santos et al., 2018). Moreover, only two
approaches use machine learning, more precisely un-
supervised learning (Sindhgatta, 2008; Di Bella et al.,
2013). Among of these works, Di Bella et al.’s pro-
posal (Di Bella et al., 2013) is the only that uses soft-
ware metrics to perform an unsupervised classifica-
tion of developers in open-source projects.
3 PROPOSED APPROACH FOR
MINING EXPERIENCED
DEVELOPERS
In this section, we detail our proposed approach to
mine experienced developers from dataset creation to
classifier selection and evaluation. In order to guaran-
tee the reproducibility of this study, both our source
code and data are available online
1
. The proposed ap-
proach is sketched in Figure 1.
3.1 Dataset Creation
To our knowledge, there is no dataset of con-
tributors related to open-source projects based on
Spring.Therefore, we have chosen to create our own.
Our goal here is to build a dataset of developers asso-
ciated to metrics (described in Section 3.1.2) and de-
veloper experience (Experienced Software Engineer,
Software Engineer or Unknown).
1
https://github.com/qperez/MEDOS
3.1.1 Contributors Extraction
First, we select 17 popular projects that use the archi-
tectural Java Spring Framework
2
. Using the GitHub
REST API
3
, we extract 951 developers that contribute
to these projects. The data retrieved contain user-
name, name and email from developers’ GitHub ac-
counts. Each extracted developer is linked to its
project. A developer working on several projects ap-
pears several times in the extracted collection.
3.1.2 Contributor Metrics Extraction
Using the PyDriller tool (Spadini et al., 2018), we
compute 23 metrics for each developer of each project
as described in Table 1. Metrics are extracted from the
first to the last known commit for each project which
results in 63,891 commits. To choose these metrics,
we rely on the work of Di Bella et al. (Di Bella
et al., 2013) and Perez et al. (Perez et al., 2021).
Di Bella et al. uses an unsupervised method to clas-
sify developers in 4 groups from rare to core develop-
ers. They show that several metrics are discriminant
for this classification: Number of Commits, Lines
of Codes, Days in Project and Inter-commit
Time. Hence, we choose to reuse these metrics in our
classification context. Perez et al. used Spring mark-
ers (specific Java annotations) to statistically distin-
guish categories of developers having an experience
in runtime architecture. Therefore, we used three spe-
cific variables in relation with Spring runtime archi-
tecture. Others variables regard software design and
architecture (metrics bolded) and Maven or Gradle
structure (metrics italized).
Non-contributors bring some noise to the data
which could reduce the quality of the classifier. To ex-
clude non-contributors to the source code, we remove
from our dataset the contributors that did not change
at least one line as synthesized in the following vari-
ables: AddLGM , DelLGM , AddLoC, DelLoC, AddSAM,
DelSAM. By this means, the dataset size reduces from
951 contributors to 703.
3.1.3 Mapping Contributors to Developers’
Experience in Projects
Next goal consists in labeling our dataset with the aim
of using it for supervised learning. This amounts to
map GitHub contributor profiles to their level of expe-
rience in projects. To do so, we search each developer
on internet using GitHub username and name. We
use this method because many developers use social
2
https://spring.io/projects/spring-framework
3
https://docs.github.com/en/rest
Mining Experienced Developers in Open-source Projects
445
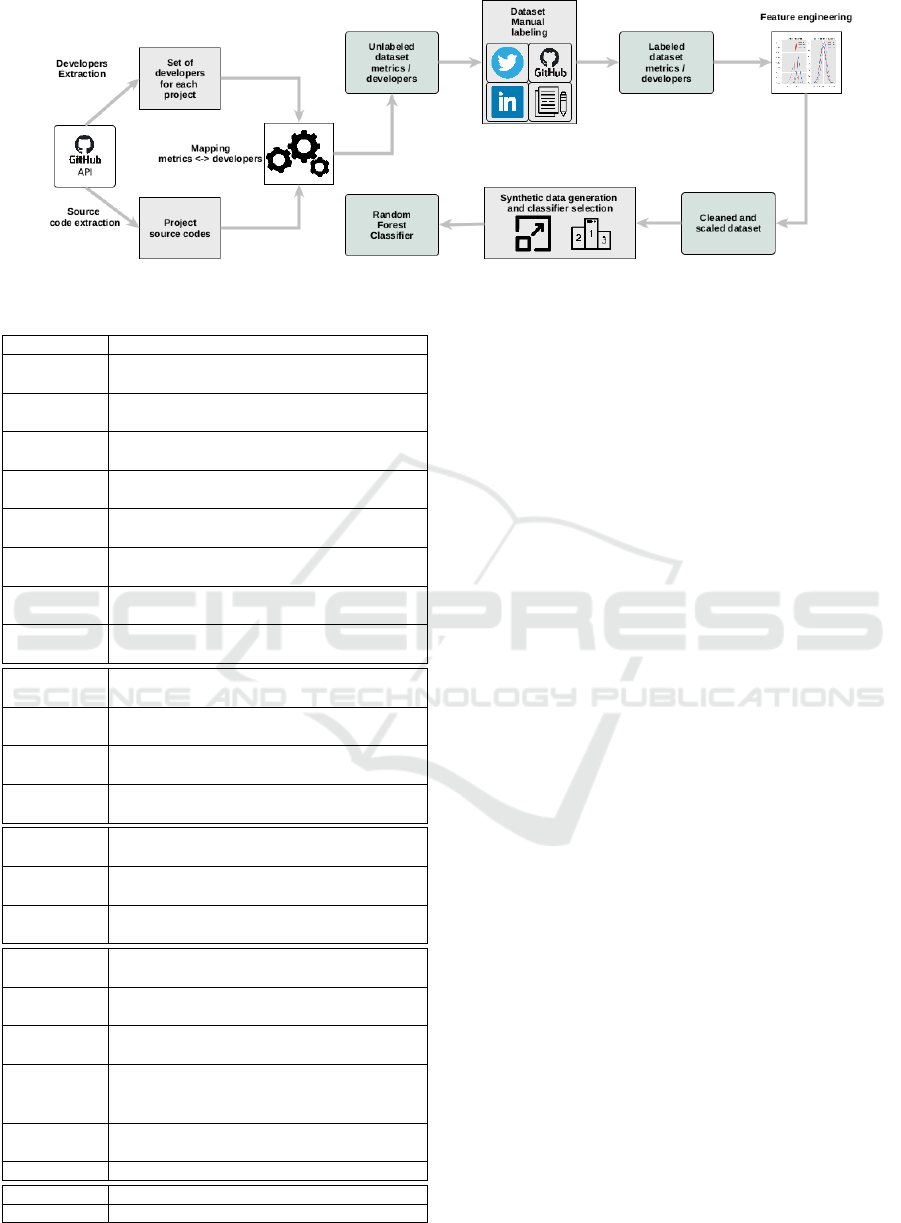
Figure 1: Experienced developers classification process.
Table 1: 23 Metrics extracted for each developer.
Variable code Variable
NoAB Number of Abstract Classes created by a given de-
veloper
NonAB Number of non Abstract Classes created by a given
developer
NoCII Number of Classes Implementing an Interface cre-
ated by a given developer
NoCnII Number of Classes not Implementing an Interface
created by a given developer
NoCE Number of Classes Extending another class created
by a given developer
NonCE Number of Classes not Extending another class cre-
ated by a given developer
NoInEI Number of Interfaces not Extending another Inter-
face created by a given developer
NoIEI Number of Interfaces Extending another Interface
created by a given developer
AddLGM Lines added in Gradle or Maven files by a given de-
veloper
DelLGM Lines deleted in Gradle or Maven files by a given
developer in Gradle or Maven files
ChurnLGM Difference between added and deleted lines in Gradle
/ Maven files for a given developer
NoMGM Number of Modules Gradle or Maven created by a
given developer
AD D SAM Spring Architectural Modifications (lines specific to
Spring) added by a given developer
DE L SAM Spring Architectural Modifications (lines specific to
Spring) by a given developer
CH U R N SAM Difference between added and deleted specific
Spring lines for a given developer
AddLOC Number of Lines Of Code added by a given devel-
oper in project files
DelLOC Number of Lines Of Code deleted by a given devel-
oper in project files
ChurnLOC Difference between added and deleted lines of code
in project files for a given developer
DiP Days in Project. Number of days the developer has
been in the project (time between first and last com-
mit)
IT Inter-commit Time. Average time (days) between
commits
NoC Number of commit made by a developer
AddF Number of files added for a given developer
DelF Number of files deleted for a given developer
networks (Archambault and Grudin, 2012). As a per-
spective, another complementary solution might be to
send questionnaires to developers but the weakness of
this method is the usual low response rate (Tse, 1998;
Cook et al., 2000). Therefore, we collect contribu-
tor’s experience from LinkedIn, Twitter and GitHub
profiles or project documentation websites. To do so,
we manually search each developer GitHub name in
search engines. If the search result is positive, to pre-
vent homonyms in names, we check that the devel-
oper mentions that he is working on the given project.
Finally, we inspect the developer’s profile and manu-
ally label the developer.
Considering a given project, if the profile of a
given developer mentions:
• “Architect” or “Senior Software Engineer” then
we label this developer as ”Experienced Software
Engineer” (ESE) (Kruchten, 1999),
• “Junior Software Engineer” or “Software Engi-
neer” then we label this developer as “Software
Engineer” (SE),
• “Developer” then we search if the developer has
a Master of Sciences in Software Engineering. If
so, the developer is labelled as “SE”; else the de-
veloper is labelled as “OTHER”.
• Other descriptions than “SE” or “ESE” then we
label the developer as “OTHER”.
If the GitHub username of the developer contains the
word “bot” then he is labelled as “BOT”. Finally, if
no information is available about the experience of
the developer in the project then it is labelled as “UN-
KNOWN”. Labeling results in one of the five values
listed in Table 2.
After having used this raw labeling technique,
deeper analysis shows that “SE” or “UNKNOWN”
developers can have metrics comparable to ”ESE”. To
avoid these misclassifications, we have sought outlin-
ers using an Isolation-Forest method. Isolation-Forest
calculates a score for each observation in the dataset.
This score provides a measure of normality for each
ENASE 2022 - 17th International Conference on Evaluation of Novel Approaches to Software Engineering
446

Table 2: Labels used to annotate developers.
Label acronym Label Description
ESE Experienced Software Engineer
Contributor declaring himself as being an experienced or senior software engineer.
SE Software Engineer
Contributor declaring himself as being a software engineer.
OTHER Other
Contributor declaring himself as not belonging to one of the above categories.
UNKNOWN Unknown No information available about the contributor.
BOT Bot
Machine of continuous integration having a GitHub profile to: test, commit, release, etc.
observation. We assume that some “SE” or “UN-
KWNON” may be declared “ESE”. After an inspec-
tion of outliners spotted by Isolation-Forest, we have
manually relabeled 21 of them: 4 “UNKNOWN” to
“ESE” and 17 “SE” to “ESE”. Table 3 details the
number of contributors for each category before and
after manual relabeling. This labeling will allow a
wider use of the dataset in other contexts than the bi-
nary classification that we perform here.
Our goal is now to perform a binary classification
of developers separating “ESE” from “Non-ESE”. All
contributors associated to labels other than “ESE” are
considered “Non-ESE”. As a result of this process,
we obtain 98 contributors labelled as being “ESE” and
605 contributors considered to be “Non-ESE”.
3.2 Feature Engineering
To be efficient, classification requires a preprocessing
phase called feature engineering (Zheng and Casari,
2018). In this phase, various transformations are ap-
plied on data: scaling, mathematical transformation,
normalization, outliner detection etc.
The first step of feature engineering we apply is a
log transformation to reduce the high data skewness
of 6 variables: DiP, NoC, AddLOC, DelLOC, AddSAM,
DelSAM. High skewness leads to a large variance in es-
timates that finally decreases classifier performance.
Having variables (features) with different scales
and units, we perform a data standardization step. We
use the Min-Max method to reduce the effect of out-
liners and scale data in the range [−1, 1]. Min-Max
scaling is defined as follows:
X
scaled
=
X − X
min
X
max
− X
min
× (max − min) + min
with:
• X the feature value to scale,
• X
scaled
the feature value scaled,
• X
min
and X
max
the minimum and maximum ob-
served value for feature X,
• max the upper bound for the range,
• min the lower bound for the range.
3.3 Data Over-sampling
A point of attention is our highly imbalanced dataset.
Our dataset contains 98 experienced developers (mi-
nority class) and 605 non-experienced developers
(majority class). Keeping these categories imbal-
anced would lead to a biased classification model. To
overcome the lack of data on the minority class, we
use the SMOTE (Synthetic Minority Over-sampling
Technique) over-sampling method (Chawla et al.,
2002). SMOTE is designed to create synthetic data
based on existing data. It selects existing points in
space, creates vectors between them and randomly
generates a synthetic point on this vector. SMOTE
has proven its performance as compared to other data
generation methods such as random over-sampling
(Chawla et al., 2002; Dudjak and Martinovi
´
c, 2020).
More precisely, a variant of SMOTE called K-Means
SMOTE (Douzas et al., 2018) is used here. Com-
pared to SMOTE, K-Means SMOTE reduces noise
in the generated data (Douzas et al., 2018). By this
means, we generate synthetic experienced contributor
profiles. Synthetic data generation is performed dur-
ing the classifier training phase to increase the number
of learning data. Figure 2 shows the combination of
over-sampling and 4-fold. The over-sampling is per-
formed on the minority class on each test fold.
3.4 Classifier Selection
In this study, we now compare 6 different classifiers
to choose from. We test 3 classifiers that are known to
have good performances on small datasets (SVM, LR,
kNN) and, for the comparison, 3 more complex clas-
sifiers (SGD, RF, MLP). Using our labeled dataset,
we test these classifiers using their implementations
in the Scikit-learn API (Lars Buitinck, 2013)
• Logistic Regression (LR) is a binomial regres-
sion model used to describe data and the rela-
tionship between a dependent variable and one
or more independent variables. LR estimates the
probability of an event occurence using a sigmoid
function.
• k-Nearest Neighbors (kNN) is a non-parametric
method in which the model stores the data of the
training dataset to perform the classification. To
Mining Experienced Developers in Open-source Projects
447
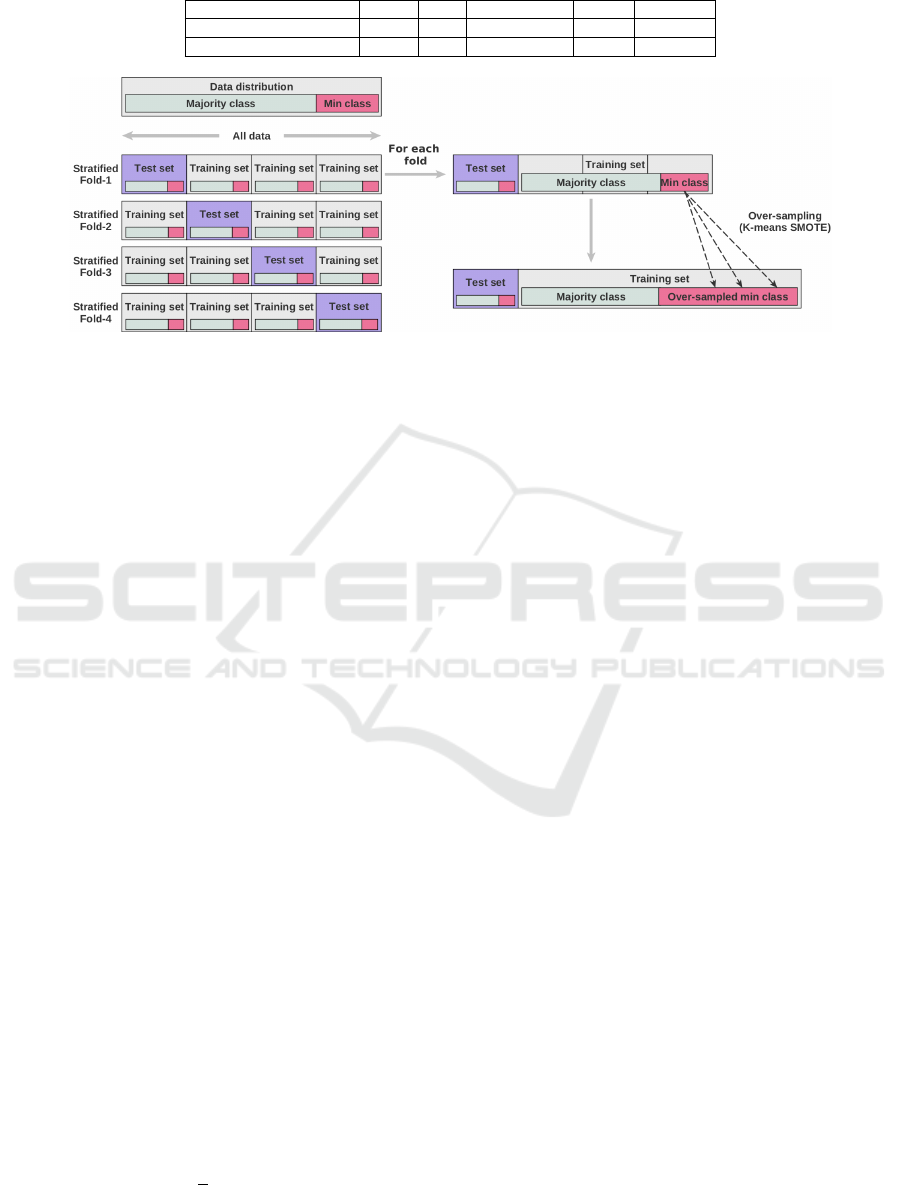
Table 3: Dataset details before and after manual relabeling.
#ESE #SE #UNKNOWN #BOT #OTHER
Before manual relabeling
81 86 509 10 17
After manual relabeling
98 73 505 10 17
Figure 2: Synthetic data generation during 4-fold evaluation.
assess the class of a new input, kNN looks for
its k closest neighbors using a distance formula
(e.g., Euclidean distance) and chooses the class of
the majority of neighbors.
• Support Vector Machines (SVMs) are non prob-
abilistic classifiers based on linear algebra. Train-
ing SVMs creates hyperplanes that separate multi-
dimensional data into different classes. SVMs op-
timize hyperplanes’ positions by maximizing their
distance with the nearest data. These classifiers
generally reach a good accuracy.
• Multi-Layer Perceptron (MLP) is a type of for-
mal neural network that is organized in several
layers. Information flows from the neurons of
the input layer to the neurons of the output layer
through weighted connections. Supervised train-
ing incrementally adjusts the weights of connec-
tions (error back-propagation) so that the expected
outputs can be learned by the MLP. Through the
use of multi-layers, a MLP is able to classify
data that is not linearly separable (using multiple
learned hyperplanes).
• Random-Forest (RF) is a parallel learning
method based on multiple, randomly constructed,
decision trees. Each tree of the random forest is
trained on a random subset of data according to
the bagging principle, with a random subset of
features according to the principle of random pro-
jections.
• Stochastic Gradient Descent (SGD) uses the it-
erative gradient descent method to minimize an
objective function defined as a sum of functions:
Q(w) =
1
n
n
∑
i=1
Q
i
(w),
where w is the parameter to be estimated in order
to minimize function Q(w). Q
i
corresponds to the
i-th observation in the training dataset.
Classifiers have hyper-parameters values influencing
the model. Thus, setting correct hyper-parameter val-
ues provides better classifications. To do so, hyper-
parameters values are tuned using a Grid-Search al-
gorithm. Grid-Search, also called parameter sweep,
is a brute-force method that searches for an optimal
combination of parameters’ values using their n-fold
Cartesian product. Classifier performances are evalu-
ated using a stratified k-fold cross-validation protocol
(k = 4). We selected a small k and stratified version
because dataset size is modest. As shown by Figu-
re 2, we oversample only the train folds. Test folds
keep the distribution of original data so as to be repre-
sentative of real data from projects Indeed, perform-
ing validation on a over-sampled test fold would have
biased the evaluation.
4 RESULTS
4.1 Classifier Selection
As explained in Section 3.4, we test and compare
six classifiers using the F1 measure: Multi-layer Per-
ceptron (MLP), k-Nearest Neighbors (kNN), Logis-
tic Regression (LR), Random Forest (RF), Support
Vector Machine (SVM) and Stochastic Gradient De-
scent (SGD). Classifier hyper-parameters are previ-
ously coarsely optimized using a Grid-Search algo-
rithm. Classifiers are then evaluated with a stratified
4-fold protocol (see Section 3.3). Table 4 compiles
optimized hyper-parameter values and experimental
results for each classifier. RF happens to be the clas-
ENASE 2022 - 17th International Conference on Evaluation of Novel Approaches to Software Engineering
448

sifier that performs best (bold figures). Hence, RF
will be the chosen classifier for the remaining.
Table 4: Results obtained with SciKit classifiers using a
stratified 4-fold cross-validation 23 features.
CLF
Specific Classifier Parameters
Grid-Search Optimized
F1 Measure
RF
criterion=’gini’, n estimators=300,
random state=0, max depth=2,
max features=’log2’
0.789
IC 95%: 0.053
SGD
loss=’modified huber’, max iter=2000,
random state=0, tol=0.1,
alpha=0.1, learning rate=’invscaling’
0.775
IC 95%: 0.057
kNN
weights=’distance’, n neighbors=6,
algorithm=’ball tree’, p=2
0.767
IC 95%: 0.073
MLP
activation=’relu’, learning rate=’constant’,
max iter=100, random state=0,
hidden
layer sizes=(50, 50), solver=’adam’
0.766
IC 95%: 0.046
SVM
C=0.2, gamma=’scale’,
kernel=’poly’,random state=0,
tol=0.0001
0.763
IC 95%: 0.021
LR
C=0.52, random state=9090,
solver=’sag’, tol=0.1
0.757
IC 95%: 0.142
4.2 Detailed Results
In order to determine the respective influence of each
step in our process, we evaluate our RF classifier with
different settings. For each setting we compute F1
measure, recall, precision and balanced accuracy. Re-
sults are given by Figure 3 and Table 5.
Setting 1. In this configuration, feature scaling, data
transformation and synthetic data generation are not
used. Moreover, RF classifier hyper-parameter values
are set to default (i.e., as set by the Scikit-Learn API).
Evaluation results in a good precision (0.8608) but a
poor recall (0.6829). Confidence intervals are large
on all measures.
Setting 2. This configuration replicates Setting 1 ex-
cept for classifier hyper-parameters, which are opti-
mized as calculated by Gird-Search. In this configu-
ration, the F1-Measure is almost unaffected (0.7591)
as compared to the previous configuration (0.7601).
However, as compared to Setting 1, confidence inter-
vals are reduced or stable for all measures.
Setting 3. In this configuration, Setting 2 is improved
using log transformation and data scaling. As com-
pared to Setting 2, Setting 3 shows a positive influ-
ence on F1 measure (+0.0063), recall (+0.010) and
accuracy (+0.005). All confidence intervals are sub-
stantially increased. These transformations increase
the performance of the classifier but induce more vari-
ability.
Setting 4. Setting 3 is in turn altered with the addi-
tion of synthetic data generation as described in Sec-
tion 3.4. Training the classifier on a balanced dataset
has a positive impact on measures. As compared to
Setting 3, F1 (+0.0233), recall (+0.413) and accuracy
(+0.0198) are increased. Confidence intervals are re-
duced on all measures as compared to Setting 3 but
close to those of Setting 2. As in Setting 3, precision
is decreased (-0.002) but there is a good trade-off be-
tween recall (0.7446) and precision (0.8390).
4.3 Feature Contribution
One of the challenges of Machine Learning algo-
rithms is their explainability. Explainability tech-
niques show which features are most significant for
classification. Several technology-agnostic explana-
tion methods could be considered: feature permu-
tation (Breiman, 2001), Local Interpretable Model-
agnostic Explanation (LIME) (Ribeiro et al., 2016),
SHapley Additive exPlanations (SHAP) (Lundberg
and Lee, 2017) and Anchors (Ribeiro et al., 2018).
These methods are post-hoc, meaning they analyze
classifiers after they have been trained on data. Only
feature permutation, LIME and SHAP explain the
classifier globally, i.e., explain feature contribution.
Anchors explains only classification results for a
given instance. Feature permutation is the most sim-
ple method but not the most reliable (Hooker and
Mentch, 2019). Studies comparing LIME and SHAP
conclude that SHAP gives more consistent expla-
nations (Lundberg and Lee, 2017; Moscato et al.,
2021). Therefore, we choose SHAP (Lundberg and
Lee, 2017) to explain our RF classifier. SHAP uses
game theory, more precisely the Shapley value (Shap-
ley, 1953) to measure feature contribution to classi-
fication. We combine SHAP explanation with our
stratified 4-fold protocol to explain results on each
fold. Feature contribution values returned by SHAP
are thus saved for each fold and their means computed
for each feature afterwards.
Figure 4 shows results about the explanation of
the RF classifier. We observe that four features have
a preponderant impact on classification: number of
lines of code added (AddLOC), churn of lines of code
(ChurnLOC), number of deleted files (DelF) and num-
ber of non-abstract classes created (NoNAB). Di Bella
et al. (Di Bella et al., 2013) have shown that lines
of codes are discriminant features to categorize de-
velopers using an unsupervised method. Here, in a
supervised context, we make the same observation.
Number of deleted files and number of non-abstract
classes created could be a sign of refactoring per-
formed by experimented developers. Among features
with lower importance, number of commits (NoC) is
in sixth place and days in project (DiP) in twelfth
place. These two features are also considered dis-
Mining Experienced Developers in Open-source Projects
449
Figure 3: Values and confidence intervals for F1, recall, precision and accuracy on 4 settings.
Table 5: Values and confidence intervals for F1, recall, precision and accuracy on 4 settings.
Setting 1 Setting 2 Setting 3 Setting 4 Evaluation
protocolValue IC 95% Value IC 95% Value IC 95% Value IC 95%
F1 0.7601 0.0571 0.7591 0.0458 0.7654 0.1111 0.7887 0.0529
Stratified 4-fold
Recall 0.6829 0.0978 0.6933 0.0777 0.7033 0.1267 0.7446 0.0708
Stratified 4-fold
Precision 0.8608 0.0625 0.8412 0.0654 0.8411 0.1098 0.8390 0.0438
Stratified 4-fold
Accuracy 0.8324 0.0459 0.8359 0.0363 0.8409 0.0678 0.8607 0.0364
Stratified 4-fold
criminant by Di Bella et al. (Di Bella et al., 2013).
We observe the same here. From the eighth to the
eleventh position in Figure 4, we find different fea-
tures related to the Java object structure: number of
classes not extending another class (NonCE), number
of classes implementing an interface (NoCII), num-
ber of classes not implementing an interface (NoCnII)
and number of classes extending another class (NoCE).
These four features tend to show that taking into ac-
count the activities on the structure of the Java code
of projects has only a moderate impact to discrimi-
nate experimented developers from others. Number
of Gradle/Maven modules created (NoMGM ) and num-
ber of Gradle/Maven lines added (AddLGM ) (ranked
thirteenth and fourteenth) are less important than the
Java structure but should not be neglected. The most
surprising observation concerns features about Spring
architecture (A D D SAM, D E L SAM, C H U R N SAM), which
are the least important for classification. Spring ar-
chitectural contributions seems to be not discriminant
to classify developers contrary to our intuition. Al-
though these tasks are taken over by experienced and
often long time contributors in projects (Perez et al.,
2021), they correspond to the very specific role of ar-
chitect are thus assumed by a smaller proportion of
the experienced developers.
5 THREATS TO VALIDITY
This section discusses the main threats to the validity
of our proposal.
Internal Threats. The main internal threat is linked
to the quality of our dataset. Our approach strongly
relies on labels that are set by contributors who self-
report their level of experience in projects on social
networks (LinkedIn, Twitter) or in project documen-
tation. This labeling may be thus subject to bias if
some developers consider themselves to be experi-
enced when they are not, or vice versa. To mitigate
this risk, our proposal includes a manual relabeling
phase using a mathematical method. Despite this, er-
rors may still exist in our dataset.
External Threats. External threats might have an im-
pact on the generalizability of our proposal. The se-
lected projects are open-source projects, written in the
Java language that use the Spring framework. Con-
tributors might be mainly Java developers. Moreover,
three metrics used in our dataset (DE LSAM, AD DSAM,
CH U R NSAM) are specific to the Spring framework and
this paper focuses exclusively on two levels of ex-
perience (experienced or not). These characteristics
might impede the generalization of our proposal to
projects written in different programming languages,
using other technologies or employing contributors
ENASE 2022 - 17th International Conference on Evaluation of Novel Approaches to Software Engineering
450
(a) SHAP values for each classified instance. (b) Mean SHAP values.
Figure 4: SHAP values for the 23 features.
with different profiles. Such alternate studies still are
perspective works.
6 CONCLUSION
This paper proposes an approach to mine experienced
developers in open-source projects using metrics and
supervised learning. Firstly, it builds a dataset of
project contributors and define a binary classification
process to discriminate between experienced devel-
opers and non-experienced developers. Contributors
are extracted from 17 open-source projects and 23
metrics evaluated for each of them. The dataset is
then manually labeled with the experience of con-
tributors in each project, as needed by supervised
learning. Data is then processed (log transformation
and scaling) to ease its interpretation by classification
algorithms. As the dataset is strongly imbalanced,
synthetic data generation is also performed (with the
SMOTE method) to create synthetic profiles of expe-
rienced contributors as a compensation. Six super-
vised classification algorithm are then benchmarked.
The RF classifier provides the best results showing
both a good F1 measure (0.7887) and a good accu-
racy (0.8607). The balance between recall (0.7446)
and precision (0.8390) is fairly equitable. The ex-
plainability of our classifier shows that the metrics
that have the most influence on the classification are
the number of lines of code and the churn of lines of
code. Contrary to our intuition, the metrics related to
the Spring architecture have very little influence on
the classifier’s decision. The number of files added,
the number of commits and the variables related to the
Java structure are among those with a medium influ-
ence. This could indirectly mean that experienced de-
velopers make a lot of of changes to the project struc-
ture but that contributing to the runtime architecture
is a very specific task only devoted to architects.
This work opens many perspectives. A first idea
is to improve the genericity of our approach by train-
ing a technology-agnostic classifiers. To do so means
both collecting technology-independant metrics and
extracting contributors from projects that use other
programming languages. A second perspective is to
study the correlation between the number of experi-
enced developers in a given project and project qual-
ity using project-level software metrics.
REFERENCES
Archambault, A. and Grudin, J. (2012). A longitudinal
study of facebook, linkedin, & twitter use. In Kon-
stan, J. A., Chi, E. H., and H
¨
o
¨
ok, K., editors, 30th
CHI, pages 2741–2750, Austin, USA. ACM.
Mining Experienced Developers in Open-source Projects
451

Booch, G. (1996). Object solutions: managing the object-
oriented project. Addison-Wesley.
Breiman, L. (2001). Random forests. Machine Learning,
45(1):5–32.
Chawla, N. V., Bowyer, K. W., Hall, L. O., and Kegelmeyer,
W. P. (2002). SMOTE: synthetic minority over-
sampling technique. Journal Of Artificial Intelligence
Research, 16:321–357.
Cook, C., Heath, F., and Thompson, R. L. (2000). A
meta-analysis of response rates in web-or internet-
based surveys. Educational and psychological mea-
surement, 60(6):821–836.
Di Bella, E., Sillitti, A., and Succi, G. (2013). A multivari-
ate classification of open source developers. Informa-
tion Sciences, 221:72–83.
dos Santos, A. L., de A. Souza, M. R., Oliveira, J., and
Figueiredo, E. (2018). Mining software repositories
to identify library experts. In 7th SBCARS, pages 83–
91, Sao Carlos, Brazil. ACM.
Douzas, G., Bac¸
˜
ao, F., and Last, F. (2018). Improving
imbalanced learning through a heuristic oversampling
method based on k-means and SMOTE. Information
Science, 465:1–20.
Dudjak, M. and Martinovi
´
c, G. (2020). In-depth perfor-
mance analysis of SMOTE-based oversampling algo-
rithms in binary classification. International Jour-
nal of Electrical and Computer Engineering Systems,
11(1):13–23.
Greene, G. J. and Fischer, B. (2016). CVExplorer: Iden-
tifying candidate developers by mining and exploring
their open source contributions. In 31st IEEE/ACM
ASE, pages 804–809, Singapore, Singapore. ACM.
Hauff, C. and Gousios, G. (2015). Matching GitHub de-
veloper profiles to job advertisements. In 12th MSR,
pages 362–366, Florence, Italy. IEEE.
Hooker, G. and Mentch, L. (2019). Please stop per-
muting features: An explanation and alternatives.
arXiv:1905.03151.
Izquierdo-Cortazar, D., Robles, G., Ortega, F., and
Gonz
´
alez-Barahona, J. M. (2009). Using software
archaeology to measure knowledge loss in software
projects due to developer turnover. In 42st HICSS,
pages 1–10, Waikoloa, USA. IEEE.
Kagdi, H. H., Hammad, M., and Maletic, J. I. (2008). Who
can help me with this source code change? In 24th
ICSM, pages 157–166, Beijing, China. IEEE Com-
puter Society.
Kruchten, P. (1999). The software architect. In 1st WICSA,
volume 140 of IFIP Conference Proceedings, pages
565–584, San Antonio, USA. Kluwer.
Lars Buitinck, e. (2013). API design for machine learning
software: experiences from the scikit-learn project. In
ECML PKDD Workshop: Languages for Data Min-
ing and Machine Learning, pages 108–122, Prague,
Czech Republic. Springer.
Lundberg, S. M. and Lee, S. (2017). A unified approach to
interpreting model predictions. In 30th NIPS, pages
4765–4774, Long Beach, USA.
Mockus, A. and Herbsleb, J. D. (2002). Expertise browser:
a quantitative approach to identifying expertise. In
24th ICSE, pages 503–512, Orlando, USA. ACM.
Moscato, V., Picariello, A., and Sperl
`
ı, G. (2021). A
benchmark of machine learning approaches for credit
score prediction. Expert Systems with Applications,
165:113986.
Nakakoji, K., Yamamoto, Y., Nishinaka, Y., Kishida, K.,
and Ye, Y. (2002). Evolution patterns of open-source
software systems and communities. In 5th IWPSE @
24th ICSE, pages 76–85, Orlando, USA. ACM.
Perez, Q., Le Borgne, A., Urtado, C., and Vauttier, S.
(2021). Towards Profiling Runtime Architecture Code
Contributors in Software Projects. In 16th ENASE,
pages 429–436, Online.
Ribeiro, M. T., Singh, S., and Guestrin, C. (2016). ”why
should I trust you?”: Explaining the predictions of any
classifier. In 22nd SIGKDD, pages 1135–1144, San
Francisco, USA. ACM.
Ribeiro, M. T., Singh, S., and Guestrin, C. (2018). Anchors:
High-precision model-agnostic explanations. In 32nd
AAAI, pages 1527–1535, New Orleans, USA. AAAI
Press.
Schuler, D. and Zimmermann, T. (2008). Mining usage ex-
pertise from version archives. In 5th MSR, pages 121–
124, Leipzig, Germany. ACM.
Shapley, L. S. (1953). A value for n-person games. Contri-
butions to the Theory of Games, 2(28):307–317.
Sindhgatta, R. (2008). Identifying domain expertise of de-
velopers from source code. In 14th SIGKDD KDD,
pages 981–989, Las Vegas, USA. ACM.
Spadini, D., Aniche, M., and Bacchelli, A. (2018). Py-
Driller: Python framework for mining software repos-
itories. In 26th ESEC/FSE, pages 908–911, New York,
USA. ACM Press.
Teyton, C., Falleri, J., Morandat, F., and Blanc, X. (2013).
Find your library experts. In 20th WCRE, pages 202–
211, Koblenz, Germany. IEEE.
Teyton, C., Palyart, M., Falleri, J.-R., Morandat, F., and
Blanc, X. (2014). Automatic extraction of developer
expertise. In 18th EASE, pages 1–10, London, UK.
ACM.
Tse, A. C. (1998). Comparing response rate, response speed
and response quality of two methods of sending ques-
tionnaires: e-mail vs. mail. Market Research Society
Journal, 40(4):1–12.
Zheng, A. and Casari, A. (2018). Feature engineering for
machine learning: principles and techniques for data
scientists. O’Reilly.
ENASE 2022 - 17th International Conference on Evaluation of Novel Approaches to Software Engineering
452
