
Mobile Games at the Edge: A Performance Evaluation to Guide
Resource Capacity Planning
Gabriel Araújo
2
, Carlos Brito
2
, Leonel Correia
2
, Tuan Anh Nguyen
1,∗
,
Jae Woo Lee
1,∗
and Francisco Airton Silva
2
1
Konkuk Aerospace Design-Airworthiness Research Institute (KADA), Konkuk University, Seoul, South Korea
2
Federal University of Piauí (UFPI), Picos, PI, Brazil
Keywords:
Mobile Edge Computing, Online Gaming Services, Queuing Models, Performance Evaluation, Quality of
Service.
Abstract:
Mobile games are very popular among young generations, especially during the worldwide Covid-19 pan-
demic. The pandemic has caused an enormous increase in data transactions and computation over the Internet.
Computing for games often consumes a vast amount of computational resources. Nowadays, mobile devices
require heavy computing tasks. For this reason, edge computing resources are essentially needed in the game
industry for non-latency data transactions. However, edge computing involves many aspects that make its
architecture highly complex to evaluate. Pure performance evaluation of such computing systems is necessary
for real-world mobile edge computing systems (MEC) in the game industry. This paper proposes a closed
queuing network to evaluate the performance of a game execution scenario in MEC. The model permits the
evaluation of the following metrics: mean response time, drop rate, and utilization level. The results indicate
that the variation in the number of physical machines (PM) and virtual machines (VM) has a similar impact
on the system’s overall performance. The results also show that dropped messages can be avoided by making
small calibrations on the capabilities of the VM/PM resources. Finally, this study seeks to assist the develop-
ment of game computing systems at MEC without the need for prior expenses with real infrastructures.
1 INTRODUCTION
Online games are extremely profitable in the enter-
tainment industry nowadays. According to Statista
1
Mobile games are the most popular apps on mobile
devices, with time spent on mobile devices growing
by 26% in the year 2021. According to Newzoo’s
Global Games Market Report, the mobile games mar-
ket generated revenue of $68.5 billion in 2019 and
is expected to generate revenue of $95.4 billion in
2022 (Wijman, 2019). This billion-dollar market cor-
responds to one of the most active sectors in software
development. The quality of service (QoS) require-
ments for software/hardware infrastructures to host
online game services are stringent to secure game
data transactions with uninterrupted availability and
high performance. However, mobile devices are of-
ten featured by limited processing and storage capac-
ity. Due to these constraints, mobile devices become
∗
Corresponding author
1
https://www.statista.com/statistics/1272220/
time-spent-mobile-apps-worldwide-by-category/
rapidly obsolete, and hard to host state-of-the-art re-
leases of new games. Therefore, emerging comput-
ing paradigms have come into play as alternative so-
lutions for limited mobile devices’ computational re-
sources.
Mobile cloud computing (MCC) has been a dom-
inant computing paradigm for mobile gaming in the
past years. MCC has been permitted to render games
remotely in the cloud and transmitted back to play-
ers (Zhang et al., 2019). This alternative allows play-
ers to start games immediately, without downloads
and time-consuming software installations (Li et al.,
2018). Besides, MCC brings advantages to game de-
velopers such as cost savings, platform independence,
resource enhancement, and piracy prevention (Yates
et al., 2017). Developing efficient gaming systems is
required to diminish the latency of a player’s gaming
interaction from her gaming device to the end com-
puting centers. To satisfy strict requirements to re-
duce gaming latency, mobile edge computing (MEC)
comes into play to bring the computing and storage
capabilities even closer to mobile devices (Carvalho
238
Araújo, G., Brito, C., Correia, L., Nguyen, T., Lee, J. and Silva, F.
Mobile Games at the Edge: A Performance Evaluation to Guide Resource Capacity Planning.
DOI: 10.5220/0011071200003200
In Proceedings of the 12th International Conference on Cloud Computing and Services Science (CLOSER 2022), pages 238-245
ISBN: 978-989-758-570-8; ISSN: 2184-5042
Copyright
c
2022 by SCITEPRESS – Science and Technology Publications, Lda. All rights reserved

et al., 2020).
Performance evaluation is essential to guarantee
an optimized game system execution at the edge.
MEC performance evaluation is often required even
before developing the real-world system. However,
carrying out real experiments is usually expensive,
time-consuming, and often calls for a third-party
organization involvement. Aiming to reduce costs
in developing complex computational systems, here
specifically for gaming, analytical models are of-
ten adopted to forecast the future system behaviors
(Willig, 1999). Queuing models, for example, enable
the assessment of different performance metrics of a
targeted, practical system. More specifically, queuing
modeling can predict the effect of resource contain-
ment and variation on system performance through
different metrics, such as drop rate, the mean response
time (MRT), mean number of users, and others (Co-
hen and Boxma, 1985).
Studies in the literature showed significant
progress in the assessment of gaming cloud and edge
infrastructures using analytical models (Hains et al.,
; Lee et al., 2015; Li et al., 2017; Li et al., 2018;
Marzolla et al., 2012; Wu et al., 2015; Yates et al.,
2017). Among the studies mentioned above, exclu-
sively the work (Hains et al., ) performed a game
performance assessment at MEC considering only the
MRT metric. The performance modeling and evalua-
tion of the gaming system coupled with the edge com-
puting paradigm is of paramount importance even in
advance the real-world system development.
This paper proposes a closed-loop queue-based
performance evaluation model that captures the
fundamental pure-performance behaviors of data
transactions in MEC. The model enables game de-
signers at the edge to analyze the impact of changes in
system performance even during design stages. The
model is highly adjustable, allowing the configuration
of several parameters such as transmission time, ser-
vice time, queue size, and resource capacities. We
have conducted a sensitivity analysis combining var-
ious factors to determine which ones have the most
significant impact on the system’s response time. The
number of virtual machines (VMs) and physical ma-
chines (PMs) were the most sensitive factors, causing
a significant impact on the system’s response time.
We have also explored a resource capacity variation
that works as a practical guide for performance anal-
ysis in a gaming execution scenario at the edge with
the proposed model. To the best of our knowledge,
this study is unique in the research area on adopt-
ing queuing models for performance evaluation of a
MEC-based gaming system.
2 RELATED WORK
This section presents the related work. The papers
have proposed different analytical models (e.g., Petri
net, Markov chain, queuing networks) to evaluate the
performance of various architectures in the cloud or
edge infrastructures. Table 1 details the comparison
of selected works with our study.
Metrics - All papers used different performance met-
rics to evaluate their proposals. A wide number of
metrics are important to understand how the system
behaves. Yates et al., 2017 proposes a model for cloud
gaming systems to optimize low latency video frame
rate updates. Hains et al., features a client/server so-
lution designed to improve network conditions with
games online that use remote centralized servers to
improve game connection stability. However, the pa-
pers by (Yates et al., 2017), and (Hains et al., ) only
used the analysis metrics of mean age and MRT, re-
spectively. While in (Li et al., 2017; Li et al., 2018),
the authors have focused only on a normalized cost
metric. The work (Wu et al., 2015) presented a new
transmission programming structure to guarantee the
quality of delivery of videos with high frame rates
in mobile cloud gaming scenarios. Lee et al., 2015
proposed a speculative execution system for mobile
cloud games. Wu et al., 2015 and Lee et al., 2015
have used metrics of service quality and processing
time, respectively. However, the studies of Yates
et al., 2017, Li et al., 2017, Li et al., 2017, Wu et al.,
2015, and Lee et al., 2015 did not consider metrics
such as resource utilization and the number of re-
quests in their systems to optimize their performance.
Jittawiriyanukoon, 2014 developed a queuing model
that is considered a reliable data scheduler. However,
the authors did not concern some other critical perfor-
mance metrics such as drop rate. Our proposal assimi-
lates critical performance metrics of a gaming system,
including mean response time (MRT), resource uti-
lization, number of requests in the system, and request
drop rate. Such metrics were not investigated system-
atically and comprehensively by any related studies.
Load Balance - The vast majority of related studies
in literature did not consider essential techniques to
balance the workload of their architectures. Only two
studies (Marzolla et al., 2012) and (Song et al., 2016)
used load balancing in their proposals. Marzolla et al.,
2012 used load balance to evenly distribute requests
between servers in a zone controller, which is a soft-
ware component responsible for handling all interac-
tions between players and the virtual world. Song
et al., 2016 proposed an approach based on queuing
theory for task management and a heuristic algorithm
for resource management. Song et al., 2016 com-
Mobile Games at the Edge: A Performance Evaluation to Guide Resource Capacity Planning
239

Table 1: Comparison of selected works.
Title Application
Context
Metrics Architecture Load Bal-
ance
Capacity
Evalua-
tion
(Marzolla et al., 2012) Games Mean response time and number of users online Cloud ë
(Nan et al., 2014) Multimedia Mean response time and resource cost Cloud ë
(Jittawiriyanukoon,
2014)
Multimedia Mean queue length, utilization, mean waiting time in queue,
throughput and mean traversal time
Cloud ë ë
(Song et al., 2016) Multimedia Average task waiting time and Cumulative Cost Cloud ë
(Wu et al., 2015) Games Peak signalto-ratio, output and end-to-end delay Cloud ë
(Lee et al., 2015) Games Client frame time, throughput and processing time Cloud ë ë
(Yates et al., 2017) Games Average age Cloud ë ë
(Li et al., 2017) Games Monetary Cost Cloud ë
(Li et al., 2018) Games Monetary Cost Cloud ë
(Hains et al., ) Games Mean response time MEC ë ë
Our Work Games Mean response time, utilization, system number of messages,
throughput and drop rate
MEC
pared load balancing with three other approaches to
show the effectiveness of their approach. Our work
uses load balance to control the workload among the
queues.
Capacity Evaluation - Li et al., 2017 addressed the
problem of server provisioning for the cloud in the
gaming context. This work assessed the server’s abil-
ity to discover its influence on the performance of the
proposed algorithms. Li et al., 2018 used the capac-
ity assessment to determine which of the servers has
enough residual capacity to host a game instance. As
we observed, these works focused on evaluating per-
formance, focusing only on cost. Our work used ca-
pacity assessment in conjunction with load balancing
to better system resources distribution.
3 AN MEC-BASED GAMING
SCENARIO
Figure 1 shows an overview of the scenario for exe-
cuting games at the MEC. The proposed scenario is
based on the architectures presented in (El Kafhali
et al., 2020) and (Carvalho et al., 2020).
PM N
PM
Gateway N
PM 2
PM 1
VM K
Front-End
PM
Gateway 2
Edge
Gateway
Players
PM
Gateway 1
VM 1
VM K
VM 1
VM K
VM 1
Edge
Computing
Figure 1: Evaluated scenario: executing games on mobile
edge computing.
Players request gaming services for the Front-End
machine, which distributes gaming requests among
the edge components. Requests are generated by
games executing on mobile devices and may vary ac-
cording to the game context and the user’s number.
Therefore, low proximity to servers is required to pro-
vide efficient resource availability and a low mean re-
sponse time.
The Front-End machine receives gaming requests
from mobile devices. The Front-End re-transmit the
requests to the physical machines (PMs) through an
edge gateway. These requests can be, for example,
gaming character movement commands. In addition
to efficiently redirecting traffic to PMs, the gateway
is responsible for data aggregation and load balanc-
ing. The PMs, in turn, offer a high level of process-
ing and storage, with several virtual machines (VMs)
allocated for the requests processing. Each PM is as-
sociated with a gateway that distributes and performs
load balancing to respective VM nodes. Each VM re-
ceives and processes a request and then forwards it
back to the players. Some assumptions were traced
regarding the evaluated scenario.
• Edge
– [e1]: Some details about communication be-
tween devices are not our main focus to
simplify the modeling drawbacks. For in-
stance, hand-shaking mechanisms, communi-
cation protocols, or other minor data trans-
fer times between internal components. These
times can be encompassed by the transmission
and service times of the most general system
components.
– [e2]: Requests are independent from each
other, and therefore the requests arrival com-
plies with exponential distribution with an spe-
cific arrival rate λ (Song et al., 2016; Li
et al., 2018; Jittawiriyanukoon, 2014; Lee
CLOSER 2022 - 12th International Conference on Cloud Computing and Services Science
240

et al., 2015; Li et al., 2017). Our model
can be extended and adopted when other non-
exponential types of arrival distribution are
considered, such as Erlang or Weibull distribu-
tions (Azaron et al., 2006; Grottke et al., 2010).
In these cases, the assumption can be relaxed
since the arrival time can be split into multi-
phases of exponential distribution (Castet and
Saleh, 2009).
– [e3]: Different load balancing techniques in
this layer are not taken into account. Since load
balancing is not the focus of the assessment, re-
quests received through the edge gateways and
PMs are equally distributed to each PM and
VM node, respectively.
– [e4]: A homogeneous scenario was considered.
All PMs and VMs have identical resources and
processing capacities, while data processing is
independent of each other. Each PM and VM
node can have a multi-core CPU for parallel
processing. The role of data storage in the bor-
der layer was not considered.
– [e5]: Edge-layer virtual machines can have
multiple cores for parallel processing similarly
in modern cloud centers. The edge layer can
scale elastically and balance the access load of
several remote customers on a multi-core VM.
• Evaluation
– [s1]: The pure performance of executing games
on edge is the main focus of the modeling.
Therefore, the involvement of physical compo-
nents and their operational availability is mini-
mized. Component failure and recovery behav-
iors are not considered in modeling for perfor-
mance evaluation.
– [s2]: The goal of this work is twofold: (i)
exploring the bottleneck of supportive game
architectures considered in real-time player
data transmission, (ii) exploring the impact of
changing the configuration of PMs and VMs
on the edge layer for performance metrics and
(iii) to realize the performance-related trade-
offs between local players and distant players.
Therefore, the complexity of the proposed gen-
eral scenario is reduced to simplify the perfor-
mance models using the queuing network the-
ory.
4 QUEUING MODEL
This section presents the closed queue model to rep-
resent data transactions throughout the gaming sys-
tem in the scenario presented in the previous section.
In a cyclic queuing model, the number of requests
N is fixed since requests go through the N stages
repeatedly with no allowed entries or exits. There
are Ni parallel exponential servers at the nth stage,
all with the same mean service time µi (Gordon and
Newell, 1967). When the service is completed at the
i stage, a request proceeds directly to the j stage with
probability p
i j
. These cyclical models are stochasti-
cally equivalent to open systems in which the num-
ber of requests cannot exceed N. Equilibrium equa-
tions for the joint probability distribution of requests
are solved by a variable separation technique (Gordon
and Newell, 1967).
Figure 2 illustrates the proposed model for the
evaluated scenario. All model components follow
the same name standards used to describe the gam-
ing scenario. The data flow occurs from left to right.
Players generate requests within a predefined time in-
terval following a particular exponential distribution.
These requests are sent to the Front-End queue and
then to PMs with a uniform distribution through the
edge gateways. Since the random distribution is ex-
tremely fast, such time is not considered in this paper.
Front-End
PM 2
.
.
.
PM N
.
.
.
Players
Edge
Gateway
PM
Gateway
2
PM
Gateway
N
PM
Gateway
1
PM 1
.
.
.
VM 1
.
.
.
VM K
.
.
.
VM 1
VM 1
.
.
.
VM K
.
.
.
VM 1
VM 1
.
.
.
VM K
.
.
.
VM 1
Playout
Delay
Figure 2: Queuing model for executing games on mobile
edge computing.
In each PM has K VM queues that will carry out
requests. There are also N gateways for each PM.
These gateways transmit the requests to the VMs,
then they are forwarded back to the players. The
play-out delay simulates the time taken by the player
to decode and display the frame on his screen. It
has no specific service; it is only one component that
causes a delay in transmitting a request. After the re-
sponse reaches the client, new requests are generated
in a cyclic scheme. It is assumed that the received
data will be processed considering a queue rule Fist-
In-First-Out (FIFO). The Front-End, PM, and VM
queues are modeled considering the M/M/c/K queue
model. The main parameters of such stations are
queue size, service time, and the number of internal
servers, which, in this work, correspond to the num-
Mobile Games at the Edge: A Performance Evaluation to Guide Resource Capacity Planning
241

ber of processing cores. The M/M/c/K queue model
means the queue size is K shared by c service stations.
5 PERFORMANCE EVALUATION
This section presents a performance evaluation of the
proposed queuing model. The section is divided into
two parts. Section 5.1 presents a sensitivity analy-
sis to identify the parameters with the greatest impact
on the system. Finally, based on the variation of the
parameters with the greatest impact, several perfor-
mance metrics are observed in Section 5.2.
5.1 Sensitivity Analysis
This section presents a study of sensitivity analysis
using the DoE method. The execution of the Design
of Experiments (DoE) seeks to identify the factors
that most influence the system. The MRT has been
chosen as the dependent variable in this analysis be-
cause it is the most perceptive aspect to the final user.
The analysis was performed using the system param-
eters as factors. Therefore, the adopted factors were:
VMs number, PMs number, VM queue size, and VM
service time. Table 2 presents the fixed parameters.
Table 3 shows the DoE factors and levels. According
to the previous analysis, the minimum (level 1) and
maximum (level 2) values have been changed, look-
ing for levels with the greatest impact on the MRT.
Table 4 show all combinations of factors and respec-
tive levels. Sixteen combinations were generated (2-
level design). Every combination was executed thir-
teen times. The MRT means of each combination is
also identified in Table 4.
Table 2: Fixed parameters used in DoE.
Parameters Values
Number of Requests 400
Front-End Queue Size 1000
PM Queue Size 1000
Front-End Service Time 10 ms
PM Service Time 20 ms
Users Service Time 10 ms
Playout Service Time 23 ms
Number of Front-End Cores 16
Number of PM Cores 16
Number of VMs Cores 6
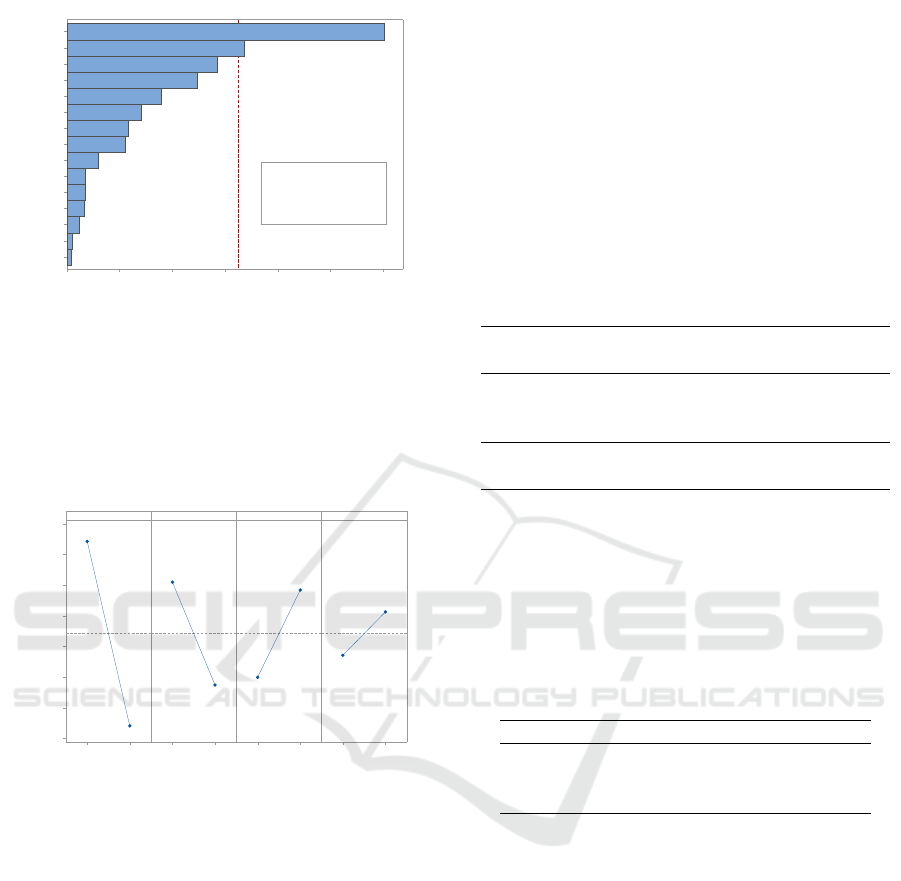
Figure 3 presents the Pareto chart, which analyzes
the impact of each factor on the MRT. The higher
the bar, the greater the impact of that factor on the
dependent metric. The Pareto chart shows the non-
standardized effects and uses Lenth’s method to draw
Table 3: Factors and respective levels.
Factors Level 1 Level 2
VM Service Time 32 (ms) 42 (ms)
VM Queue Size 150 250
Number of PM 1 2
Number of VMs 1 4
Table 4: Combination of factors and levels.
Combinations VM
Ser-
vice
Time
(ms)
VM
Queue
Size
Number
of
VMs
Number
of
PMs
Calculated
MRT
(ms)
#1 32 150 1 1 289.40
#2 32 150 4 1 293.62
#3 32 150 1 2 555.97
#4 32 150 4 2 917.54
#5 32 250 1 1 274.09
#6 32 250 4 1 1333.07
#7 32 250 1 2 1750.64
#8 32 250 4 2 251.97
#9 42 150 1 1 802.58
#10 42 150 4 1 480.93
#11 42 150 1 2 475.93
#12 42 150 4 2 342.82
#13 42 250 1 1 316.89
#14 42 250 4 1 1051.26
#15 42 250 1 2 698.01
#16 42 250 4 2 434.56
a red reference line for statistical significance. The
Pareto chart identifies important effects using Lenth’s
pseudo standard error (PSE). The red line of the
Pareto chart is drawn at the margin of error, which
is: ME = t × PSE where t is the (1 − α/2) quantile
of a t-distribution with degrees of freedom equal to
the (number of effects/3) (Mathews, 2005). The num-
ber of VMs is the factor with the greatest impact, fol-
lowed by the number of PMs. The number of VMs
and PMs significantly impacts MRT with statistical
confidence, as both go beyond the red line. The VM
service time and the VM queue size have a lower im-
pact than the number of PMs and VMs. The interac-
tion between the factors (e.g., AB and AC) was not
highly significant.
Figure 4 shows the main effects graph. The mean
values obtained in the main effects graph allow us to
know the results considering all possible factor com-
binations. Thus, the evaluator can better design the
system in anticipation of any scenario. The y-axis
represents the MRTs means for each level. The num-
ber of VMs factor has the greatest impact, with the
most inclined line. The VMs factor obtained an MRT
of 942.95 ms in its first level (1 VM). In the second
CLOSER 2022 - 12th International Conference on Cloud Computing and Services Science
242
Factor
BCD
ABCD
BD
ACD
CD
ABC
ABD
AD
BC
D
AC
AB
C
B
A
6005004003002001000
A Number of VMs
B Number of PMs
C VM Queue Size
D VM Service Time
Factor Name
Effect
325,6
Figure 3: Impact of system factors on MRT.
level (4 VMs), the MRT was 340.72 ms. The varia-
tion in the number of VMs resulted in a considerable
change to the system’s MRT, with a difference of ap-
proximately 602.22 ms. The variation of the other
factors was relatively small. The VM service time,
for example, obtained a variation of 180 ms.
41
1000
900
800
700
600
500
400
300
21 250150 4232
N
u
m
b
e
r
o
f
V
M
s
Mean
N
u
m
b
e
r
o
f
P
M
s
V
M
Q
u
e
u
e
S
i
z
e
V
M
S
e
r
v
i
c
e
T
i
m
e
Figure 4: Main effect of system factors.
The DoE has evidenced that the number of pro-
cessing nodes (VMs and PMs) is the most relevant
aspect of the architecture. Therefore, the following
section considers such information and performs two
groups of numerical analyses by varying PMs and
VMs numbers according to different arrival rates.
5.2 Numerical Analysis - VM Capacity
Variation
This section presents a set of analyses using the pro-
posed model to evaluate the following scenario: vari-
ation of the VM nodes. The Java Modeling Tools
(JMT) (Bertoli et al., 2009) tool was used to model
and evaluate the proposed scenario. JMT is an open-
source toolkit for analyzing and evaluating the per-
formance of communication systems, based mainly
on the queue theory (Fishman, 2013). We consider
the system’s parameters used in (Gopika Premsankar
and Taleb, 2018) as input parameters for our model.
Gopika’s work evaluated a MEC architecture with a
single mobile device as a client and containers exe-
cuting the services. Still, they evaluated a 3D game
called Neverball, where the player must tilt the floor
to control the ball to collect the coins and reach an
exit point before time runs out. Table 5 shows the in-
put parameters used for each component of the model,
including queuing capacity. The X indicates that the
component does not have a capacity definition for the
station in turn. The number of requests was varied
from 10 to 750 in the simulations.
Table 5: Fixed Input parameters.
Component
Type
Component Time
(ms)
Queue
Size
Number
of Cores
Machine
Front-End 10.0 1000 16
PM 20.0 1000 16
VM 32.0 250 6
Delay
Users 10.0 X X
Playout 23.0 X X
This scenario analyzes the model, varying the
number of resources in the VM layer. Table 6 presents
the configuration used in the experiments in scenario
A. VMs varied from 1 to 4 nodes, keeping the val-
ues fixed for the other components. We use 2 PMs in
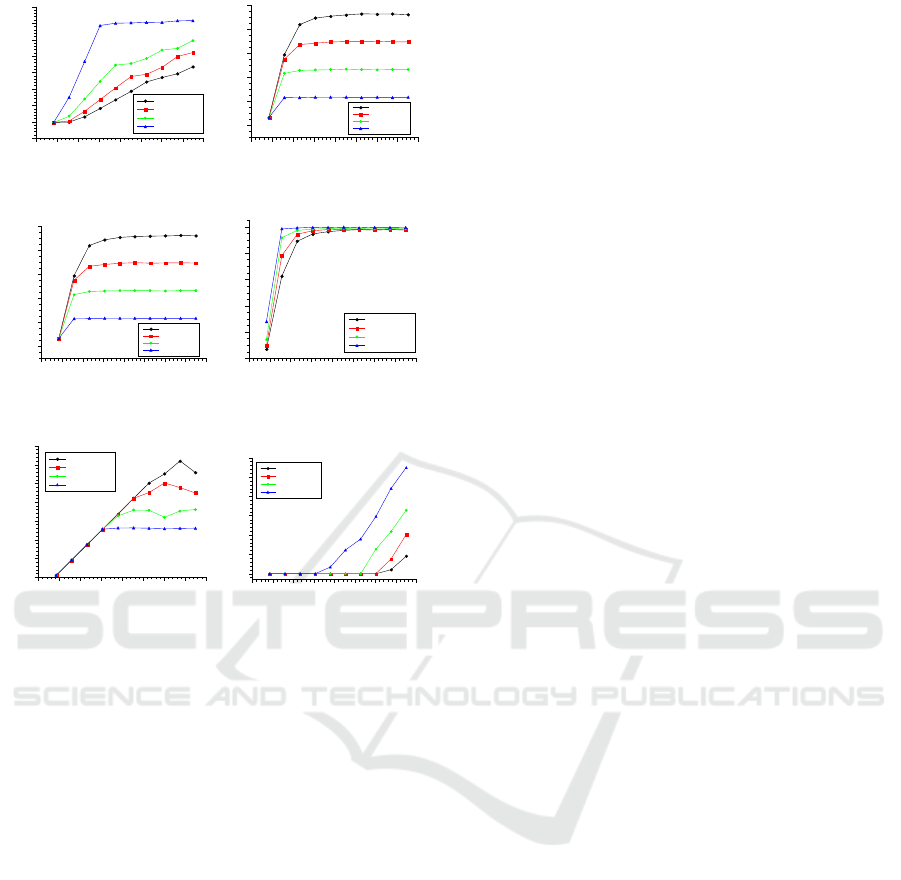
this scenario. Figure 5 presents the results consider-
ing different numbers of VM nodes.
Table 6: Varied Parameters - Scenario A.
Component Number of Machines
FrontEnd 1
PM 2
VM 1/2/3/4
Figure 5(a) shows the results as a function of the
mean response time (MRT). Although the MRT has
similar behavior for 2, 3, and 4 VMs, the greater the
VMs, the lower the MRT to process the same num-
ber of requests in a homogeneous scenario. We ob-
served a variation of 90ms of difference for 750 re-
quests. Already considering a single VM, we have
a discrepant behavior, with an MRT close to 720ms,
due to the VM’s low level of resource at this point.
With this saturation, the loss of messages begins (see
drop rate in Figure 5(f)). In other cases, the variation
was from about 390ms (4 VMs) to about 575ms (2
VMs). Therefore, the increase in the number of VMs
positively impacts response time.
Figures 5(b) and 5(c) show the use of Front-End
and PMs, respectively. They showed an identical be-
havior: the greater the number of requests processed,
the greater the utilization percentage. Therefore, a
Mobile Games at the Edge: A Performance Evaluation to Guide Resource Capacity Planning
243
Mean Response Time (ms)
0
100
200
300
400
500
600
700
800
Number of Requests
0 100 200 300 400 500 600 700 800
4 VMs per PM
3 VMs per PM
2 VMs per PM
1 VM per PM
(a) MRT
Front-End Utilization (%)
0
20
40
60
80
100
Number of Requests
0 100 200 300 400 500 600 700 800
4 VMs per PM
3 VMs per PM
2 VMs per PM
1 VM per PM
(b) Front-End Utilization
PM Utilization (%)
0
20
40
60
80
100
Number of Requests
0 100 200 300 400 500 600 700 800
4 VMs Server
3 VMs Server
2 VMs Server
1 VM Server
(c) PM Utilization
VM Utilization (%)
0
20
40
60
80
100
Number of Requests
0 100 200 300 400 500 600 700 800
4 VMs per PM
3 VMs per PM
2 VMs per PM
1 VM per PM
(d) VM Utilization
System Number of Requests
0
100
200
300
400
500
600
700
Number of Requests
0 100 200 300 400 500 600 700 800
4 VMs per PM
3 VMs per PM
2 VMs per PM
1 VM per PM
(e) Number of requisitions in
the system
System Drop Rate (j/ms)
0
0.001
0.002
0.003
0.004
0.005
0.006
Number of Requests
0 100 200 300 400 500 600 700 800
4 VMs per PM
3 VMs per PM
2 VMs per PM
1 VM per PM
(f) Drop Rate
Figure 5: Results for the analysis of the variation of the VM
nodes.
smaller number of VMs implies a smaller number
of requests processed and, consequently, less use and
greater drop of messages (see Figure 5(f)). After 200
requests, all scenarios were saturated. It is impor-
tant to note that such saturation does not represent the
maximum utilization of the node’s capacity. Only the
node with 4 VMs approached the maximum capacity,
while the others had their utilization rate varying from
22% to 64%.
Figure 5(d) shows the use of VMs. Again, the
greater the number of requests, the greater the uti-
lization. However, unlike Front-End and PMs, as
the amount of resources increases, usage decreases.
VMs only process requests that have passed through
the Front-End and the PMs; fewer requests arrive and
process everything that arrives. Besides, the process-
ing capacity of VMs is less than Front-End and PMs.
All nodes approach the maximum utilization capacity
(100%) up to 500 requests, where nodes with fewer
resources reach this capacity faster. After 500 re-
quests, all nodes remain saturated and constant.
Figure 5(e) shows the number of requests within
the system. The greater the capacity of the nodes,
the greater the number of requests within the system.
Therefore, the node with 4 VMs can handle a maxi-
mum number of requests equal to 640, dropping more
than 100. While the node with 1 VM serves a maxi-
mum of 280 requests. Therefore, although many VMs
increase the number of requests in the system, many
losses still occur.
Finally, Figure 5(f) shows the rate of system re-
quest drops. The increase in the drop rate is directly
proportional to the arrival of requests. The smaller the
number of VMs, the higher the drop rate. Initially, ev-
erything that arrives is attended by all nodes, however,
when the number of requests exceeds 300, losses start
to occur. The node with 1 VM (worst case) reaches
a drop rate of almost 0.006 j/ms. In the best case (4
VMs), the drop rate is less than 0.001 j/ms. The in-
crease in the drop rate is caused by the depletion of
resources on the VM nodes and is reflected in sev-
eral system metrics. Nodes with 3 and 4 VMs have
dropped requests from 600 requests. These nodes
have a similar drop rate. Therefore, the node with 3
VMs may be a more advantageous option than the one
with four concerning the drop rate in this scenario.
6 CONCLUSION AND FUTURE
WORKS
This work proposed a closed queue model to represent
and evaluate the performance of a game execution
scenario in mobile edge computing. The relationship
between the number of players and the VM/PM ca-
pacity variation is evidenced from different perspec-
tives. The results show that the variation of PMs and
VMs has a significant impact on the system’s overall
performance. The results also show that dropped mes-
sages can be avoided by making small calibrations on
the capabilities of the VM/PM resources. As future
work, we intend to extend the model to explore dif-
ferent types of communication between the compo-
nents. More elements can also be included, such as
cloud components for creating a hybrid model with a
border layer and a cloud layer.
ACKNOWLEDGMENTS
This research was supported by Basic Science Re-
search Program through the National Research Foun-
dation of Korea(NRF) funded by the Ministry of Ed-
ucation (No. 2020R1A6A1A03046811).
CLOSER 2022 - 12th International Conference on Cloud Computing and Services Science
244

REFERENCES
Azaron, A., Katagiri, H., Kato, K., and Sakawa, M.
(2006). Reliability evaluation of multi-component
cold-standby redundant systems. Applied Mathemat-
ics and Computation, 173(1):137–149.
Bertoli, M., Casale, G., and Serazzi, G. (2009). Jmt:
performance engineering tools for system modeling.
ACM SIGMETRICS Performance Evaluation Review,
36(4):10–15.
Carvalho, D., Rodrigues, L., Endo, P. T., Kosta, S., and
Silva, F. A. (2020). Mobile edge computing perfor-
mance evaluation using stochastic petri nets. In 2020
IEEE Symposium on Computers and Communications
(ISCC), pages 1–6. IEEE.
Castet, J.-F. and Saleh, J. H. (2009). Satellite and satellite
subsystems reliability: Statistical data analysis and
modeling. Reliability Engineering & System Safety,
94(11):1718–1728.
Cohen, J. and Boxma, O. (1985). A survey of the evolution
of queueing theory. Statistica neerlandica, 39(2):143–
158.
El Kafhali, S., El Mir, I., Salah, K., and Hanini, M. (2020).
Dynamic scalability model for containerized cloud
services. Arabian Journal for Science and Engineer-
ing, 45(12):10693–10708.
Fishman, G. S. (2013). Discrete-event simulation: model-
ing, programming, and analysis. Springer Science &
Business Media.
Gopika Premsankar, M. d. F. and Taleb, T. (2018). Edge
computing for the internet of things: A case study.
5:1275–1284.
Gordon, W. J. and Newell, G. F. (1967). Closed queu-
ing systems with exponential servers. Operations re-
search, 15(2):254–265.
Grottke, M., Nikora, A. P., and Trivedi, K. S. (2010). An
empirical investigation of fault types in space mission
system software. In 2010 IEEE/IFIP international
conference on dependable systems & networks (DSN),
pages 447–456. IEEE.
Hains, G., Mazur, C., Ayers, J., Humphrey, J., Khmelevsky,
Y., and Sutherland, T. The wtfast’s gamers private net-
work (gpn®) performance evaluation results. In 2020
IEEE International Systems Conference (SysCon),
pages 1–6. IEEE.
Jittawiriyanukoon, C. (2014). Performance evaluation of re-
liable data scheduling for erlang multimedia in cloud
computing. In Ninth International Conference on Dig-
ital Information Management (ICDIM 2014), pages
39–44. IEEE.
Lee, K., Chu, D., Cuervo, E., Kopf, J., Degtyarev, Y.,
Grizan, S., Wolman, A., and Flinn, J. (2015). Out-
atime: Using speculation to enable low-latency con-
tinuous interaction for mobile cloud gaming. In Pro-
ceedings of the 13th Annual International Conference
on Mobile Systems, Applications, and Services, pages
151–165.
Li, Y., Deng, Y., Tang, X., Cai, W., Liu, X., and Wang,
G. (2017). On server provisioning for cloud gaming.
In Proceedings of the 25th ACM international confer-
ence on Multimedia, pages 492–500.
Li, Y., Deng, Y., Tang, X., Cai, W., Liu, X., and Wang, G.
(2018). Cost-efficient server provisioning for cloud
gaming. ACM Transactions on Multimedia Com-
puting, Communications, and Applications (TOMM),
14(3s):1–22.
Marzolla, M., Ferretti, S., and D’angelo, G. (2012). Dy-
namic resource provisioning for cloud-based gaming
infrastructures. Computers in Entertainment (CIE),
10(1):1–20.
Mathews, P. G. (2005). Design of Experiments with
MINITAB. ASQ Quality Press Milwaukee, WI, USA:.
Nan, X., He, Y., and Guan, L. (2014). Queueing model
based resource optimization for multimedia cloud.
Journal of Visual Communication and Image Repre-
sentation, 25(5):928–942.
Song, B., Hassan, M. M., Alamri, A., Alelaiwi, A., Tian, Y.,
Pathan, M., and Almogren, A. (2016). A two-stage ap-
proach for task and resource management in multime-
dia cloud environment. Computing, 98(1-2):119–145.
Wijman, T. (2019). The global games market will generate
$152.1 billion in 2019 as the us overtakes china as the
biggest market. Newzoo) Abgerufen am, 1(3):2020.
Willig, A. (1999). A short introduction to queueing theory.
Technical University Berlin, Telecommunication Net-
works Group, 21.
Wu, J., Yuen, C., Cheung, N.-M., Chen, J., and Chen,
C. W. (2015). Enabling adaptive high-frame-rate
video streaming in mobile cloud gaming applications.
IEEE Transactions on Circuits and Systems for Video
Technology, 25(12):1988–2001.
Yates, R. D., Tavan, M., Hu, Y., and Raychaudhuri, D.
(2017). Timely cloud gaming. In IEEE INFO-
COM 2017-IEEE Conference on Computer Commu-
nications, pages 1–9. IEEE.
Zhang, X., Chen, H., Zhao, Y., Ma, Z., Xu, Y., Huang, H.,
Yin, H., and Wu, D. O. (2019). Improving cloud gam-
ing experience through mobile edge computing. IEEE
Wireless Communications, 26(4):178–183.
Mobile Games at the Edge: A Performance Evaluation to Guide Resource Capacity Planning
245
