
Towards a Machine Learning Flow-predicting Model
in a MOOC Context
Sergio Iván Ramírez Luelmo
1a
, Nour El Mawas
1b
, Rémi Bachelet
2c
and Jean Heutte
1d
1
CIREL - Centre Interuniversitaire de Recherche en Éducation de Lille, Université de Lille,
Campus Cité Scientifique, Bâtiments B5 – B6, Villeneuve d’Ascq, France
2
Centrale Lille, Université Lille Nord de France, Cité Scientifique, Villeneuve d’Ascq, France
Keywords: MOOC, Flow, Autotelic Experience, Machine Learning, Logistic Regression.
Abstract: Flow is a human psychological state positively correlated to self-efficacy, motivation, engagement, and
academic achievement, all of which positively affect learning. However, automatic, real-time flow prediction
is quite difficult, particularly in a Massively Online Open Course context, because of its online, distant,
asynchronous, and educational components. In such context, flow prediction would allow for personalization
of activities, content, and learning-paths. By pairing the results of the EduFlow2 and Flow-Q questionnaires
(n = 1589, two years data collection) from the French MOOC “Gestion de Projet” (Project Management) to
Machine Learning techniques (Logistic Regression), we create a Machine Learning model that successfully
predicts flow (combined Accuracy & Precision ~ 0.8, AUC = 0.85) in an automatic, asynchronous fashion, in
a MOOC context. The resulting Machine Learning model predicts the presence of flow (0.82) with a greater
Precision than it predicts its absence (0.74).
1 INTRODUCTION
Machine Learning (ML) has come a long way from
its beginnings as simple email spam filter in the
1990’s, or Optical Character Recognition software in
scanners (Géron, 2019). Nowadays, it is being
extensively applied to make sense of data, especially
in an era where data comes in abundance (Raschka &
Mirjalili, 2019). As such, ML plays a key role in
learning from data the knowledge and models that
might be challenging to obtain from human experts
(Conati et al., 2018).
The global reach of Massively Online Open
Courses (MOOC) steams from their original concept
to offer free and open access courses for a massive
number of learners from anywhere all over the world
(Yousef et al., 2014). However, MOOCs often feature
very low completion rates (Jordan, 2014; Yuan &
Powell, 2013), with research metrics agreeing at a
median of about 6.5%, and up to 60% for fee-based
certificates. Studies show that engagement, intention
and motivation are among the top factors to affect
a
https://orcid.org/0000-0002-7885-0123
b
https://orcid.org/0000-0002-0214-9840
c
https://orcid.org/0000-0001-8725-0384
d
https://orcid.org/0000-0002-2646-3658
learners’ performance in MOOCs (Jung & Lee, 2018;
Wang & Baker, 2018; Watted & Barak, 2018).
Flow is a fundamental psychological state which
allows for experiencing a rich and complete life. This
phenomenon may appear in any area of life
(Csikszentmihalyi & Csikszentmihalyi, 1988), and it
is related to the satisfaction gained from performing
different activities (Rufi Cano et al., 2014). Studies
have shown flow to be positively correlated to self-
efficacy, motivation, engagement, and academic
achievement efficacy (Heutte, 2019; Peifer et al.,
2022), all of which positively affect learning, more
specifically contributing to learning in online contexts
(Skadberg & Kimmel, 2004). Furthermore, we know
that the learner’s psychological state carries a
preponderant weight in the learning process (Abyaa et
al., 2019; Efklides, 2005; Medina-Medina & García-
Cabrera, 2016). All these factors make of flow a
desired psychological state when promoting learning,
more specifically in an online, distant setting.
However, flow detection is an issue subject to
discussion, whether it is in real-time or self-reported,
124
Ramírez Luelmo, S., El Mawas, N., Bachelet, R. and Heutte, J.
Towards a Machine Learning Flow-predicting Model in a MOOC Context.
DOI: 10.5220/0011070300003182
In Proceedings of the 14th International Conference on Computer Supported Education (CSEDU 2022) - Volume 1, pages 124-134
ISBN: 978-989-758-562-3; ISSN: 2184-5026
Copyright
c
2022 by SCITEPRESS – Science and Technology Publications, Lda. All rights reserved
as any artifact attempting to detect/measure it
inevitably contributes to disrupt flow. In one hand,
researchers had initially recurse to measure
instruments that asynchronously attempted to elude
this situation (Moneta, 2021; Nakamura &
Csikszentmihalyi, 2009; Rheinberg et al., 2003).
Such measure instruments are intrusive, somewhat
costly, and require the participant to always wear a
device during the study period, along a minimal
training for the study subject to reliably use them,
such as the ESM (Experience Sampling Method)
(Moneta, 2021). Also, real-time flow measurement is
limited to the individual wearing the measure device,
and thus, limits the study to the equipment available.
In the other hand, self-reported measure
instruments (ex. questionnaires) do not disrupt flow
and they can be applied to many individuals
(online/offline or distant/presential settings) at a
minimal cost. However, they usually require a manual
score calculation, they can only be applied
asynchronously (post flow event), and they heavily
depend on the individual’s ability to recognize flow
verbally and to associate it with a scale.
Nevertheless, flow automatic, real-time detection
(or lack-of) and prediction currently remains a holy
grail in online, distant learning. More precisely within
a MOOC, as flow prediction would allow for content,
activities, and learning-path personalization,
fostering thus learner’s engagement and motivation
(El Mawas et al., 2018). This research work comes
one more step closer to this goal, by creating a
successful ML Flow-predicting model that allows for
automatic, asynchronous flow detection and
prediction in an online, distant learning context, by
employing asynchronous measurement instruments.
We believe this milestone to be of ultimate
interest to our target public (MOOC
designers/providers, pedagogical engineers and
researchers who meet difficulties to incorporate
psychological states in MOOCs) to take better
informed decisions, in terms of collaborative work,
learners’ follow-up, and/or content’s difficulty
adaptation. This research work differentiates itself
from those of (Moneta & Csikszentmihalyi, 1996;
Pfister, 2002) in a) the application of the logit
function additionally of the linear function, b) the
application of flow measurement and characterization
instruments in an online learning context, and c) the
use of a two-year long input dataset issued from
within that same context.
The remainder of this article is structured as
follows. Section 2 oversees the theoretical works
concerning this papers, namely the definitions of
Machine Learning, and the flow human psychological
state, along with its measure instruments. Section 3
describes the experiment performed, followed by its
results in Section 4. Section 5 presents a discussion
on the results and finally, Section 6 presents this
article’s conclusion and futures perspectives.
2 THEORETICAL
BACKGROUND
In this section we present the notions at play behind
this research, namely the definitions of ML and of
Logistic Regression (LR), and the flow human
psychological state and its measure instruments.
2.1 Machine Learning
ML is a branch (or subset) of AI focused on building
applications (programming computers) that learn
from data and improve their accuracy over time
without being programmed to do so (Géron, 2019;
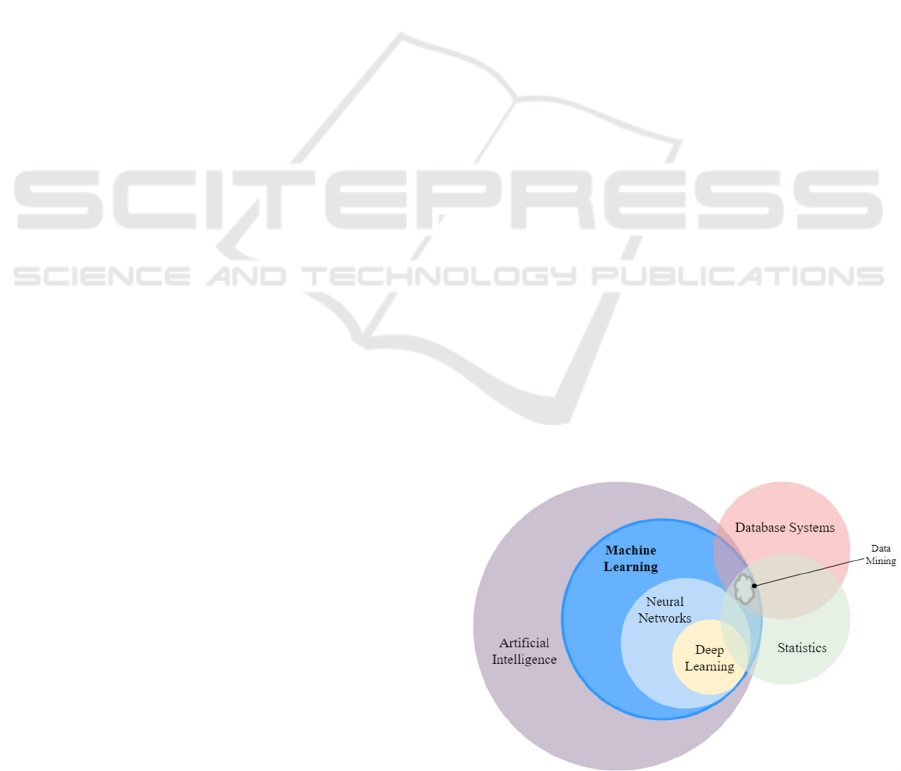
IBM, 2020). According to (Ramírez Luelmo et al.,
2021), ML sits at the crossroads of Database Systems,
and Statistics fields, while holding within itself the
fields of Neural Networks (NN) and Deep Learning
(DL) (see Figure 1).
ML systems can be classified according to the
amount and type of supervision they get during
training. There are four major categories: Supervised
Learning, Unsupervised Learning, Semi Supervised
Learning, and Reinforcement Learning (Das &
Behera, 2017; Géron, 2019; Mohri et al., 2018). Deep
Learning constitutes a recent category case addendum
to the previous list (Brownlee, 2019; IBM, 2020;
Mohri et al., 2018; Ramírez Luelmo et al., 2021).
ML is instrumental in addressing the issue of
learning from data the knowledge and models that
might be challenging to obtain from human experts,
Figure 1: Situational context of ML (Ramírez Luelmo et al.,
2021).
Towards a Machine Learning Flow-predicting Model in a MOOC Context
125
such as computing predictions of learners’ cognitive
and mental states in highly dimensional and ill-
defined spaces of human behaviour (Conati et al.,
2018).
2.2 Logistic Regression
Logistic Regression (a.k.a. Logit Regression) is a ML
linear model for binary classification (Raschka &
Mirjalili, 2019). Despite the term ‘Regression’, LR is
a model for classification and not regression (Raschka
& Mirjalili, 2019). LR belongs to the category of
Supervised Learning, where labelled data is required
for the model training (Brownlee, 2019). An LR
model estimates the probability that an instance
belongs to any given class (called the positive class,
usually labelled “1”), and otherwise it predicts that it
does not (i.e., it belongs to the negative class, usually
labelled “0”) (Géron, 2019). When LR has more than
one input variable, it is called Multi-variate Logistic
Regression. Similarly, when LR can output more than
one class, it is called Multinomial Logistic
Regression.
LR has its bases on odds: the odds in favour of a
particular event (Raschka & Mirjalili, 2019). The
odds can be written as:
𝑝
1𝑝
(1)
, where p stands for the probability of the positive
event.
Now, let it be logit a function for the logarithm of
the odds (log-odds):
𝑙𝑜𝑔𝑖𝑡
𝑝
log
𝑝
1𝑝
(2)
, where log is the natural logarithm. The logit function
takes input values in the range 0 to 1 and transforms
them to values over the entire real-number range. This
leads to a linear relationship between feature values
and the log-odds of the following form:
𝑙𝑜𝑔𝑖𝑡
𝑝
𝑦1
|
𝒙
(3)
𝑤
𝑥
𝑤
𝑥
⋯𝑤
𝑥
𝑤
𝑥
Here, (p(y=1|x)) is the conditional probability that
any given instance belongs to class 1, given its
features x. The inverse form of the logit function is
the probability that any given instance belongs to a
particular class. This inverse form is also called the
logistic sigmoid function 𝜙, often abbreviated simply
as the sigmoid function, due to its characteristic S-
shape:
𝜙
𝑧
1
1𝑒
(4)
Here, z is the net input, the linear combination of
weights w, and the inputs x (the features associated to
the training data):
𝑧𝑤
𝑥
𝑤
𝑥
⋯𝑤
𝑥
(5
)
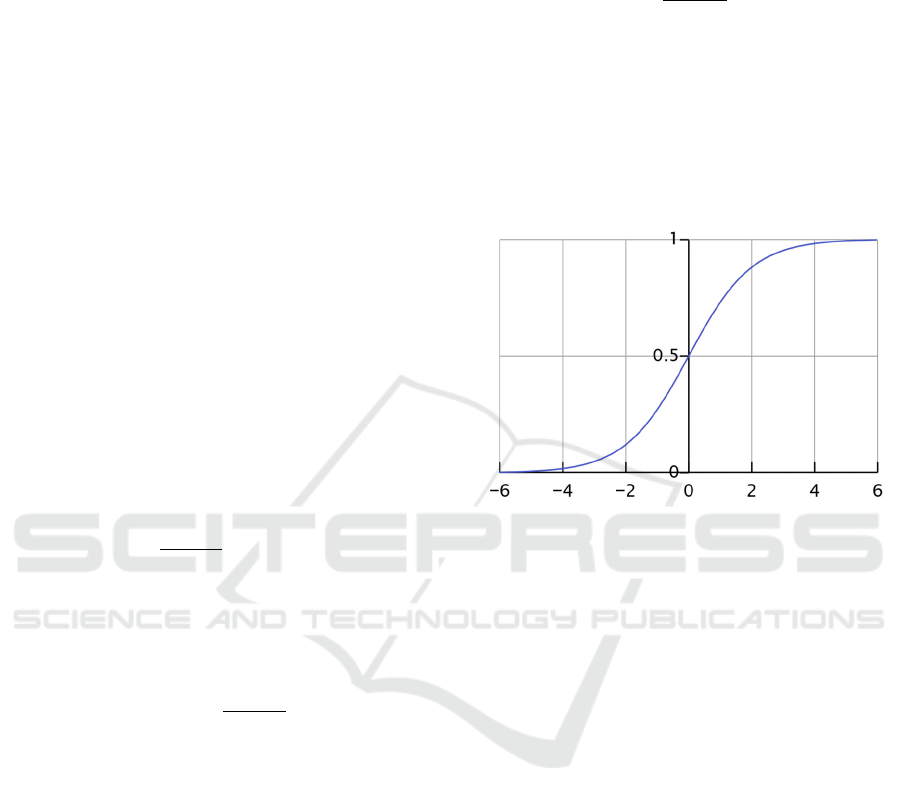
As such, the sigmoid function 𝜙𝑧, of which an
example is plotted in Figure 2, takes real-number
values as input, and transforms them into values in the
range [0,1], with an intercept at 𝜙
𝑧
0.5.
Figure 2: A typical S-shaped curve (sigmoid curve), with an
intercept at 𝜙
𝑧
0.5.
Thus, LR determines the best weights (a.k.a.
estimators or coefficients) 𝑤
such that the output of
the function p(x) (the predicted probability that the
output for a given x equals 1) is as close as possible
to all real responses. The process of calculating the
best weights 𝑤
using available data is called model
training or fitting (Raschka & Mirjalili, 2019).
2.3 Flow
Flow is “a gratifying state of deep involvement and
absorption that individuals report when facing a
challenging activity and they perceive adequate
abilities to cope with it” (EFRN, 2014).
Flow state has been shown to promote learning
and personal development because deep and total
concentration experiences are intrinsically rewarding,
and they motivate students to repeat any given
activity at progressively higher challenging levels
(Csikszentmihalyi et al., 2005).
Psychological states such as shame, reproach,
distress, joy, pride, admiration, and for some authors,
motivation, and engagement as well (Abyaa et al.,
2019) are also a focus of research. However, the
reason behind choosing the flow state among all other
psychological states is multifold: it has shown to
CSEDU 2022 - 14th International Conference on Computer Supported Education
126
reliably correlate learning-favourable metrics, such as
motivation, self-efficacy (Heutte et al., 2021;
Salanova et al., 2006) self-regulation (Bandura, 1986;
Chen & Sun, 2016), perceived control, curiosity
(Huang, 2006), or goal attainment (Leontiev, 2012;
Rheinberg & Engeser, 2018).
2.3.1 Measure Instruments
Over the past 35 years, researchers have developed,
validated, modified, and re-validated unidimensional
and multidimensional measure instruments for flow,
including in-person interview methods (Heutte et al.,
2021; Moneta, 2021). More than 30 different flow
categorizations have been analysed by (Hoffman &
Novak, 2009) and have been found employed in
diverse contexts such as creative or performing arts,
work, music, ecommerce (Hoffman & Novak, 2009;
Rheinberg et al., 2003), sports (Jackson & Eklund,
2002; Rufi Cano et al., 2014), eLearning (Heutte et
al., 2021), and/or video gaming (Fu et al., 2009). For
instance, the Experience Sampling Method (ESM) is
a well-known research procedure for studying what
people do, feel, and think during their daily lives.
When using it for flow detection, it consists in asking
individuals to provide systematic self-reports at
random occasions (determined by a carry-on
electronic pager, which signals them when to
complete a self-report) during most hours of a normal
week. Sets of these self-reports from a sample of
individuals create an archival file of daily experience
(Larson & Csikszentmihalyi, 2014). However, ESM
suffers from its intrusive nature (Rheinberg &
Engeser, 2018), just like many of other
categorizations and measure instruments also suffer
from their lengthy reporting process, comprising
many items (up to 66 but often as many as 42). Such
many questions can demotivate individuals when
answering the measure instrument, leading to
inconsistencies in reporting. In that light, (Rheinberg
et al., 2003) uphold that short questionnaires
seemingly reduce the intrusive nature and the time
expended answering the measure instruments,
compared to, for example, using the ESM (Nakamura
& Csikszentmihalyi, 2009).
When designing flow measurement protocols,
(Hoffman & Novak, 2009) recommend using more
than one type of flow measure instrument:
unidimensional and multidimensional instruments.
Generally, simple, unidimensional measures of flow
reduce the data collection burden while
multidimensional flow measures help to identify
higher-order factors to provide a more holistic
definition of flow, prompt for statistical fit in
structural models.
3 OUR PROPOSAL
Within our research context, we have identified in the
literature (Heutte et al., 2021; Hoffman & Novak,
2009; Rheinberg & Engeser, 2018; Rufi Cano et al.,
2014) two measure instruments that respond to the
previously-mentioned constraints while remaining
adapted to our research context. We employ Flow-Q
(Csikszentmihalyi, 1975) as a short, general use,
dimension-agnostic, community-proven, instrument
to determine flow presence/absence, and EduFlow-2
(Heutte et al., 2021) as a short, online learning
context-specific, multi-dimensional, instrument to
identify higher-order factors composing and
characterizing flow.
Also, to extract meaning out of our input data, we
use ML to discern non-obvious similarities and
classify participants into two classes (not having/
having flow). First, by using LR we associate the
results of our two flow measure instruments such as
the absence/presence of flow (Flow-Q) is
characterized by the dimensions accounted by
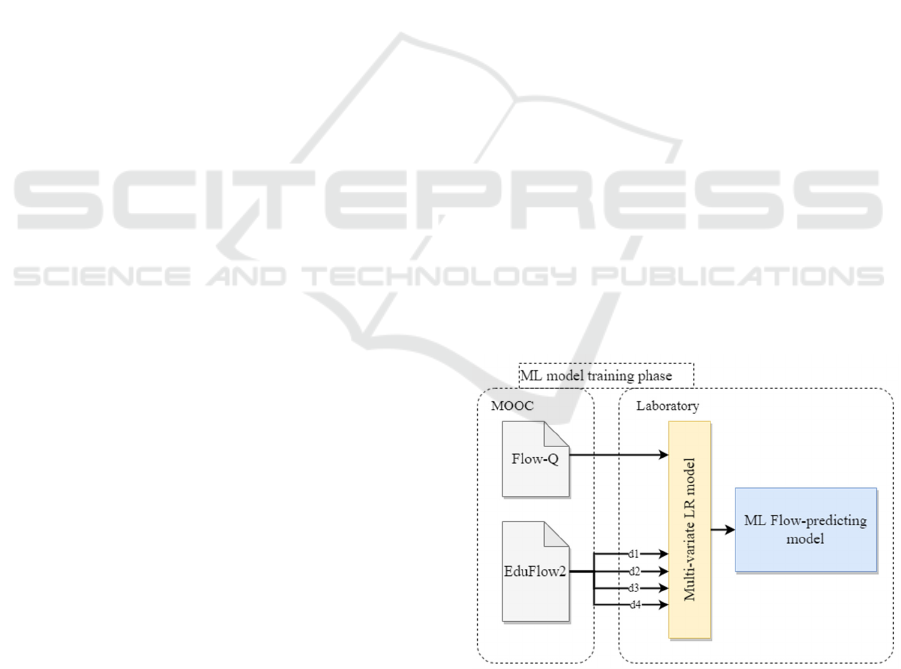
EduFlow-2. The result of this phase (ML model
training) constitutes our ML Flow-predicting model,
shown in Figure 3 in light blue. Our model, in turn, is
subsequently to be used to predict flow automatically
and asynchronously during the Production phase
(Figure 4) and by using only the EduFlow-2
instrument.
Figure 3: The ML model training phase of our proposal,
where measure instruments’ data (from a MOOC) are used
to train a multi-variate LR model.
Towards a Machine Learning Flow-predicting Model in a MOOC Context
127

Figure 4: Production phase, showing our ML Flow-
predicting model at work (in a MOOC) using only new
EduFlow2 data.
3.1 Flow-Q
The FlowQuestionnaire (Flow-Q or FlowQ) was
developed by (Csikszentmihalyi & Csikszentmihalyi,
1988) when researching life satisfaction in Korean
immigrants in the Chicago area. It is the revised
version of its predecessor, by (Csikszentmihalyi,
1975), and it is recognized as a “broad use”, effective
flow measure/detection instrument by the flow
researchers community (Rufi Cano et al., 2014).
Flow-Q is a dimension-agnostic, that is a general-
purpose flow detection measurement. It comprises
only three items, which makes it a short, unburdening
questionnaire. It relies and results on a binary scale,
which makes scoring simpler. For this study, we used
the Flow-Q questionnaire French translation by
(Heutte, 2015).
3.2 EduFlow-2
The EduFlow-2 (or EduFlow2) theoretical model is
successor to the EduFlow theoretical model, a
measure instrument designed specifically for flow
measurement in educational contexts (El Mawas &
Heutte, 2019). The EduFlow-2 measure instrument
has proven to be useful in studies of cognitive
activities and be suited to flow measurement in
various educational contexts, specifically in MOOC
(online, asynchronous, distance learning) and
classroom (offline, synchronous, presential learning)
situations (Heutte et al., 2014; Heutte, Fenouillet,
Kaplan, et al., 2016). It is a gender neutral, short
twelve-item scale differentiating four flow
dimensions (El Mawas & Heutte, 2019; Heutte et al.,
2021; Heutte, Fenouillet, Martin-Krumm, et al.,
2016), where each dimension is measured by three
items:
FlowD1 (d1) – Cognitive Control.
FlowD2 (d2) – Immersion and Time
Transformation.
1
https://mooc.gestiondeprojet.pm/
FlowD3 (d3) – Loss of Self-Consciousness.
FlowD4 (d4) – Autotelic Experience.
The EduFlow-2 measure instrument presents the
following advantages: it differentiates dimensions
relevant to cognitive processes, it accounts for a
decreased respondent burden, and it can be applied to
different educational contexts, all without sacrificing
accuracy nor resolution (El Mawas & Heutte, 2019).
3.3 The Multi-variate Logistic
Regression Model
Multi-variate LR is a ML technique adapted to our
needs and constraints, namely:
LR requires labelled data (the known target).
Our ML target is binary (presence/absence) and
LR is a binary classifier.
Multi-variate LR admits classification with
more than one independent variable, and we
present four independent variables.
LR is easily updatable if incoming data changes
in shape (extra dimensions, e.g., additional
measurement instruments) or quantity (number
of participants).
LR is a computational simpler ML model than
other ML techniques while still adapted to our
needs (e.g., does not require costly software nor
specialized hardware).
LR is easier to implement programmatically
than other more complex ML techniques.
4 EXPERIMENT
This research work used data provided by R&D team
from the MOOC “Gestion de Projet” (GdP, Project
Management). In this section we briefly present the
MOOC and its organisation to set up the dataset
context. Then, we present the sample used: how it was
collected, and its characteristics. Finally, we describe
how we effectuated the experiment.
4.1 The MOOC “Gestion De Projet”
The MOOC GdP was launched in 2013 by the École
d’Ingénieurs Centrale Lille. As of January 2022, this
platform
1
had 292 855 enrolments, among which
49 344 students fully completed either the basic or the
advanced tracks. Nowadays, half of the active
learners enrol through their university, while the other
half do so of their own will, with one of the best
CSEDU 2022 - 14th International Conference on Computer Supported Education
128
completion rates in the francophone world
(Chermann, 2020). While the MOOC can be
inscribed within the École’s own cursus if students
are enrolled by their professors, the subject interests
professionals as well: special sessions dedicated to
the enterprise world (Bachelet, 2019; Chermann,
2020).
The MOOC GdP has two sessions per year: 1
st
session spans the September – November period and
the 2
nd
session comprises the March – May period
(although precise dates vary each year). Each session
is comprised of nine weeks plus an initial pre-opening
week (that does not count to the week numbering).
The number of participants validating the first half of
the MOOC has been consistent and historically larger
during the 1
st
session (> 110% increase) compared to
the 2
nd
session (Bachelet, 2019). The MOOC unlocks
pedagogical modules (or units) every week and it can
be done at one’s own pace. However, in order to
successfully complete it, participants should have
finished at least the common branch by the end of the
9
th
week.
4.2 Sample
The R&D team from the MOOC “Gestion de Projet”
allows for three distinct periods (P1, P2, and P3) for
measurement instruments application. This allows for
evolution observation, often required when applying
consecutive psychometric measure instruments to the
same individuals. Because of administrative reasons,
these application periods cannot last longer than those
shown in Table 1, and they are always the same for
all sessions. Furthermore, besides our selected flow
measure instruments, other psychometric instruments
beyond the scope of this research work (chosen and
managed by the R&D team from the MOOC “Gestion
de Projet”) are applied jointly as well.
For the application of our selected flow
measurement instruments and being limited to the
application periods shown in Table 1, we chose to
maximize the time to gather data over equal-lengths,
smaller time data collection periods.
Table 1: Flow measure instruments application periods and
data collected, for all sessions.
Period Opening Closure &
Collection
Data collected
P1 Start of
Week 0
End of
Week 4
Demographics
P2 Start of
Week 3
End of
Week 4
Flow-Q, then
EduFlow-2
P3 Start of
Week 4
End of
Week 11
Flow-Q, then
EduFlow-2
We gathered the respondents’ data at each
period’s closing date (shown in Table 1).
Demographic data (sex, birth year, country of
residence, occupation and highest academic degree
obtained) were asked only during P1. Our flow
measure instruments were asked during P2 and P3;
with Flow-Q first and then EduFlow-2. For this study,
all data was anonymized by removing any personal
data and/or attributes (Ferreira Marques &
Bernardino, 2020). Out of 9448 participants’ answers,
our research work sample was finally constituted of
1589 trustworthy participants’ questionnaires self-
reported answers (n = 1589).
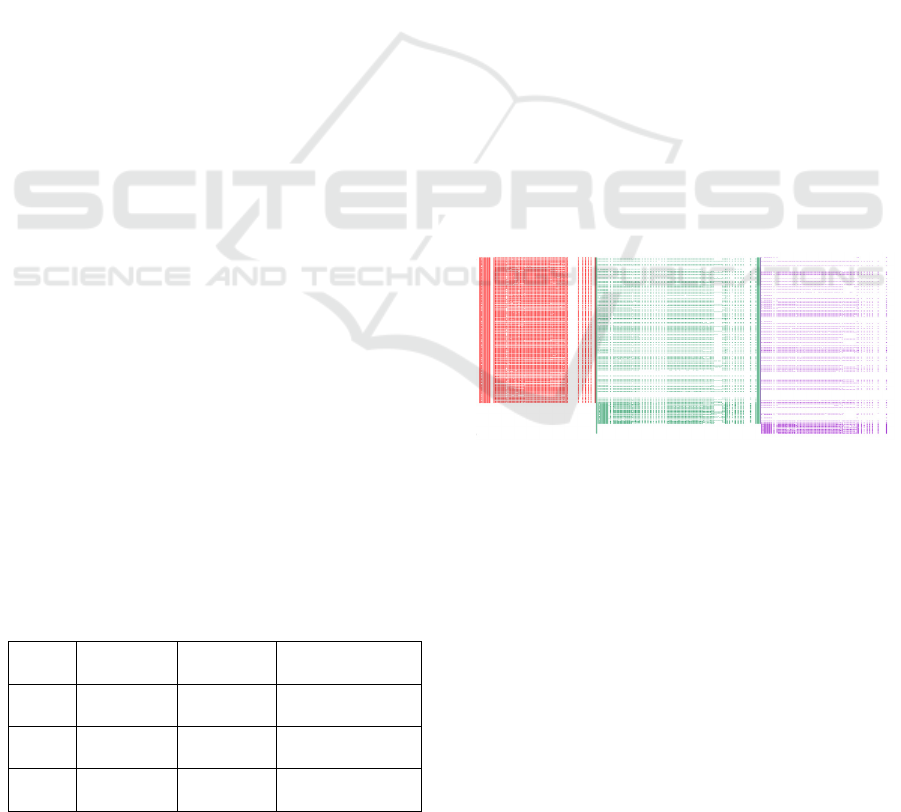
Figure 5 shows a graphical representation of a
typical session, all-respondents, zoomed-out CSV
file, where coloured spaces represent data, and white
spaces represent missing data (respondents skipping
a question or respondent being absent). The three
main vertical sections (red, green, violet) correspond
to the three periods sets of measure instruments: we
can clearly see a “dilution” of participants (MOOC
dropping or participants skipping the questionnaires)
from P1 (left, red) to P3 (right, violet).
We gathered data from four sessions, spanning
two years of data collection (March 2020 – December
2021), for twelve weeks. We merged all four sessions,
three period’s (P) data, into a single CSV file and
calculated scores for each of our measure instruments
(Flow-Q & EduFlow-2).
Figure 5: Graphical representation of one typical session,
all-respondents CSV file, depicting P1 data (red), P2 data
(green) and P3 data (violet); white is ‘missing data’.
One check question was placed in the middle of
the EduFlow-2 measure instrument (not in the Flow-
Q, being too short) to verify if participants read all the
items, followed directives (i.e., “Please, select 3 for
this item”), and were not simply randomly answering.
We completely discarded respondents who answered
incorrectly to any of our two check questions, or if
they chose multiple genders at once. After cleaning
up the data, out of an original pool of 9448
participants we accounted for 1589 trustworthy
participants’ questionnaires self-reported answers
(n = 1589). That is, the scores for the Flow-Q (general
Towards a Machine Learning Flow-predicting Model in a MOOC Context
129

use, binary, dimension-agnostic) and EduFlow-2
(online educational context, 0-21 integers per
dimension, 4-dimensional) measure instruments.
Figure 6: 3D scatterplot of the four EduFlow-2 dimensions’
scores (n = 1589, 21-sided open cube, the 4
th
dimension is
represented as a colour gradient).
Figure 6 shows a 3D scatterplot (in a 21 x 21 x 21
open cube) for the flow four-dimension scores (d1,
d2, d3, d4, 0-21) collected by the EduFlow-2
instrument (the 4
th
dimension is represented as a
colour gradient). This point cloud graphical
representation aims to visualize the concentration
shape of the 4-dimensional data resulting only from
the EduFlow-2 measure instrument and thus, to make
clear the difficulty of making sense out of raw data
without advanced statistical techniques. It does not
constitute in any way a data treatment result.
The Flow-Q instrument scores are binary and
represent flow presence (1) or flow absence (0) and
are not graphically shown here due to their simplicity.
The sample is comprised of francophone students
and professionals attending the MOOC GdP. While
most of them reside in France (~62%), we can also
see a number logging in from Côte d’Ivoire (~6%),
Cameroon (~5%), Senegal, Morocco, Benin, and
Burkina Faso (~3% each). Other francophone
countries complete the rest of the sample.
4.3 Multi-variate LR in the MOOC
GdP
Multi-variate LR allows for our binary target
(1 – presence, 0 – absence of flow) to be determined
2
https://sklearn.org/
3
https://www.python.org/
by four independent variables: the four EduFlow-2
dimensions (d1, d2, d3, d4, represented as X
1
, X
2
, X
3
,
X
4
in the ML model).
All experiments were carried out using the
sklearn
2
libraries in Python 3
3
. Available data was
randomly divided into training and testing sets at a
70/30 ratio. We used a pipeline chaining the
PolynomialFeatures and StandardScaler pre-
processors to the LogisticRegression classifier. The
PolynomialFeatures pre-processor was given a
degree argument of 2. The LogisticRegression solver
was left to the “lbfgs” default. Disk-caching of the
pipeline was effectuated in a Joblib
4
file.
We trained multiple instances of the ML LR
model with the Flow-Q (Y) and EduFlow-2 scores
(X
1
, X
2
, X
3
, X
4
) from the training set, which was
randomly set up for each training. Testing was
effectuated using the testing dataset (m = 477),
randomly selected by the program each time as well.
A 10-fold Cross Validation took place for each
random instance training.
Among those trained ML LR models instances,
this research works presents the results of the one
with the highest Accuracy, Precision, and Receiver
Operating Characteristic (ROC) Area Under the
Curve (AUC) scores (differences between other
instances < 5%). The set of weight coefficients for the
logit function constitutes the ML Flow-predicting
model. This result is available by addressing the
CIREL-Trigone laboratory.
5 RESULTS
The classification report of the resulting ML Flow-
predicting model is shown in Table 2. All scores were
rounded-up at the source. Accuracy is the proportion
of the total numbers of predictions that are correct,
Precision is the ratio between the total of correctly
classified positives and the total of correctly and
incorrectly classified positives (and the inverse),
Recall (or Sensitivity) is the measure of positives
correctly classified as positives (and the inverse), and
the F1-Score is the weighted average of each of the
Recall and Precision scores.
Scores for flow presence prediction are clearly
higher than for the flow absence prediction (second
and first rows respectively, of the Classification
Report).
4
https://joblib.readthedocs.io/
CSEDU 2022 - 14th International Conference on Computer Supported Education
130
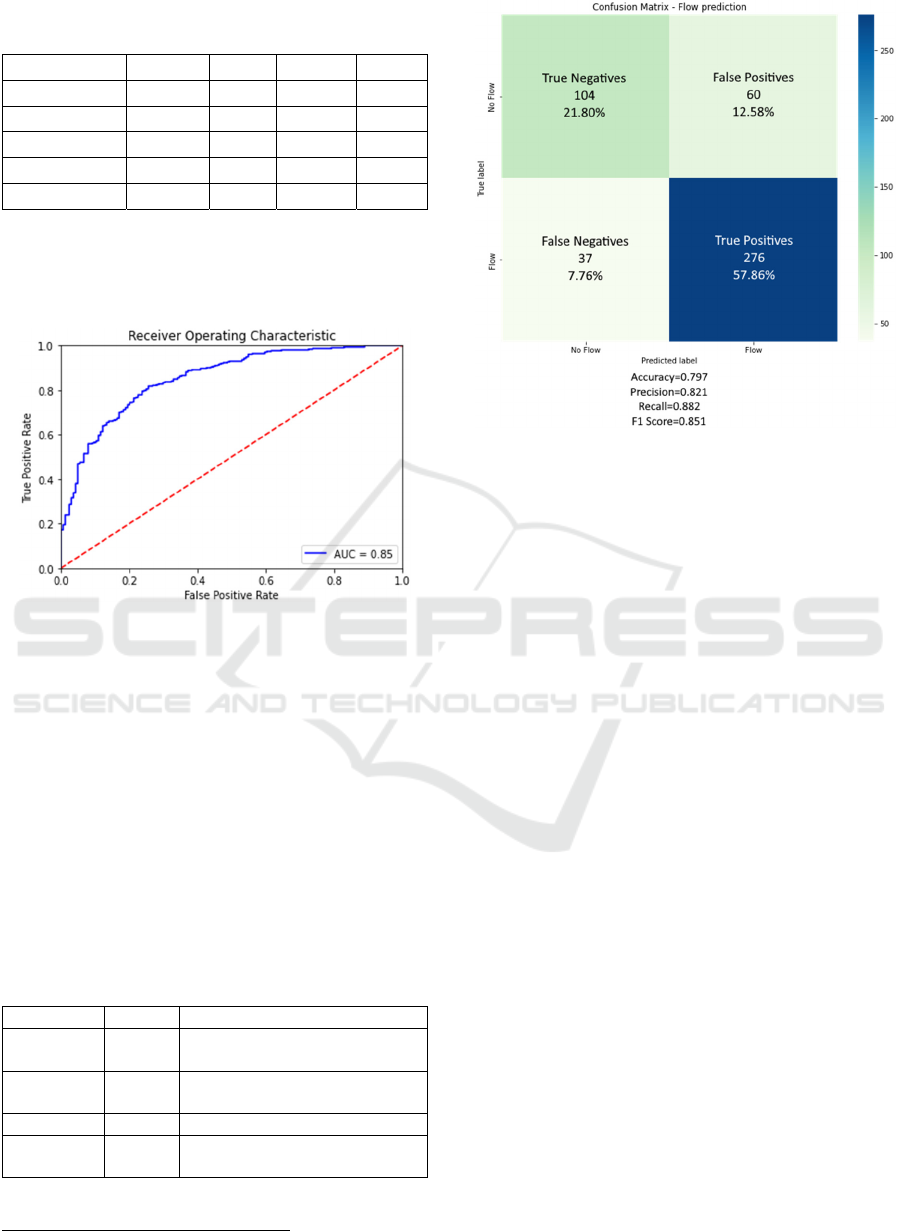
Table 2: Classification Report for the ML Flow-predicting
model.
Precision Recall F1-score Support
Flow absence 0.74 0.63 0.68 164
Flow presence 0.82 0.88 0.85 313
Accuracy 0.8 477
Macro avg. 0.78 0.76 0.77 477
Weighted avg. 0.79 0.80 0.79 477
The ROC curve of the resulting ML Flow-
predicting model features an AUC of 0.85 (blue curve
line), shown in Figure 7, compared to a hypothetical
random classifier (straight, dotted red line).
Figure 7: ROC curve (blue curve) of the ML Flow-
predicting model (AUC = 0.85) versus a curve of a
hypothetical random classifier (straight, dotted red line).
The resulting Confusion Matrix (Figure 8) shows
a combined Accuracy of 0.797, with a larger
proportion (57.86%) of correctly predicted cases in
the True Positives cell, compared to the True
Negatives cell. The ratio of False Positives and False
Negatives remains under the 15% mark, individually.
In the 10-fold Cross Validation, means of metrics
relevant to regression and classification (Accuracy,
Precision, Jaccard, and F1) were calculated. These
results are shown in Table 3.
Table 3: Means
5
of applied metrics in the 10-fold Cross
Validation.
Test Mean Description
Accuracy 0.78 Ratio of correctly predicted
items.
Precision 0.80 Ability not to mislabel as
p
ositive a ne
g
ative item.
Jaccar
d
0.72 Similarit
y
between 2 sets.
F1 0.83 Harmonic mean of precision
and recall.
5
Values closer to 1.0 point to a better model.
Figure 8: Confusion Matrix for the ML Flow-predicting
model (Accuracy = 0.797, Precision = 0.821).
6 DISCUSSION
In this section we discuss the results and the
conditions surrounding them when doing this study.
Our resulting ML Flow-predicting model predicts
flow by applying only the EduFlow-2 measure
instrument. That is, we created a ML model that
successfully predicts flow via its composing
dimensions, specifically in a learning, online context.
Our resulting ML Flow-predicting model features
very acceptable metrics for a participant’s self-
reported-based ML model (> 0.8). Scores for flow
presence prediction are clearly higher than for the
flow absence prediction (first and second rows of
Table 2).
We hypothesize that flow presence prediction is
more accurate than flow absence prediction due to 1)
the way the psychometric tests are drafted and 2) the
nature of respondents.
Indeed, the Flow-Q measure instrument quotes
situations where presence of flow is described, but it
does not describe absence of flow. This alone might
explain the noticeable skew of the resulting model
towards detecting the presence of flow instead of its
absence. In such a case, we (and the questionnaire’s
designers) assumed absence of flow as being the
opposite of the presented text quote.
Furthermore, we consider that respondents might
feel more inclined to answer the item positively if
Towards a Machine Learning Flow-predicting Model in a MOOC Context
131

they clearly identify with the item’s text (Flow-Q asks
to self-identify with described life experiences), but
instead, respondents might feel more inclined to leave
the question unanswered (blank) if they do not
identify with it, instead of answering ‘No’ if they do
not identify with it. We came to this conclusion
because of how these types of participants behaved in
other psychometric instruments (beyond the scope of
this research work) and that were applied jointly. This
is a minor remark of work left to be done on the length
and writing style of the text quotes presented.
As previously mentioned, to improve model
accuracy, we effectuated a very strict input sample
clean up. One may argue that the ML model might
automatically filter out outliers, but we did not want
to take that risk. We noticed the removed participants
tend to belong to the P2 periods (as P1 concerns
demographics only). We think that, just like during
normal MOOC dropout, participants more committed
to the MOOC completion answer questionnaires
more accurately, hence a larger proportion of P3
respondents ended up in the final sample (compared
to P2).
Given the nature of our predictive target, better
approaches can be employed to improve our resulting
model’s accuracy, such as grouping or clustering. We
consider reviewing these methods in future research
on the subject. Also, a larger training set can be useful
when improving almost any ML model.
7 CONCLUSION &
PERSPECTIVES
This research work provides a ML Flow-predicting
model by pairing two flow measure and
characterization instruments’ scores results from a
sample population n = 1589.
The resulting ML model computes an Accuracy
of 0.797, a Precision of 0.821, a Recall of 0.882, and
a F1-score of 0.851, making it a very acceptable
model for flow prediction based on self-reported data.
Our resulting model predicts flow presence better
(57.86%) than flow absence (21.80%) likely due to
the way the questionnaires are drafted and possibly to
human nature as well.
Our resulting ML model can be easily
implemented into existing MOOC’s dashboards (a
“Flow detection” section) to successfully predict flow
by applying only the EduFlow-2 measure instrument:
the calculations are almost instantaneous and do not
require ML training. We believe this milestone to be
of ultimate interest to our target public (MOOC
designers/providers, pedagogical engineers and
researchers who meet difficulties to incorporate
psychological states in MOOCs), given that the
training (and evaluation) dataset is issued from a
francophone MOOC.
This study is inscribed in the context of the
“Optimal experience modelling” research project,
conducted by the University of Lille. This research
project (Ramírez Luelmo et al., 2020) aims to model
and trace the flow psychological state alongside
Knowledge Tracing, exclusively via behavioural
data. That is, to successfully detect and predict flow
in a MOOC in real-time, by using only the MOOC
learner’s logs traces (without the need to apply any
instrument measurement) in a transparent and
automatic fashion.
The current challenge is to incorporate the
resulting ML Flow-predicting model into 1) the
above-described project, comprising behavioural and
knowledge aspects (log traces and student’s
knowledge), and 2) the existing MOOC GdP’s
Dashboard. The originality of such research lies in the
use of live, behavioural, flow-labelled data issued
from the francophone MOOC “Project
Management”.
ACKNOWLEDGEMENTS
This project was funded by I-SITE Université Lille
Nord-Europe (ULNE), supported by the French state
through the General Secretariat for Investment
(SGPI) and the National Research Agency (I-SITE
ULNE / ANR-16-IDEX-0004 ULNE).
REFERENCES
Abyaa, A., Khalidi Idrissi, M., & Bennani, S. (2019).
Learner modelling: Systematic review of the literature
from the last 5 years. Educational Technology
Research and Development, 67(5), 1105–1143.
https://doi.org/10.1007/s11423-018-09644-1
Bachelet, R. (2019). LE MOOC GdP: Chiffres presse
[MOOC]. MOOC Gestion de Projet.
https://gestiondeprojet.pm/mooc-gdp/
Bandura, A. (1986). Social foundations of thought and
action. Englewood Cliffs, NJ, 1986.
Brownlee, J. (2019, August 11). A Tour of Machine
Learning Algorithms. Machine Learning Mastery.
https://machinelearningmastery.com/a-tour-of-
machine-learning-algorithms/
Chen, L.-X., & Sun, C.-T. (2016). Self-regulation influence
on game play flow state. Computers in Human
Behavior, 54, 341–350.
CSEDU 2022 - 14th International Conference on Computer Supported Education
132

Chermann, E. (2020, March 1). Enseignement en ligne: Les
1001 secrets d’un MOOC qui cartonne. Le Monde.
https://www.lemonde.fr/economie/article/2020/03/01/
enseignement-en-ligne-les-1001-secrets-d-un-mooc-
qui-cartonne_6031425_3234.html
Conati, C., Porayska-Pomsta, K., & Mavrikis, M. (2018).
AI in Education needs interpretable machine learning:
Lessons from Open Learner Modelling.
ArXiv:1807.00154 [Cs]. http://arxiv.org/abs/1807.00
154
Csikszentmihalyi, M. (1975). Beyond Boredom and
Anxiety: The Notion of Flow in Work and Play. San
Francisco: Jossey Press.
Csikszentmihalyi, M., Abuhamdeh, S., & Nakamura, J.
(2005). Flow. In A. J. Elliot & C. S. Dweck (Eds.),
Handbook of competence and motivation (pp. 598–
608). Guilford Publications.
Csikszentmihalyi, M., & Csikszentmihalyi, I. S. (1988).
Optimal experience: Psychological studies of flow in
consciousness. Cambridge University Press.
Das, K., & Behera, R. N. (2017). A Survey on Machine
Learning: Concept, Algorithms and Applications.
International Journal of Innovative Research in
Computer and Communication Engineering, 5(2).
https://doi.org/10.15680/IJIRCCE.2017. 0502001
Efklides, A. (2005). Feelings and emotions in the learning
process. Elsevier.
EFRN. (2014). What is Flow ? European Flow Researchers
Network. https://efrn.webs.com/
El Mawas, N., Gilliot, J.-M., Garlatti, S., Euler, R., &
Pascual, S. (2018). Towards personalized content in
massive open online courses. 10th International
Conference on Computer Supported Education.
https://doi.org/10.5220/0006816703310339
El Mawas, N., & Heutte, J. (2019). A Flow Measurement
Instrument to Test the Students’ Motivation in a
Computer Science Course. CSEDU.
https://doi.org/10.5220/0007771504950505
Ferreira Marques, J., & Bernardino, J. (2020). Analysis of
Data Anonymization Techniques. Proceedings of the
12th International Joint Conference on Knowledge
Discovery, Knowledge Engineering and Knowledge
Management, 235–241. https://doi.org/10.5220/0010
142302350241
Fu, F.-L., Su, R.-C., & Yu, S.-C. (2009). EGameFlow: A
scale to measure learners’ enjoyment of e-learning
games. Computers & Education, 52(1), 101–112.
https://doi.org/10.1016/j.compedu.2008.07.004
Géron, A. (2019). Hands-on machine learning with Scikit-
Learn, Keras, and TensorFlow: Concepts, tools, and
techniques to build intelligent systems (Second edition).
O’Reilly Media, Inc.
Heutte, J. (2015). L’environnement optimal
d’apprentissage vidéo-ludique: Contribution de la
psychologie positive à la définition d’une ingénierie
ludo-éduquante autotélique. Séminaire CNAM‑ENJIM
“Bases Cognitives, Sociales et Émotionnelles Des Jeux
et Médias Interactifs Numériques.”
Heutte, J. (2019). Les fondements de l’éducation positive:
Perspective psychosociale et systémique de
l’apprentissage. Dunod.
Heutte, J., Fenouillet, F., Boniwell, I., Martin-Krumm, C.,
& Csikszentmihalyi, M. (2014, October 20). Optimal
learning experience in digital environments:
Theoretical concepts, measure and modelisation.
Symposium “Digitial Learning in 21st Century
Universities.” https://hal.archives-ouvertes.fr/hal-
01470855
Heutte, J., Fenouillet, F., Kaplan, J., Martin-Krumm, C., &
Bachelet, R. (2016). The EduFlow model: A
contribution toward the study of optimal learning
environments. In Flow experience (pp. 127–143).
Springer.
Heutte, J., Fenouillet, F., Martin-Krumm, C., Boniwell, I.,
& Csikszentmihalyi, M. (2016, June 29). Proposal for a
conceptual evolution of the flow in education
(EduFlow) model. 8th European Conference on
Positive Psychology (ECPP 2016). https://hal.archives-
ouvertes.fr/hal-01470857
Heutte, J., Fenouillet, F., Martin-Krumm, C., Gute, G.,
Raes, A., Gute, D., Bachelet, R., & Csikszentmihalyi,
M. (2021). Optimal Experience in Adult Learning:
Conception and Validation of the Flow in Education
Scale (EduFlow-2). Frontiers in Psychology, 12,
828027. https://doi.org/10.3389/fpsyg.2021.828027
Hoffman, D. L., & Novak, T. P. (2009). Flow Online:
Lessons Learned and Future Prospects. Journal of
Interactive Marketing, 23, 23–34.
https://doi.org/10.1016/J.INTMAR.2008.10.003
Huang, M.-H. (2006). Flow, enduring, and situational
involvement in the Web environment: A tripartite
second-order examination. Psychology & Marketing,
23(5), 383–411. https://doi.org/10.1002/mar.20118
IBM. (2020, December 18). What is Machine Learning?
IBM Cloud Learn Hub. https://www.ibm.com/cloud/
learn/machine-learning
Jackson, S. A., & Eklund, R. C. (2002). Assessing flow in
physical activity: The flow state scale–2 and
dispositional flow scale–2. Journal of Sport and
Exercise Psychology, 24(2), 133–150.
https://doi.org/10.1123/jsep.24.2.133
Jordan, K. (2014). Initial trends in enrolment and
completion of massive open online courses. The
International Review of Research in Open and
Distributed Learning, 15(1). https://doi.org/10.19173/
irrodl.v15i1.1651
Jung, Y., & Lee, J. (2018). Learning Engagement and
Persistence in Massive Open Online Courses
(MOOCS). Computers & Education, 122, 9–22.
https://doi.org/10.1016/j.compedu.2018.02.013
Larson, R., & Csikszentmihalyi, M. (2014). The Experience
Sampling Method. In M. Csikszentmihalyi, Flow and
the Foundations of Positive Psychology (pp. 21–34).
Springer Netherlands. https://doi.org/10.1007/978-94-
017-9088-8_2
Leontiev, D. A. (2012). Motivation, consciousness and self-
regulation
. Nova Science Publishers.
Towards a Machine Learning Flow-predicting Model in a MOOC Context
133

Medina-Medina, N., & García-Cabrera, L. (2016). A
taxonomy for user models in adaptive systems: Special
considerations for learning environments. The
Knowledge Engineering Review, 31(2), 124–141.
https://doi.org/10.1017/S0269888916000035
Mohri, M., Rostamizadeh, A., & Talwalkar, A. (2018).
Foundations of Machine Learning, second edition. MIT
Press.
Moneta, G. B. (2021). On the Conceptualization and
Measurement of Flow. In Advances in Flow Research
(pp. 31–69). Springer, Cham. https://doi.org/10.1007/
978-3-030-53468-4_2
Moneta, G. B., & Csikszentmihalyi, M. (1996). The effect
of perceived challenges and skills on the quality of
subjective experience. Journal of Personality, 64(2),
275–310. https://doi.org/10.1111/j.1467-6494.1996.tb0
0512.x
Nakamura, J., & Csikszentmihalyi, M. (2009). Flow Theory
and Research. In S. J. Lopez & C. R. Snyder (Eds.), The
Oxford Handbook of Positive Psychology (pp. 194–
206). Oxford University Press. https://doi.org/10.1093/
oxfordhb/9780195187243.013.0018
Peifer, C., Wolters, G., Harmat’, L., Heutte, J., Tan, J.,
Freire, T., Tavares, D., Fonte, C., Andersen, F. O.,
Hout, J. van den, Pola, L., Ceja, L., & Triberti, S.
(2022). A Scoping Review of Flow Research. Frontiers
in Psychology, 12. https://doi.org/10.3389/
fpsyg.2022.815665
Pfister, R. (2002). Flow im Alltag: Untersuchungen zum
Quadrantenmodell des Flow-Erlebens und zum
Konzept der autotelischen Persönlichkeit mit der
experience sampling method (ESM). Peter Lang.
Ramírez Luelmo, S. I., El Mawas, N., & Heutte, J. (2020).
Towards Open Learner Models Including the Flow
State. Adjunct Publication of the 28th ACM Conference
on User Modeling, Adaptation and Personalization,
305–310. https://doi.org/10.1145/3386392.3399295
Ramírez Luelmo, S. I., El Mawas, N., & Heutte, J. (2021).
Machine Learning Techniques for Knowledge Tracing:
A Systematic Literature Review. Proceedings of the
13th International Conference on Computer Supported
Education, 1, 60–70. https://doi.org/10.5220/00
10515500600070
Raschka, S., & Mirjalili, V. (2019). Python machine
learning: Machine learning and deep learning with
Python, scikit-learn, and TensorFlow 2 (Third edition).
Packt.
Rheinberg, F., & Engeser, S. (2018). Intrinsic Motivation
and Flow. In J. Heckhausen & H. Heckhausen (Eds.),
Motivation and Action (pp. 579–622). Springer Cham.
https://doi.org/10.1007/978-3-319-65094-4_14
Rheinberg, F., Vollmeyer, R., & Engeser, S. (2003). Die
Erfassung des Flow-Erlebens. In Diagnostik von
Selbstkonzept, Lernmotivation und Selbstregulation
[Diagnosis of Motivation and Self-Concept].
Rufi Cano, S., Javaloy, F., Batista-Foguet, J. M., Solanas
Pérez, A., & Páez, D. (2014). Flow dimensions on daily
activities with the Spanish Version of the Flow Scale
(DFS). Spanish Journal of Psychology, 17(30), 1–11.
https://doi.org/10.1017/sjp.2014.34
Salanova, M., Bakker, A. B., & Llorens, S. (2006). Flow at
work: Evidence for an upward spiral of personal and
organizational resources. Journal of Happiness Studies,
7(1), 1–22.
Skadberg, Y. X., & Kimmel, J. R. (2004). Visitors’ flow
experience while browsing a Web site: Its
measurement, contributing factors and consequences.
Computers in Human Behavior, 20(3), 403–422.
https://doi.org/10.1016/S0747-5632(03)00050-5
Wang, Y., & Baker, R. (2018). Grit and Intention: Why Do
Learners Complete MOOCs? The International Review
of Research in Open and Distributed Learning, 19(3).
https://doi.org/10.19173/irrodl.v19i3.3393
Watted, A., & Barak, M. (2018). Motivating factors of
MOOC completers: Comparing between university-
affiliated students and general participants. The Internet
and Higher Education, 37, 11–20.
https://doi.org/10.1016/j.iheduc.2017.12.001
Yousef, A. M. F., Chatti, M. A., Schroeder, U., Wosnitza,
M., & Jakobs, H. (2014). MOOCs—A Review of the
State-of-the-Art: Proceedings of the 6th International
Conference on Computer Supported Education, 9–20.
https://doi.org/10.5220/0004791400090020
Yuan, L., & Powell, S. J. (2013). MOOCs and open
education: Implications for higher education [Report].
Cetis. https://www.cetis.org.uk/
This project was funded by I-SITE Université Lille Nord-
Europe (ULNE), supported by the French state through
the General Secretariat for Investment (SGPI) and the
National Research Agency (I-SITE ULNE / ANR-16-
IDEX-0004 ULNE)
CSEDU 2022 - 14th International Conference on Computer Supported Education
134
