
Classification of EEG Motor Imagery Tasks Utilizing 2D Temporal
Patterns with Deep Learning
Anup Ghimire and Kazim Sekeroglu
Department of Computer Science, Southeastern Louisiana University, Hammond, LA, U.S.A.
Keywords: Deep Learning, Brain Computer Interface, Spatiotemporal Deep Learning, Hierarchical Deep Learning, EEG
Activity Recognition, Motor Imagery Task Recognition, Machine Learning, Convolutional Neural Network.
Abstract: This study aims to explore the decoding of human brain activities using EEG signals for Brain Computer
Interfaces by utilizing a multi-view spatiotemporal hierarchical deep learning method. In this study, we ex-
plored the transformation of 1D temporal EEG signals into 2D spatiotemporal EEG image sequences as well
as we explored the use of 2D spatiotemporal EEG image sequences in the proposed multi-view hierarchical
deep learning scheme for recognition. For this work, the PhysioNet EEG Motor Movement/Imagery Dataset
is used. Proposed model utilizes Conv2D layers in a hierarchical structure, where a decision is made at each
level individually by using the decisions from the previous level. This method is used to learn the spatiotem-
poral patterns in the data. Proposed model achieved a competitive performance compared to the current state
of the art EEG Motor Imagery classification models in the binary classification paradigm. For the binary
Imagined Left Fist versus Imagined Right Fist classification, we were able to achieve 82.79% average vali-
dation accuracy. This level of validation accuracy on multiple test dataset proves the robustness of the pro-
posed model. At the same time, the models clearly show an improvement due to the use of the multi-layer
and multi-perspective approach.
1 INTRODUCTION
This work aims to create a deep learning method to
recognize spatial and temporal patterns in EEG sig-
nals generated by the brain. The trained model could
be utilized to make predictions about the motor move-
ments based on the signals received from the EEG
machine. EEG data has been used to analyze brain ac-
tivity to identify neurological disorders and to recog-
nize patterns in brain activities related to various mo-
tor movements or even imagination of such motor ac-
tivities. These signals from the brain are measured at
specific locations on the skull and the usual approach
is to apply signal processing techniques to that data
for classification. Instead of using the usual 1D signal
data in the conventional way, this work attempts to
combine the readings of these sensors to form an “im-
age” of the brain. This opens possibilities of using
computer vision techniques in order to recognize spe-
cific patterns in the brain activities.
Deep learning is a state-of-the-art (SoA) method
in terms of image classification (Voulodimos, Dou-
lamis, Doulamis, & Protopapadakis, 2018). Trans-
forming single dimensional EEG signal data into a 2D
signal data allows the use of various image classifica-
tion techniques like convolutions in order to form
generalized predictions. Furthermore, transforming
the data in this way still preserves the temporal infor-
mation. It has been shown that analyzing both spatial
and temporal information in signals can improve the
accuracy of classification models for time series data
(Saha and Fels, 2019). This work attempts to use a
spatiotemporal deep learning method in order to rec-
ognize brain activities using EEG signals.
A Brain Computer Interface (BCI) is a system that
communicates the patterns of activities of a user’s
brain to an interactive system. In other words, this
could be a system where the only input is the signals
coming from the user’s brain. As an example, this
could be a user controlling the mouse pointer using
only their brain, i.e., imagining the pointer going in a
specific direction in order to make it do so. This
makes BCI an important tool for motor-impaired us-
ers to be able to use assistive systems such as text in-
put, smart prosthetic devices, wheelchairs, etc. Motor
Imagery (MI) is the process of mentally simulating a
given action. For example, moving an arm is a phys-
ical task, whereas imagining or thinking of moving an
182
Ghimire, A. and Sekeroglu, K.
Classification of EEG Motor Imagery Tasks Utilizing 2D Temporal Patterns with Deep Learning.
DOI: 10.5220/0011069400003209
In Proceedings of the 2nd International Conference on Image Processing and Vision Engineering (IMPROVE 2022), pages 182-188
ISBN: 978-989-758-563-0; ISSN: 2795-4943
Copyright
c
2022 by SCITEPRESS – Science and Technology Publications, Lda. All rights reserved

arm is the corresponding MI task. The models trained
in this work can be used to recognize EEG signals for
BCI as well as for the diagnosis of neurological dis-
orders by learning patterns in the EEG MI task data.
There has been some significant work in the field
of EEG MI task classification using deep learning re-
cently. Some of the methods used for these classifica-
tion tasks have a consistent pattern in the use of pre-
processing techniques as well as the methodology for
the classification process. Whenever the dataset in-
cludes a significant number of subjects, it appears
there is minimal need for preprocessing. There is also
a consistent use of pattern recognition methods that
use both spatial and temporal pattern learning tech-
niques in a fusion architecture.
Roots et al. worked with the BCI Competition IV
dataset with 103 subjects (Roots, Muhammad, & Mu-
hammad, 2020). They used bandpass and notch filters
on their time series data and used a fusion architecture
to classify MI Right Fist versus MI Left Fist. Their
model, which uses fusion of spatial and temporal fea-
tures achieved 83% validation accuracy for the binary
model. Wang et al. used the PhysioNet dataset for
their 2-class, 3-class and 4-class classification models
(Wang, et al., 2020). This work used no preprocessing
on the full 109 subject dataset. Their model was based
on the EEGNet structure. It used Conv2D layers to
learn spatiotemporal information with fusion struc-
ture. Their models achieved 75.07% and 82.50% val-
idation accuracy on the 3-class and 2-class models re-
spectively on MI Right Fist, MI Left Fist and MI Feet
labels. Dose et al. also used the full PhysioNet dataset
with 109 subjects (Dose, Møller, & Iverson, 2018).
They used no preprocessing method either. Their
model was trained on the global dataset and then fine-
tuned for each subject separately. Their 3 class clas-
sification had 68.82% validation accuracy while their
binary classification had 80.38% accuracy on their
global classifier.
In this study, we used the EEG Motor Move-
ment/Imagery Dataset that is a collection of 14 exper-
imental runs (Schalk, McFarland, Hinterberger,
Birbaumer, & Wilpaw, 2004). Each run was a motor
imagery recording performed by 109 subjects. This
dataset provides more than 1,500 such EEG record-
ings and is considered the largest EEG motor move-
ments and imagery dataset available (Goldberger, et
al., 2000).The subjects’ brain activity was recorded
while performing each of the four tasks:
1. Open and close the right or left fist
2. Imagine opening and closing the right or left fist
3. Open and close both fists or both feet
4. Imagine opening and closing both fists or both
feet
This paper is organized as follows: the previous
section introduced the problem, described the dataset
and explained some related work performed in the area
of EEG task classification; followed by the next chap-
ter that goes over the tranformation of raw EEG signals
into 3 dimensional image sequences representing each
MI task. The next chapter also describes the structure
of the multi-view hierarchical fusion model. The third
chapter goes over the results and discussions. Finally
the last chapter draws a conclusions and describes
some possible future direction for this work.
2 METHODS
2.1 Creating 2D Spatiotemporal EEG
Image Sequences
The raw EEG signals consist of multiple 1D time se-
ries data that show the electrical activity at specific
locations on the skull. The placement of the elec-
trodes is based on the international 10-10 system as
shown in Figure 1.
This collection of 1D series data is then trans-
formed into a time series of 2D data. The signal ac-
quired over a period [t, t+N] from each channel of the
EEG system can be represented by
E
i
=ൣc
t
i
, c
t+1
i
, c
t+2
i
, c
t+3
i
, …, c
t+N
i
൧ (1)
where i is the index of the channel and is the EEG
data acquired from the ith channel at time t. EEG data
collected from n number of channels over a period [t,
t+N] can be represented by matrix S as provided in
Figure 2. Each row of the matrix S is corresponding
to EEG data collected from a single channel over the
period [t, t+N], and each column of the matrix S is
corresponding to EEG data collected through all
channels at time t.
These new spatiotemporal images were created by
transforming each column matrix S into a 2D image,
as shown in Figure 2. This was done by mapping c
t
i
to
c
t
n
into a 9x9 matrix based on the actual location of
the electrodes on the head where the data was ac-
quired, as shown in Figure 1. This is the standard 10-
10 system of placement of electrodes for recording
EEG data. For example, the data acquired from the
first channel at time t is placed in the 3rd row and the
2nd column of the matrix S, which is the same loca-
tion where the first electrode is placed on the skull. In
the same figure, the pixel values marked as x are
empty values as there are no electrodes corresponding
to them. These are placeholders. This transformation
process is illustrated in Figure 2.
Classification of EEG Motor Imagery Tasks Utilizing 2D Temporal Patterns with Deep Learning
183
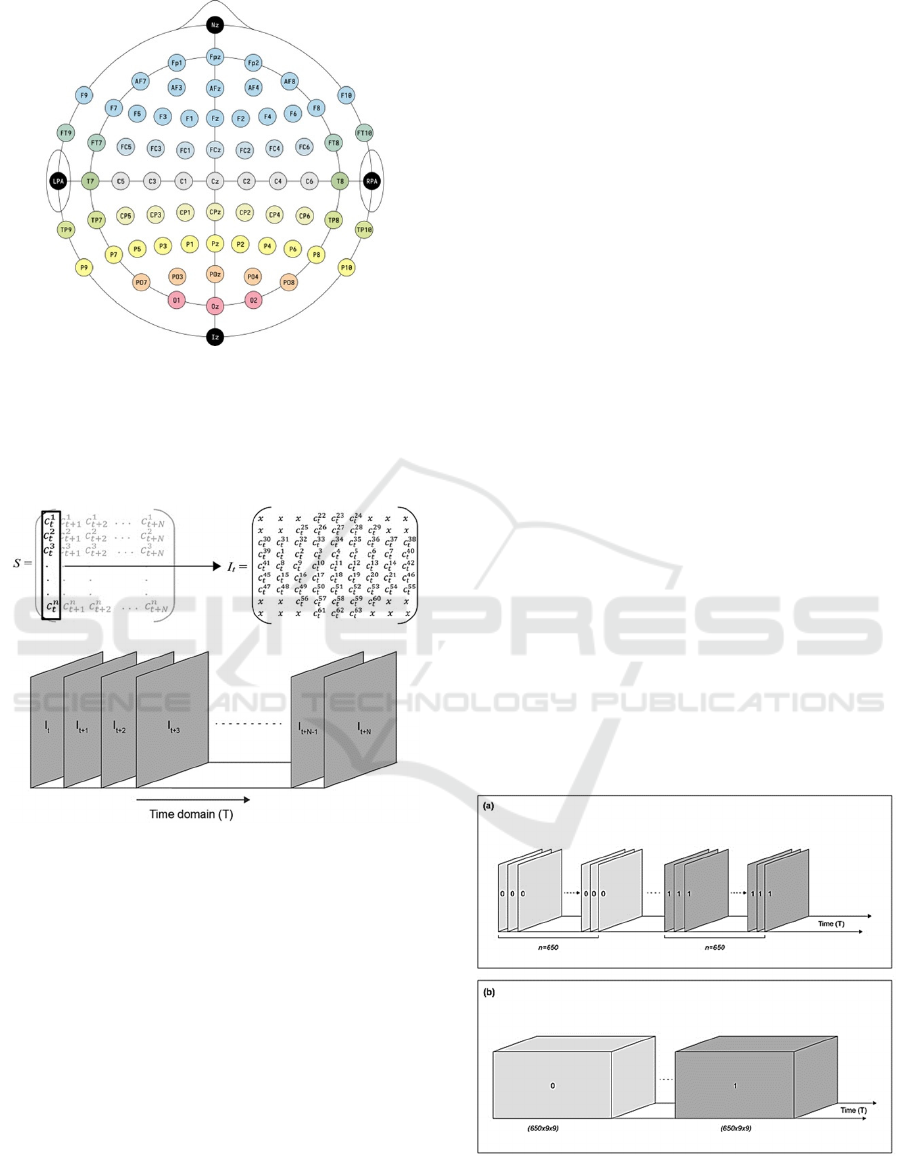
Figure 1: 10-10 system of electrodes.
As seen in Figure 2, a 2D spatiotemporal EEG im-
age sequence is created by transforming each column
of the matrix S into a 2D image. Each of the frames It
to It+N in the given sequences is temporally related.
Figure 2: Transformation of 1D EEG signals to 2D image
sequences.
2.2 Data Preparation
At this point, the data points ranged from -0.000655 to
0.000667. The data needed to be transformed a more
meaningful range. Thus, normalization was required.
Z-score normalization was applied to the data. A z-
score, also known as a standard score, is a measure of
how far from the mean any data point is (Hayes, 2021).
A z-score normalization is a data transformation
method where each data point is replaced by the z-
score. This normalization was performed such that the
placeholder values, shown in Figure 2 as x values, did
not skew the relevant data. Each EEG reading was re-
placed by its z-score, which is given by the formula:
z = (x - ) /
(2)
In the beginning, the raw EEG data was a collec-
tion of 1D sequences of data recorded by electrodes
at various locations on the human head. Then those
1D sequences were transposed into 2D arrays such
that they became images of the human head looking
from the top. The 1D arrays were transformed in a
logical manner that would clearly represent the posi-
tion of the electrodes on the head where the readings
were taken. Transforming the 1D data into 2D data
was a way to preserve the features while creating new
features that would represent the spatial correlations
between nearby electrodes as well as preserve the
temporal information from the original sequences.
The image sequences now represent the brain ac-
tivity of the subjects while performing the specific
motor actions with relation to time. Those sequences
of images can be thought of as a video of the activity
of the brain while those motor movements were per-
formed or imagined. Each action was carried out by
the subjects for a short period of time, which means
each action that was performed would be represented
by a series of those images. These images would be
back-to-back, creating one cohesive chunk of se-
quences that would be corresponding to only one ac-
tion that was performed. Because of this, it would
make more sense to unify all the images that were part
of just one action. This would mean separating the
images into one more dimension that would represent
the activity from start to finish. Analyzing the dataset
and the rate of recording of the data, it seemed every
single action was represented by roughly 650 data
points. This meant a collection of 650 back-to-back
9x9 images represented one single action. This data
transformation is further illustrated in Figure 3.
Figure 3: Creating 3D temporal data from 2D sequences.
In Figure 3 (a) the image sequences with the same
label are back-to-back with each other. Those image
IMPROVE 2022 - 2nd International Conference on Image Processing and Vision Engineering
184
sequences are combined in a stack of 650 images. In-
stead of each of the 650 images individually having a
label of 0, the whole block now has the label 0 as
shown in Figure 3 (b). Each of those blocks now has
shape (650,9,9).
2.3 Multiview Spatiotemporal
Hierarchical Deep Fusion Learning
Model for BCI
Although the transformed EEG data consists of 2D
spatiotemporal EEG images, EEG data collected over
a period [t, t+N] can be considered as 3D data in
which two of the dimensions are on the spatial do-
main and the third dimension is on the time domain,
as illustrated in Figure 2. In order to learn the spatio-
temporal patterns in the image sequences of the EEG
dataset, we required Deep Learning models capable
of modeling 3-dimensional data. As seen in the intro-
duction section of this work, there are two common
approaches for deep learning models for classifica-
tion of EEG data. The first approach is models that
learn spatial and temporal patterns in the data. The
second approach is models that utilize the fusion ar-
chitecture where different parts of the system learn
different patterns. In this approach, all the learned
patterns are then added to make a more cohesive sys-
tem. This work seeks to make use of both approaches
for modeling our EEG data.
We propose a custom hierarchical model that con-
sists of several 2D Convolutional models working to-
gether to model data from different perspectives. The
idea for the custom hierarchical model was to be able
to learn spatial patterns in the data from 3 different
perspectives, which made the hierarchical system a
spatiotemporal model (Sekeroglu, Soysal and Li,
2019).
The proposed custom hierarchical model aims to
examine the data from 3 different perspectives as
shown in Figure 4. Until this point, the input data was
4-dimensional, which separates each action into 650
images. These 650 images are treated as one singular
data point. The new hierarchical model would create
2 new data points for the same action. These new data
points would be the same as above but with the axes
swapped. As shown in Figure 6, the view from S
x
S
y
plane provides the information regarding the col-
lected data from all channels at time t. However, the
views from TS
x
and TS
y
planes provide information
regarding the collected data from certain channels
over a period. Thus, the new proposed models will
learn patterns in the data from three different views:
the first view based on S
x
S
y
plane, the second view
based on TS
x
plane and the third view based on TS
y
plane. Since the number of frames in the first view,
which is based on S
x
S
y
plane, will be much greater
than the number of frames in the second and the third
view, we need to split the data collected over a period
of time [t, t+N] into smaller time slots by a sliding
window approach where the window size is 650.
Figure 4: Creating multiple perspectives from EEG data.
The S
x
S
y
data pipeline feeds in the “main view”
models where the spatiotemporal relationship in the
EEG data is learned by looking at each “frame” of the
data from the top. The other two “side view” models
where the EEG data is viewed from the side as well
as from below, represent complex temporal infor-
mation and create some distinct patterns in the data.
These two models represent the TS
x
and TS
y
planes
in the above figure. These three perspectives and
these 3 models should learn the features in the EEG
data in a cohesive manner that would make the mod-
els perform well.
As Figure 5 shows the full structure of the pro-
posed hierarchical model. It consists of multiple Con-
volutional Neural Networks arranged in terms of lev-
els. Each of these levels learn different patterns in the
data. The first one is called the MF (Module Frame)
level. The models in this level (MF1, MF2, and MF3)
learn patterns directly from the image sequences or
image frames. These are the convolutional deep
learning models. The next level is called MP (Module
Plane) level. This level does not directly learn pat-
terns in the EEG data but learns patterns in the pre-
dictions made by the MF models. Then the MT (Mod-
ule Temporal) level is a concatenation of the 2 MP
models that specifically learn the temporal patterns,
i.e., MP2 and MP3. Then the last level is MST (Mod-
ule Spatio-Temporal). This is a concatenation of the
predictions from the MT model and the spatial pre-
diction from the MP1 model.
After each level, the outputs of the models are
concatenated and those predictions are used as input
for the models of the next level. The detailed structure
and hyper parameters for all three levels are provided
in Table 1.
Classification of EEG Motor Imagery Tasks Utilizing 2D Temporal Patterns with Deep Learning
185
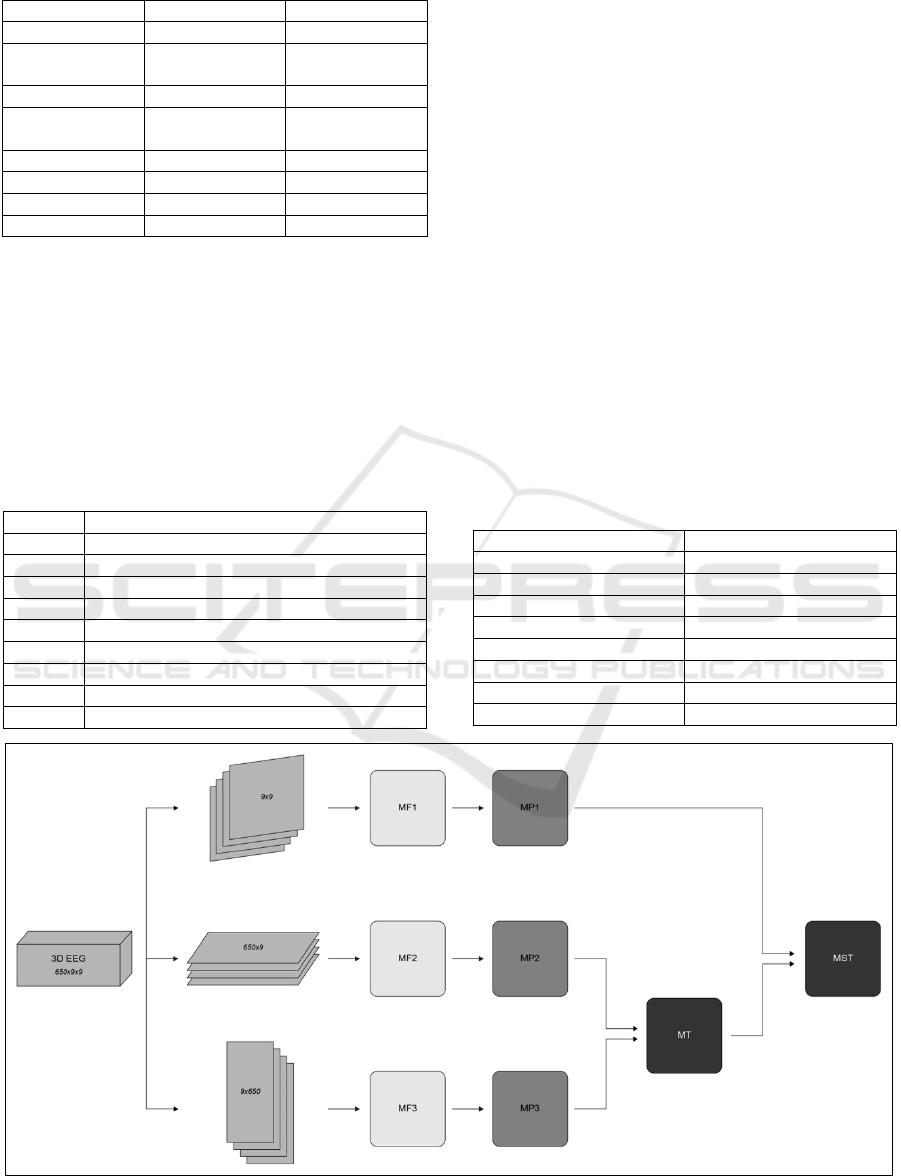
Table 1: Model layers and hyperparameters.
MF Models MP Models MT/MST
In
p
ut In
p
ut In
p
ut
Conv2D
(8 filters)
Dense
(128 neurons)
Dense
(64 neurons)
MaxPoolin
g
2D Dro
p
out
(
0.4
)
Dro
p
out
(
0.4
)
Conv2D
(12 filters)
Dense
(64 neurons)
Dense
MaxPooling2D Dropout (0.4) Output
Flatten Flatten
Dense Dense
Out
p
ut Out
p
ut
3 RESULTS AND DISCUSSION
As shown in Table 2, the data consisted of 9 labels.
Label 0 was the resting (control) action. Each subject
was asked to rest by the on-screen prompt before each
task was performed. This means that the label 0 is rep-
resented in the dataset more than any other label.
Table 2: Labels and corresponding tasks.
Label Tas
k
0 Rest
1 Open/Close Right Fist
2 O
p
en/Close Left Fist
3 Ima
g
ine O
p
en/Close Ri
g
ht Fist
4 Ima
g
ine O
p
en/Close Left Fist
5 Open/Close Both Feet
6 Open/Close Both Fists
7 Imagine Open/Close Both Fists
8 Ima
g
ine O
p
en/Close Both Feet
First, a baseline model with the full dataset and all
labels was trained. Training in this way, almost 50%
of the labels were 0. Because of the large class imbal-
ance as well as the high intra-class similarity between
the labels for physical and imaginary tasks, the opti-
mization of the loss was impossible. Hence, the
model never learned any features.
After this, most of the focus was switched to the
Motor Imagery (MI) tasks. The classification of EEG
patterns while the subjects imagined the tasks being
performed was the primary concern for this work. The
applications of this work are more dependent on the
accuracy of classification of the MI tasks than the
physical tasks. This is also consistent with the current
trend with the research work that was discussed ear-
lier in the paper. So, for this goal, the three most im-
portant labels were Imagine Open/Close Right Fist
(label 3), Imagine Open/Close Left Fist (label 4) and
Imagine Open/Close Both Feet (label 8). For training,
the first 10% and last 10% subjects were separated for
validation alternatively and the average accuracy
scores from the two were recorded.
Table 3: Accuracy for classification of 3 labels.
Models Accuracy (%)
MF1 36.97
MF2 54.4
MF3 48.03
MP1 46.42
MP2 67.08
MP3 56.18
MT 68.39
MST 69.08
Figure 5: Hierarchical fusion model architecture.
IMPROVE 2022 - 2nd International Conference on Image Processing and Vision Engineering
186
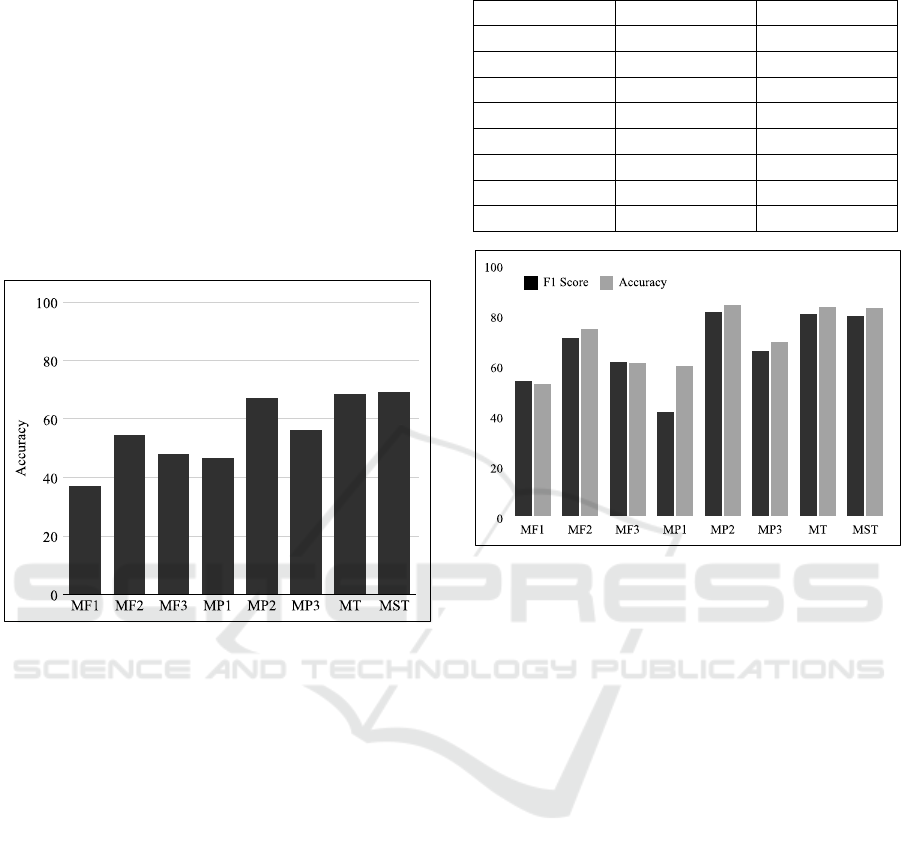
First the models were trained for 3 labels, MI
Right Fist (R), MI Left Fist(L) and MI Feet (F). Table
3 shows the accuracy values for each of the models
for the 3-label softmax classification. This tops out at
69.07% but the performance improvement from the
MF models to the MP models can better be seen in
Figure 6. There is also an improvement of the accu-
racy at the fusion models MT and MST. It is evident
that the fusion architecture with the multiple perspec-
tives helps mitigate the lower performance of the
MF1 and MP1 models. There is a clear improvement
in accuracy scores as we go further in the hierarchy
of the models.
Figure 6: Accuracy chart for 3-label classification.
Then the binary classification for the MI Right
Fist(R) and MI Left Fist(L) classes was performed.
Similar to above, the first 10% and last 10% of the
subjects were separated as a validation dataset and the
average scores for both the training runs were rec-
orded. Table 4 shows the accuracy as well as the F1
scores for the R versus L classification. The binary
classification achieves an average global validation
accuracy of 82.79% at the last fusion level. This is a
respectable score for an EEG MI task classification
for a global model with more than 100 subjects.
In addition to the models showing good perfor-
mance, in Figure 7 we can also see the model to model
improvement from the MF models to the MP models.
Also, similar to the 3 class classification, there is also
an improvement in the performance at the fusion levels
of the models. The first model (MF1) starts at around
50% accuracy, but the fusion structure means that the
overall system is able to compensate for its poor per-
formance. At the end of the hierarchical structure, the
other models completely make up for its lost perfor-
mance. This is yet another validating argument for the
fusion structure using the multi perspective approach.
Table 4: Accuracy and F1 score for binary classification.
Models F1 Score Accuracy (%)
MF1 53.67 52.76
MF2 70.99 74.41
MF3 61.44 60.77
MP1 41.56 59.91
MP2 81.12 83.98
MP3 65.83 69.21
MT 80.37 83.26
MST 79.60 82.79
Figure 7: Accuracy and F1 score chart for binary classifica-
tion.
4 CONCLUSION AND FUTURE
WORK
In this work, we used hierarchical deep learning mod-
els that learned spatiotemporal patterns in EEG data
for classification of motor imagery tasks. This work
has achieved robust performance in terms of binary
and respectable performance in terms of multi class
classification of those MI tasks.
Moreover, this work aimed to investigate the use-
fulness of fusion architecture and the multi view ap-
proach of learning the spatiotemporal information
from EEG data. The performance of the models has
shown that in general, a fusion architecture performs
better than a stand-alone model. Furthermore, we
were able to demonstrate an improvement in perfor-
mance of the models in the lower levels of the hierar-
chy. This validates the effectiveness of the hierar-
chical approach of the models in this work. In the re-
sults, we can also see that the side view models almost
always perform better than the main view models.
This has validated the use of the multi-view approach.
Classification of EEG Motor Imagery Tasks Utilizing 2D Temporal Patterns with Deep Learning
187

Table 5: Performance comparison of this work with recent related works.
Work Preprocessing Model Architecture Dataset Classification Accuracy
Roots
et al.
Notch Filter
Bandpass Filter
Conv2D with different Kernel Sizes
Features fused together for softmax
BCI Competition
103 subjects
2 classes 83.00%
Wang
et al.
No
preprocessing
Conv2D
Temporal and Spatial
Fused together
Based on EEGNET
PhysioNet
109 subjects
4 classes
3 classes
2 classes
65.07%
75.07%
82.50%
Dose
et al.
No
preprocessing
1D CNN on raw EEG signals
Learn Spatial and Temporal Features on global dataset
Finetune globally trained model for per subject training
PhysioNet
109 subjects
4 classes
3 classes
2 classes
58.58%
68.82%
80.38%
This
work
Z-Score
Normalization
Hierarichal 2D CNNs
PhysioNet
109 subjects
3 classes
2 classes
69.08%
82.79%
Table 5 shows the comparison between the per-
formance of the model in this work and some recent
works in the field of EEG Motor Imagery task recog-
nition. The binary classification of MI Right Fist ver-
sus MI Left Fist has achieved competitive results
compared to recently published works.
However, there is some room for improvement in
the approach used in this work. Here, we only used
Convolutions. Even for learning time-dependent pat-
terns, 2D Convolutions were used from different per-
spectives. A more complex form of convolutions
could be used to learn spatial and temporal infor-
mation at the same time without needing to break up
the dataset into individual frames. This could be ac-
complished by using the Conv3D layers. Effectively
using the multi view approach in the same manner,
but instead of analyzing each frame from the three
perspectives, 3D convolutions would look at all the
frames as one. Also, convolutions are not the only
way to learn patterns in data. They are not even the
most used method for time sensitive data. True spati-
otemporal models use a fusion of Conv layers for spa-
tial information and LSTM layers for temporal infor-
mation. So, a fusion architecture between a Conv2D
and an LSTM layer could be investigated. There is
also room for investigation with a sliding window ap-
proach using the TimeDistributed layers.
ACKNOWLEDGEMENTS
Research reported in this publication was supported
by the Louisiana Board of Regents Research Compet-
itiveness Subprogram (RCS) under the contract num-
ber LEQSF(2019-20)-RD-A-19.
REFERENCES
Dose, H., Møller, J. S., & Iverson, H. K. (2018). An End-
to-end Deep Learning Approach to MI-EEG Signal
Classification for BCIs. Expert Systems With Applica-
tions, 114, 532-542.
Goldberger, A., Amaral, L., Glass, L., Haussdorf, J.,
Ivanov, P. C., Mark, R., & Stanley, H. E. (2000). Phys-
ioBank, PhysioToolkit, and PhysioNet: Components of
a new research resource for complex physiologic sig-
nals. Circulation, 101(23), e215-e220.
Hayes, A. (2021, February 20). Z-Score: Definition. In-
vestopedia. Retrieved January 1, 2022, from
https://www.investopedia.com/terms/z/zscore.asp
Roots, K., Muhammad, N., & Muhammad, Y. (2020). Fu-
sion Convolutional Neural Network for Cross-Subject
EEG Motor Imagery Classification. Computers, 9(72).
Saha, P., & Fels, S. (2019). Hierarchical Deep Feature
Learning for Decoding Imagined Speech from EEG.
The Thirty-Third AAAI Conference on Artificial Intelli-
gence (AAAI-19). Honolulu.
Sekeroglu, K., Soysal, O. M. & Li X. (2019). Hierarchical
Deep-Fusion Learning Framework for Lung Nodule
Classification. 15th International Conference on Ma-
chine Learning and Data Mining (MLDM 2019).New
York, USA
Schalk, G., McFarland, D. J., Hinterberger, T., Birbaumer,
T., & Wilpaw, N. (2004). J.R. BCI2000: A General-
Purpose Brain-Computer Interface (BCI) System. IEEE
Transactions on Biomedical Engineering, 51(6), 1034-
1043.
Voulodimos, A., Doulamis, N., Doulamis, A., & Protopa-
padakis, E. (2018). Deep Learning for Computer Vi-
sion: A Brief Review. Computational intelligence and
neuroscience.
Wang, X., Hershe, M., Tömekce, B., Kaya, B., Magno, M.,
& Benini, L. (2020). An Accurate EEGNet-based Mo-
tor-Imagery Brain–Computer Interface for Low-Power
Edge Computing. 2020 IEEE International Symposium
on Medical Measurements and Applications (MeMeA).
Virtual.
IMPROVE 2022 - 2nd International Conference on Image Processing and Vision Engineering
188
