
In the Flow: A Case Study on Self-paced Digital Distance Learning on
Business Information Systems
Anke Schüll
a
and Laura Brocksieper
Department of Business Information Systems, University of Siegen, Kohlbettstr. 15, Siegen, Germany
Keywords: Self-paced e-Learning, Flow, Business Information Systems.
Abstract: This paper investigates the acceptance of a self-paced digital distance learning environment on courses about
Business Information Systems and Management & Control of IT at a university. The aim of the environment
was to avoid monotony and to actively involve the students into their learning process. The course content
was split into small units arranged onto an online roadmap. Different design elements were used along the
progress on the roadmap, each adding to the content, contributing to clarification, understanding, repetition
or memorization. Students could proceed at their own pace, but there was a timetable for discussing the
content in accompanying videoconferences and corresponding deadlines for the tasks to be completed. The
concept was evaluated in a real-life learning situation following the Unified Theory of Acceptance and Use
of Technology (UTAUT), slightly modified to the context. The case study contributes to the body of
knowledge by providing a selection of design elements that can be combined to enrich students’ learning
experiences. The outcomes of the evaluation underline the importance of “flow” for the acceptance of e-
learning environments.
1 INTRODUCTION
In 1999 Weiser and Wilson propagated video
streaming on the internet as a way to provide course
content for students geographically isolated from
educational and academic institutions. Within their
case study, they described the distance learning
programs of their time as poor cousins to traditional
campus-based programs, stigmatized as a necessary
evil, yet unequal to traditional courses (Weiser and
Wilson 1999).
In 2020, Anthonysamy et al. characterized digital
technology as a “catalyst for transformation in
education in this twenty-first century”. That was even
before the pandemic took hold of academic
institutions worldwide and forced them into a rapid
learning curve on digitally-supported distance
learning.
During the pandemic, many universities closed,
separating students from their academic institutions.
Distance learning programs were initiated to make up
for the lack of personal contact, relying heavily on
digital learning materials. And even though massive
advances in digital technology now would allow the
a
https://orcid.org/0000-0001-9423-3769
“creation of true student-centred learning models”
(Weiser and Wilson 1999), the stigma as an inferior
learning method and a compromise to circumstances
still sticks. The case study presented in this paper
aims to extricate or diminish the stigma by providing
a case study on self-paced digital distance learning,
using a selection of design elements suitable for
enriching the learning experience for student learners
in an academic context.
Digital learning can be described as any
instructional practice relying on digital technology
that effectively supports the learning experience
(Anthonysamy et al. 2020). Active engagement in the
learning process, instead of passive transmission, can
be supported by digital means.
Liu et al. (2005) underline that e-learning
providers should recognise their users not only as
users of a system, but also as learners. They point out
that, in mixed-media e-learning environments, the
design philosophy should emphasize presentations
suitable for building up user’s concentration. Self-
paced e-learning tools can assist in learning content,
preparing lessons or exams as well as in improving
personal skills like problem-solving or meta-
cognitive skills (Marshman et al. 2020).
332
Schüll, A. and Brocksieper, L.
In the Flow: A Case Study on Self-paced Digital Distance Learning on Business Information Systems.
DOI: 10.5220/0011068000003179
In Proceedings of the 24th International Conference on Enterprise Information Systems (ICEIS 2022) - Volume 2, pages 332-339
ISBN: 978-989-758-569-2; ISSN: 2184-4992
Copyright
c
2022 by SCITEPRESS – Science and Technology Publications, Lda. All rights reserved
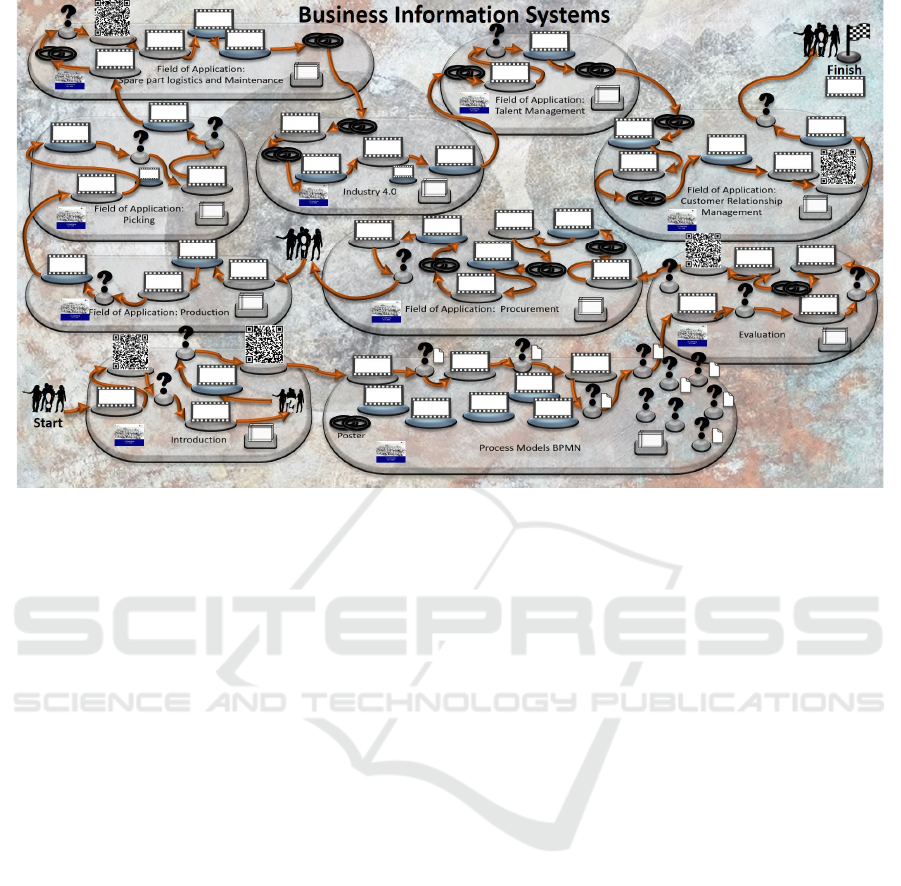
Figure 1: Roadmap of the course on Business Information Systems.
Students have access to the material, anytime and
anywhere, thereby enabling them to learn
individually, at their own pace (Bautista 2015). Self-
paced learning provides availability of the necessary
resources for learning and encourages students to
organize their learning process autonomously,
independently from the lecturer (Anurugwo 2020),
thus preparing for lifelong learning.
2 ROADMAP OF THE COURSE
The self-paced e-learning environment presented in
this paper was developed in reaction to the pandemic.
The sudden necessity to switch from traditional
teaching/learning situations to digital distance
learning was regarded as a chance to reconsider what
the courses are about and to adapt the means to the
content. The audience of the course on Business
Information Systems are students of BA Business
Administration, BA Economics, and BA Business
Law. At the end of the course, students should be
capable of modeling business processes as a starting
point for the development or evaluation and
customizing of business information systems. They
should be aware of the penetration of businesses with
information systems and should be able to engage in
digital transformation within selected fields of
application.
That successful digitalization goes beyond a mere
electrification of existing processes towards a radical
rethinking of this process, was a frequently repeated
mantra of the course. When considering the challenge
of digital distance learning/teaching, a good sip of our
own medicine seemed overdue. A thorough look at
the learning goals and the content led to the
development of an asynchronous, self-paced e-
learning platform to cover the course content. The
roadmap (figure 1) was accessible on a website. All
materials were online at the beginning of the
semester.
All courses were held online, due to the covid-19-
pandemic. With students spending most of their time
in the learning management system of our university,
a “non-pedagogical” appearance was decided on to
create a more relaxing environment, unrelated to
“learning”. Asynchronous learning allows students to
access training content anywhere and anytime
(Wilson and Weiser 2001). We opted for a rich media
approach, as previous studies revealed that the
acceptance rate of mixed media-based e-learning
content is higher because it generates a high user
concentration (Liu et al. 2005). Thus, different media
and tools were combined to relieve the monotony.
Mini quizzes and learning cards were implemented in
ARSnova (ARSnova 2017), an audience response
system, to trigger students’ engagement (Gröblinger
et al. 2016). As the attention span in digital media is
limited, videos last no longer than 20 minutes. For
variety, internal videos were enriched by external
In the Flow: A Case Study on Self-paced Digital Distance Learning on Business Information Systems
333
videos. URLs were included, linking examples,
software applications and case studies into the
curriculum, without infringement of copyrights.
Even though the learning environment covered
the relevant content, it was accompanied by weekly
video conferences to discuss the content and the
results of the assignments. Even though limited to the
chat function of the video conferencing tool, students
made use of these communication channels to speak
out, ask questions, or to provide additional examples
or recommendations for other students.
The students were encouraged to work
asynchronously and at their own speed. The course’s
roadmap, in combination with a timetable for
discussing the topics gave the students the flexibility
to proceed at will, while keeping a certain pace,
encouraging continuity, and allowing them to connect
with their lecturer and their co-students.
The roadmap’s design elements are largely self-
explanatory (table 1). In the summer semester 2020,
another course was transformed into a similar
concept: Management & Control of IT. Content,
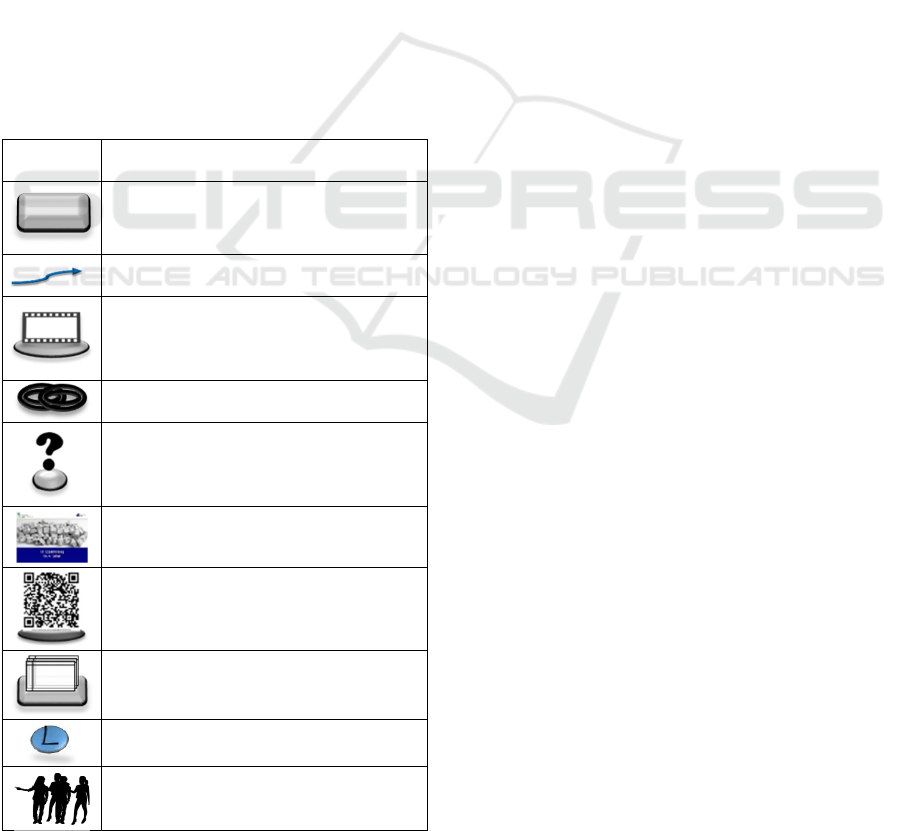
Table 1: Design Elements of the Roadmap.
Design
Element
Function
Each panel corresponds to a chapter of the
course, thus providing visual clues of the
content structure.
Arrows lead the way along the roadmap,
from start to finish.
This icon refers to mini videos on the content
of the course. Videos with external content
(e.g., examples or case studies) are marked
in blue.
URLs link to examples or other practical
clarifications of the content.
This icon is linked with a pdf document
containing tasks and assignments, to deepen
the knowledge or to research specific
content.
The set of slides for each chapter is linked to
this icon as a pdf document.
QR codes link to mini-quizzes or small
evaluations. The icon is linked with a URL,
so that access is granted to the quiz, even
without scannin
g
the QR code.
This icon can be found at the bottom right of
each panel. It is linked to electronic learning
cards for each chapter.
This icon leads to additional
recommendation of selected literature.
The link to the online survey was included
behind this icon.
layout and design of the roadmap were different but,
except for one, the design elements used for a
digitalization of the course were the same: Additional
literature recommendations were included that went
beyond those already included into the slides.
3 RESEARCH MODEL
The design elements and the students’ perception of
the self-learning environment could be explored in a
natural, real-life context, providing the preliminaries
for case study research (Crowe et al. 2011). This case
could be linked to hypotheses (Flyvbjerg 2016),
followed by a quantitative evaluation. The evaluation
of the acceptance of the learning environment was
based on the unified theory of acceptance and use of
technology (UTAUT) (Venkatesh et al. 2003). The
model aims to explain the use of a type of technology
by the individual perception of four core constructs:
performance expectancy, effort expectancy, social
influence, and facilitating conditions (Yang et al.
2019). This model extends the expressive power of
the Technology Acceptance Model (TAM) (Davis
1989). With UTAUT2 (Venkatesh et al. 2012) this
model was extended to take the specific factors into
account that influence customers’ use of technology:
hedonic motivation, price value and habit (Ain et al.
2016). Within the learning context, several studies are
based on TAM (e.g., Saadé and Bahli 2005; Al-
Azawei et al. 2015; Ibrahim et al. 2018), UTAUT
(e.g., Chao 2019; Almaiah et al. 2019; Salloum and
Shaalan 2019; Persada et al. 2019; Raza et al. 2021)
or UTAUT2 (e.g., Ain et al. 2016; Raman and Don
2013; Arain et al. 2019; Kang et al. 2015. This study
relies mainly on UTAUT and TAM, slightly adopted
to the context.
Perceived usefulness (PU) describes the degree to
which an individual believes that using a certain type
of technology will help to enhance his or her job
performance (Venkatesh and Davis 2000). The job
for students, or rather the assigned tasks within an
academic context, is to accomplish the learning goals.
Adopted to this context, PU can be defined as the
degree of perceived usefulness for accomplishing the
assigned learning goals. E-learning can support
learning activities and uplift educational skills and
performance (Salloum and Shaalan 2019). Therefore,
it is posited that performance expectancy (PE) has a
significant and positive influence on PU (H
1
).
Facilitating conditions (FC) refer to the technical and
organizational infrastructure supporting the use of the
e-learning system (Salloum and Shaalan 2019). As
these factors ease the accessibility of the content
ICEIS 2022 - 24th International Conference on Enterprise Information Systems
334

required to achieve the learning goals, it is posited
that facilitating conditions have a positive impact on
perceived usefulness of e-learning environments
(H
2
). As the platform works within a web page
requiring almost no support, the focus was shifted
onto accessibility and availability of the learning
content. Increasing maturity of e-learning
environments will improve the user friendliness and
will ease the effort to use them (Salloum and Shaalan
2019). This led to the hypothesis that the degree of
ease related to the use of an e-learning environment
has a positive effect on its usage to achieve the
assigned learning goals (H
3
). The perceived degree of
ease is measured by effort expectancy (EE)
(Venkatesh et al. 2003).
Liu et al. (2005) underline that, within e-learning
environments, users should be recognized as learners,
and the design philosophy should be dedicated to
building up users’ concentration. Csikszentmihalyi
(1990) coined the term “flow” to describe the
psychological state when an individual becomes so
totally absorbed by their activity that they lose their
sense of time or their awareness for their
surroundings. When students reach a state of “flow”,
they concentrate entirely on their learning activity,
which can play a major role in online learning
behaviour (Liu et al. 2005). A study by Saadé and
Bahli (2005), revealed a significant positive effect of
cognitive absorption on PU. Therefore, we posit (H
4
)
that flow (F) has a positive influence on
accomplishing the assigned learning goals (PU).
PU is a strong predictor of the intention to use a
certain technology (Venkatesh et al. 2003), thus H
5
posits that PU has a positive effect on the behavioral
intention (BI) to use the digital learning environment.
Image and social influence describe an effect of
compliance to subjective norms by performing a
specific behavior that a person perceives to be
expected by their social surroundings (Venkatesh and
Davis 2000). During the pandemic, students suffered
from social isolation, diminishing the impact of social
influence. Within this rather exceptional situation,
any acceptance or dismissal of a hypothesis on the
impact of social influence on perceived usefulness of
the e-learning platform discussed in this paper would
be biased by the circumstances and incomparable to
previous or following studies. Taking this into
account, social influence was omitted from the
research model with some regret.
An anonymous online survey was conducted
among the students enrolled in both courses that are
following the same design principles: a course on
Management and Control of IT (3
rd
/5
th
semester
students, summer 2020) and another on Business
Information Systems (1
st
semester, autumn 2020/21).
As the evaluation of students with higher grades
preceded the evaluation of the course for minors, the
student groups didn’t overlap. The students were
invited to participate in the survey. The participation
was voluntary, there were no incentives, neither gifts,
nor credit points. No personally identifiable
information was gathered. Analysis of the data was
restricted to gaining insights for further development
of the learning environments and for research
purposes. As all students are undergraduate and of
about the same age, and a moderating effect of gender
not the interest of our research, demographic items
were omitted from the questionnaire. A five-point
Likert scale was applied to measure the items (table
2). Some items were inverted. Overall, 361 students
participated in the survey. 139 data sets were
incomplete and had to be dismissed, leaving 222 data
sets for further analysis.
Table 2: Items (PE - Performance Expectancy, FC –
Facilitating Conditions, EE – Effort Expectancy, F – Flow,
PU – Perceived Usefulness, BI – Behavioral Intention).
Code Mean SD Code Mean SD
PE1 3.410 1.106 EE1 4.086 1.335
PE2 3.973 1.301 EE2 4.050 1.299
PE3 4.284 1.324 EE3 4.036 1.252
PE4 4.104 1.357 EE4 4.135 1.273
FC1 3.649 1.140 PU1 3.757 1.172
FC2 4.068 1.325 PU2 3.770 1.149
FC3 3.721 1.246 PU3 3.604 1.247
FC4 3.671 1.327 PU4 3.536 1.176
F1 3.387 1.050 PU5 3.586 1.139
F2 3.189 1.212 BI1 4.018 1.298
F3 3.482 0.985 BI2 3.806 1.298
F4 3.667 1.064 BI3 3.959 1.275
F5 3.554 1.067 BI4 3.383 1.363
4 DATA ANALYSIS
The research model was evaluated using partial least
square (PLS) modeling, as this approach is widely
used in IS research. Using Smart-PLS (v3.3.3)
(Ringle et al. 2015), we first evaluate reliability and
validity of the measurement model, followed by an
evaluation of the structural model.
Cronbach’s alpha was calculated to ensure
internal consistency among the items (table 3). The
value is greater than 0.7, thus fulfilling the criteria
(Tabachnick and Fidell 2014). With a Cronbach’s
alpha > 0.9 on EE and PE, the value is almost too high
for these constructs. The composite reliability (CR)
should be above 0.7 to indicate a reliability of the
In the Flow: A Case Study on Self-paced Digital Distance Learning on Business Information Systems
335

results (Hair et al. 2006), which is true for all
constructs. The Average Variance Extracted (AVE).
indicates the convergence validity of the constructs
and ranges from 0.661 to 0.952, all well above the
threshold of 0.5 (Fornell and Larcker 1981).
Table 3: Scale Reliability (PE - Performance Expectancy,
FC – Facilitating Conditions, EE – Effort Expectancy,
F – Flow, PU – Perceived Usefulness, BI – Behavioral
Intention).
Cronbach's
Alpha
Composite
Reliabilit
y
Average Variance
Extracted (AVE)
BI 0.888 0.923 0.751
FC 0.871 0.913 0.725
EE 0.975 0.983 0.952
F 0.868 0.906 0.661
PU 0.933 0.949 0.788
PE 0.890 0.925 0.756
Cross Loadings confirm that the loading of each
item on its own constructs is higher than on the others,
and the item loadings on the construct are all above
0.7, thus confirming individual reliability (table 4).
Table 4: Cross-Loadings (PE - Performance Expectancy,
FC – Facilitating Conditions, EE – Effort Expectancy,
F – Flow, PU – Perceived Usefulness, BI – Behavioral
Intention).
BI FC F EE PE PU
BI1 0.857 0.686 0.628 0.677 0.731 0.705
BI2 0.931 0.743 0.730 0.612 0.780 0.784
BI3 0.907 0.783 0.661 0.714 0.784 0.756
BI4 0.763 0.511 0.581 0.341 0.610 0.589
FC1 0.687 0.883 0.619 0.617 0.692 0.675
FC2 0.736 0.885 0.568 0.812 0.788 0.693
FC3 0.714 0.904 0.612 0.670 0.684 0.677
FC4 0.549 0.721 0.464 0.430 0.490 0.507
F1 0.561 0.515 0.786 0.365 0.538 0.568
F2 0.346 0.292 0.625 0.206 0.306 0.386
F4 0.692 0.633 0.877 0.450 0.599 0.638
F5 0.700 0.638 0.882 0.593 0.631 0.645
F6 0.685 0.565 0.866 0.492 0.576 0.626
EE1 0.658 0.734 0.509 0.982 0.727 0.659
EE2 0.688 0.755 0.555 0.970 0.752 0.679
EE4 0.665 0.720 0.505 0.975 0.719 0.663
PE1 0.653 0.587 0.618 0.402 0.750 0.605
PE2 0.711 0.692 0.549 0.682 0.902 0.665
PE3 0.803 0.759 0.600 0.799 0.925 0.741
PE4 0.751 0.692 0.561 0.693 0.890 0.696
PU1 0.745 0.706 0.625 0.676 0.725 0.885
PU2 0.741 0.738 0.662 0.670 0.746 0.884
PU3 0.727 0.599 0.638 0.576 0.656 0.881
PU4 0.706 0.602 0.617 0.498 0.659 0.901
PU5 0.725 0.688 0.632 0.597 0.670 0.887
Discriminant validity can be confirmed by the
Fornell-Larcker Criterion (table 5). The AVE square
root is presented as bold values in the upper values of
each column. These values should be above 0.5 and
higher than the squared correlation of the other
constructs (Fornell and Larcker 1981). Table 5 shows
that the Fornell-Larcker Criteron is satisfied, thus
confirming discriminant validity.
Table 5: Fornell-Larcker Scale (PE - Performance
Expectancy, FC – Facilitating Conditions, EE – Effort
Expectancy, F – Flow, PU – Perceived Usefulness,
BI – Behavioral Intention).
BI FC EE F PU PE
BI 0.867
FC 0.794 0.852
EE 0.687 0.755 0.976
F 0.752 0.668 0.536 0.813
PU 0.822 0.755 0.684 0.716 0.888
PE 0.842 0.788 0.751 0.668 0.781 0.869
To test the hypotheses, a bootstrap procedure was
applied with 1,000 subsamples and a significance
level of 0.05. The path coefficients and the t-values
support all hypotheses (table 6).
In this context PU is defined as the degree of
perceived usefulness for accomplishing the assigned
learning goals. With H
1
it was postulated that
performance expectancy has a significant and
positive influence on perceived usefulness (PU),
which was supported by this data set (β = 0.332; t =
4.237 and p < 0.05).
Table 6: Path coefficients (PE - Performance Expectancy,
FC – Facilitating Conditions, EE – Effort Expectancy, F –
Flow, PU – Perceived Usefulness, BI – Behavioral
Intention).
Hypothesis
Path
Coefficients
T Statistics
(|
O/STDEV
|)
P
Values
H
1
: PE ->PU 0.332 4.237 0.000
H
2
: FC -> PU 0.206 2.765 0.006
H
3
: EE -> PU 0.123 1.999 0.046
H
4
: F -> PU 0.290 5.253 0.000
H
5
: PU -> BI 0.822 32.754 0.000
ICEIS 2022 - 24th International Conference on Enterprise Information Systems
336

This is consistent with previous research in the e-
learning context (e.g. Mahande and Malago 2019).
Several students used the free text form to elaborate
on this. Some sample statements: “What I liked most
was that I could decide myself, if and how much I like
to learn in a week.”
“Better than most, because you could decide on
the pace yourself, relisten without hurry and do some
research on the internet without missing parts of the
lecture.”
“I prefer working on something on my own,
therefore I liked the self-paced environment a lot. I
think that I could remember the content better than in
other courses.”
“I enjoyed the course a lot. The topics don’t drag
too long and to every topic there are examples from
reality. The practical examples make everything
understandable and anchors the knowledge in the
brain.”
Students’ learning preferences as well as their
perception of the learning setting differ, and the
learning environment didn’t work well for all of them.
Some statements reveal a more critical perception.
Difficulties were voiced in relating the content to the
assigned learning goals and in prioritizing the
content: “Not bad, but in some articles and videos it
is hard to figure out what to take out of it. They were
not uninteresting, but you didn’t really learn a lot. I
have no clue what I should have learned out of all
these parts.” Others underlined their preference for
traditional lectures: “[…] I would have preferred
learning a bit more dynamically – directly from the
lecturer and at the university. Nonetheless, I like
having the option to do everything from home.”
That facilitating conditions have a positive impact
on perceived usefulness of e-learning environments
(H
2
) was also supported (β = 0.206; t = 2.765 and p <
0.05). This is in line with, e.g., Mahande and Malago
(2019). Within the items, the accessibility of the
content of the learning platform was the dominant
aspect. Several students commented on a low voice
quality in the explanatory videos. These require
massive improvement, and some found the layout
confusing. With H
3
it was postulated that the degree
of ease, related to the use of an e-learning
environment, has a positive effect on its usage to
achieve the assigned learning goals. The hypothesis
was supported by this data set (β = 0.123; t = 1.999
and p < 0.05). This is in accordance with literature
(e.g., Mahande and Malago 2019), but it is necessary
to point out that this hypothesis would not have been
accepted at another level of significance.
That flow has a significant influence on perceived
usefulness (H
4
) was also supported by the data of this
data set (β = 0.290; t = 5.253 and p < 0.05). Flow can
come with a high concentration on the learning
activity. Therefore, it can be an important factor in
online learning behaviour (Liu et al. 2005). Several
students wrote about “fun” in their comments, e.g.,
“It’s really fun to learn like this, and some facts are
easier to understand.” Another student mentioned
becoming carried away: “I finished more than half of
the self-learning environment within three days; not
because I would like to finish the course, but because
it is difficult to stop, once you started.
”Some students commented on curiosity: “The
playful roadmap arouses my curiosity”. At the
beginning, I thought Business Information Systems
would not interest me at all, but my curiosity grew
with every panel.” This is in line with previous
literature on learning management systems, in which
a significant positive effect of cognitive absorption
and pleasure on PU became evident (Saadé and Bahli
2005).
Avoiding monotony and activating the students
was an important aspect of this learning environment.
One student wrote that “the many short videos are
more motivating to proceed than a […] script,
because of the variation, and it is more interesting.”
The data set and the comments indicate that the
concept worked for many but not for all students: “I
can’t complain, but it takes a lot of discipline to work
with the learning environment.”
H
5
posits that PU has a positive effect on the
behavioral intention (BI) to use the digital learning
environment. This hypothesis was also supported (β
= 0.822; t = 32.754 and p < 0.05), which is in line with
previous studies (e.g. Liu et al. 2005).
5 CONCLUSIONS
During the pandemic, lecturers worldwide struggled
to find new ways of distance teaching. They
developed new skills in media production, video
editing, video conferencing and social media usage.
Over the months, they fought their way along a steep
learning curve and some innovative learning/teaching
concepts evolved. However, even though
“digitalization” is the magic bullet transforming
business processes worldwide, when it comes to
courses, the stigma of digitalization as being an
inferior learning method to traditional courses sticks.
The case study presented in this paper aims to
extricate the stigma. This paper contributes to the
body of knowledge on self-paced digital distance
learning, by providing a selection of design elements
suitable for enriching the learning experience for
In the Flow: A Case Study on Self-paced Digital Distance Learning on Business Information Systems
337

student learners in an academic context and by
validating the concept in a real-time learning
situation. Students appreciate having access to
explanatory videos anywhere and anytime. They
appreciate the flexibility to choose when and where
to learn, thus taking responsibility for their own
learning process. The evaluation underlines the
importance of “flow” for the acceptance of e-learning
environments and shows examples of design
elements that can be combined to enrich students’
learning experiences.
There are several limitations to take into
consideration: The survey was embedded into the
learning environment at the very end. Not all students
came that far. Students who skipped the course did
not participate in the survey, therefore the results will
be biased.
Restricting the analysis on the acceptance of this
specific platform, allows an evaluation more pointed
towards the learning goal, yet with the price of losing
the necessary number of participants to calculate
statistically reliable numbers. The self-paced digital
distance learning environment presented here, and the
evaluation on its acceptance may not generalize well,
but the students participating in the survey are the
target group. Their impression, their feedback and
their hints to further improvements are highly
relevant for the next iteration of self-learning
environments developed for the next courses in the
semesters to come. Evaluating the results on a broader
scale would be a suggestion for further research.
Due to the urgency of the situation, the concept
had to prove itself in a real-life learning situation.
Thus, there is no control group for comparing the
results. Another aspect to consider is that, due to the
pandemic-circumstances, the platform wasn’t used
voluntarily. If students would choose these platforms
at will, this would be worth further exploration. As
the situation was exceptional, an evaluation of this
platform in a standardized situation would be
recommended.
Early research on asynchronous learning already
raised the concern of lacking interaction between
students and faculty, and the fear of some faculties
that e-learning would make instructors obsolete
(Wilson and Weiser 2001). Within their pilot study,
Wilson and Weiser brought up two research
questions: Will students quit attending classes when
an asynchronous mode of learning is available? Will
they use the available technology to assist their
learning process or to support their laziness? (Wilson
and Weiser 2001). Twenty years later, these questions
still need to be answered.
REFERENCES
Ain, NoorUl; Kaur, Kiran; Waheed, Mehwish (2016): The
influence of learning value on learning management
system use. In Information Development 32 (5),
pp. 1306–1321. DOI: 10.1177/0266666915597546.
Al-Azawei, Ahmed; Parslow, Patrick; Lundqvist, Karsten
(2015): Investigating the effect of learning styles in a
blended e-learning system: An extension of the
technology acceptance model (TAM). In AJET. DOI:
10.14742/ajet.2741.
Almaiah, Mohammed Amin; Alamri, Mahdi M.; Al-Rahmi,
Waleed (2019): Applying the UTAUT Model to
Explain the Students’ Acceptance of Mobile Learning
System in Higher Education. In IEEE Access 7,
pp. 174673–174686. DOI:
10.1109/ACCESS.2019.2957206.
Anthonysamy, Lilian; Koo, Ah-Choo; Hew, Soon-Hin
(2020): Self-regulated learning strategies and non-
academic outcomes in higher education blended
learning environments: A one decade review. In Educ
Inf Technol 25 (5), pp. 3677–3704. DOI:
10.1007/s10639-020-10134-2.
Anurugwo, Appolonia O. (2020): ICT Tools for Promoting
Self-paced Learning among Sandwich Students in a
Nigerian University. In European Journal of Open
Education and E-learning Studies 5 (1).
Arain, Aijaz Ahmed; Hussain, Zahid; Rizvi, Wajid H.;
Vighio, Muhammad Saleem (2019): Extending
UTAUT2 toward acceptance of mobile learning in the
context of higher education. In Univ Access Inf Soc 18
(3), pp. 659–673. DOI: 10.1007/s10209-019-00685-8.
ARSnova (2017): ARSnova-Team TH Mittelhessen.
Available online at https://github.com/thm-
projects/arsnova-mobile.
Bautista, Romiro Gordo (2015): Optimizing classroom
instruction through self-paced learning prototype. In J.
Technol. Sci. Educ. 5 (3). DOI: 10.3926/jotse.162.
Chao, Cheng-Min (2019): Factors Determining the
Behavioral Intention to Use Mobile Learning: An
Application and Extension of the UTAUT Model. In
Frontiers in psychology 10, p. 1652. DOI:
10.3389/fpsyg.2019.01652.
Crowe, Sarah; Cresswell, Kathrin; Robertson, Ann; Huby,
Guro; Avery, Anthony; Sheikh, Aziz (2011): The case
study approach. In BMC medical research methodology
11, p. 100. DOI: 10.1186/1471-2288-11-100.
Csikszentmihalyi, Mihaly (1990): Flow. The psychology of
optimal experience / Mihaly Csikszentmihalyi. 1st ed.
New York: Harper & Row.
Davis, Fred D. (1989): Perceived Usefulness, Perceived
Ease of Use, and User Acceptance of Information
Technology. In MISQ 13 (3), p. 319. DOI:
10.2307/249008.
Flyvbjerg, Bent (2016): Five Misunderstandings About
Case-Study Research. In Qualitative Inquiry 12 (2),
pp. 219–245. DOI: 10.1177/1077800405284363.
Fornell, Claes; Larcker, David F. (1981): Evaluating
Structural Equation Models with Unobservable
Variables and Measurement Error. In Journal of
ICEIS 2022 - 24th International Conference on Enterprise Information Systems
338

Marketing Research 18 (1), pp. 39–50. DOI:
10.1177/002224378101800104.
Gröblinger, Ortrun; Kopp, Michael; Hoffmann, Barbara
(2016): Audience Response Systems as an Instrument
of Quality Assurance in Academic Teaching. In Luis
Gómez Chova, Agustín López Martínez, Ignacio
Candel Torres (Eds.): INTED2016 Proceedings.
International Technology, Education and Development
Conference. Valencia, Spain, 07.03.2016 - 09.03.2016:
IATED (INTED proceedings), pp. 3473–3482.
Hair, Joseph F.; Black, William C.; Babin, Barry J.;
Anderson, Rolph E.; Tatham, R. L. (2006): Multivariate
data analysis. 6th ed.: Pearson Education International.
Ibrahim, R.; Leng, N. S.; Yusoff, R. C. M.; Samy, G. N.;
Masrom, S.; Rizman, Z. I. (2018): E-learning
acceptance based on technology acceptance model
(TAM). In J. Fundam and Appl Sci. 9 (4S), p. 871. DOI:
10.4314/jfas.v9i4S.50.
Kang, Myunghee; Liew, Bao Yng Teresa; Lim, Hyunjin;
Jang, Jeeeun; Lee, Sooyoung (2015): Investigating the
Determinants of Mobile Learning Acceptance in Korea
Using UTAUT2. In Guang Chen, Vive Kumar,
Kinshuk, Ronghuai Huang, Siu Cheung Kong (Eds.):
Emerging Issues in Smart Learning. Berlin, Heidelberg:
Springer Berlin Heidelberg (Lecture Notes in
Educational Technology), pp. 209–216.
Liu, Su-Houn; Liao, Hsiu-Li; Peng, Cheng-Jun (2005):
Applying the Technology Acceptance Model and Flow
Theory to Online E-Learning Users's Acceptance
Behavior. In IIS IV (2), pp. 175–181. DOI:
10.48009/2_iis_2005_175-181.
Mahande, Ridwan Daud; Malago, Jasruddin Daud (2019):
An E-Learning Acceptance Evaluation Through
UTAUT Model in a Postgraduate Program. In Journal
of Educators Online 16 (2).
Marshman, Emily; DeVore, Seth; Singh, Chandralekha
(2020): Holistic framework to help students learn
effectively from research-validated self-paced learning
tools. In Physical Review Physics Education Research
16 (2), p. 20108.
Persada, Satria Fadil; Miraja, Bobby Ardiansyah;
Nadlifatin, Reny (2019): Understanding the Generation
Z Behavior on D-Learning: A Unified Theory of
Acceptance and Use of Technology (UTAUT)
Approach. In Int. J. Emerg. Technol. Learn. 14 (05),
p. 20. DOI: 10.3991/ijet.v14i05.9993.
Raman, Arumugam; Don, Yahya (2013): Preservice
Teachers’ Acceptance of Learning Management
Software: An Application of the UTAUT2 Model. In
IES 6 (7). DOI: 10.5539/ies.v6n7p157.
Raza, Syed A.; Qazi, Wasim; Khan, Komal Akram; Salam,
Javeria (2021): Social Isolation and Acceptance of the
Learning Management System (LMS) in the time of
COVID-19 Pandemic: An Expansion of the UTAUT
Model. In Journal of Educational Computing Research
59 (2), pp. 183–208. DOI: 10.1177/0735633120960421.
Ringle, Christian M.; Wende, Sven; Becker, Jan-Michael
(2015): SmartPLS 3. SmartPLS GmbH.
Saadé, Raafat; Bahli, Bouchaib (2005): The impact of
cognitive absorption on perceived usefulness and
perceived ease of use in on-line learning: an extension
of the technology acceptance model. In Information &
Management 42 (2), pp. 317–327. DOI:
10.1016/j.im.2003.12.013.
Salloum, Said A.; Shaalan, Khaled (2019): Factors
Affecting Students’ Acceptance of E-Learning System
in Higher Education Using UTAUT and Structural
Equation Modeling Approaches. In Aboul Ella
Hassanien, Mohamed F. Tolba, Khaled Shaalan,
Ahmad Taher Azar (Eds.): Proceedings of the
International Conference on Advanced Intelligent
Systems and Informatics 2018, vol. 845. Cham:
Springer International Publishing (Advances in
Intelligent Systems and Computing), pp. 469–480.
Tabachnick, Barbara G.; Fidell, Linda S. (2014): Using
multivariate statistics. Sixth edition, New International
Edition. Harlow, Essex: Pearson (Pearson custom
library).
Venkatesh, Viswanath; Davis, Fred D. (2000): A
Theoretical Extension of the Technology Acceptance
Model: Four Longitudinal Field Studies. In
Management Science 46 (2), pp. 186–204. DOI:
10.1287/mnsc.46.2.186.11926.
Venkatesh, Viswanath; Morris, Michael G.; Davis, Gordon
B.; Davis, Fred D. (2003): User Acceptance of
Information Technology: Toward a Unified View. In
MIS Quarterly 27 (3), pp. 425–478.
Venkatesh, Viswanath; Thong, James Y. L.; Xu Xin (2012):
Consumer Acceptance and Use of Information
Technology: Extending the Unified Theory. In MIS
Quarterly 36 (1), pp. 157–178.
Weiser, Marc; Wilson, Rick L. (1999): Using Video
Streaming on the Internet for a Graduate IT Course: A
Case Study. In Journal of Computer Information
Systems 39 (3), pp. 38–43.
Wilson, Rick L.; Weiser, Mark (2001): Adoption of
Asynchronous Learning Tools by Traditional Full-
Time Students: A Pilot Study. In Information
Technology and Management 2 (4), pp. 363–375. DOI:
10.1023/A:1011446516889.
Yang, Harrison H.; Feng, Lin; MacLeod, Jason (2019):
Understanding College Students’ Acceptance of Cloud
Classrooms in Flipped Instruction: Integrating UTAUT
and Connected Classroom Climate. In Journal of
Educational Computing Research 56 (8), pp. 1258–
1276. DOI: 10.1177/0735633117746084.
In the Flow: A Case Study on Self-paced Digital Distance Learning on Business Information Systems
339
