
A Microsimulation Modeling of Pedestrian Characteristics in
Bangkok Transit System Case Study
Jumrus Pitaksringkarn
1a
and Suhail Shaik
2b
1
Department of Civil Engineering, School of Engineering, King Mongkut’s Institute of Technology Ladkrabang,
Bangkok 10520, Thailand
2
Tranportation Engineer, S2R Consulting Company Limited, Bangkok 10250, Thailand
Keywords: Social Force Model, Walking Speed, Microsimulation, Bangkok Transit System.
Abstract: Although there are many international standards of walkway design, walking behaviors are different in each
country/region. To determine the pedestrian characteristics the concept of the social force model, which is
analogous to resolving forces in Newtonian mechanics was adopted. Behavioral data related to pedestrian
walking speed were collected by using a digital camera at BTS (Bangkok Transit System) station and
manually extracted needed factors like pedestrian speed, density and others. After completing the calibration
and validation process using a VISSIM microsimulation technique, pedestrian walking speed is analyzed on
the basis of density. The analysis shows that the walking speed of pedestrians is 75.07 m/min, which is slower
than the U.S. pedestrians. It is also found that the walking speed and the body size directly affect the pedestrian
flow rate. A similar traffic microsimulation model has also been applied to analyze the pedestrian capacity
that is calibrated by adjusting pedestrian speed. Due to the smaller body size of Asians compared to Americans,
the flow rate observed in this study is higher. In particular, the pedestrian capacities per one-meter width of
uni-direction and bi-direction are 91 peds/m/min and 78 peds/m/min, respectively.
1 INTRODUCTION
Many in Bangkok has a formula “Walk-BTS-Walk”
to avoid Bangkok’s chronic traffic jam. It is just
because of the rapid development of high-density
residential communities around BTS (Bangkok Mass
Transit System) stations and high-density shopping
malls, offices, and commercial buildings located
around that or other stations additionally BTS offers
ease accessibility to airports and bus terminals. A
survey study in Bangkok (Rastogi et al., 2003) has
found that 62 % of passengers living near transit
stations within 1 km prefer to walk. Similarly, in
Mumbai, India (Pongprasert & Kubota, 2017) found
that 85 % of passengers living near transit stations are
comfortable to walk up to the distance of 1250
meters. Evidently, walking is one of the most
economical and effective modes of transportation for
short-distance trips, at the same time, a simple fact is
that most journeys start or end with a walking trip. As
Bangkok is a rapidly developing Metropolitan city,
a
https://orcid.org/ 0000-0002-1273-7603
b
https://orcid.org/ 0000-0002-2390-1587
with increasing inward migration, there is a rise in
traffic congestion problems. It has a population of
more than 15 million people and has an increasing
tendency each year. The increase in population is
directly proportional to travel demand. And data from
the Office of Transport and Traffic Policy and
Planning in Thailand (OTP) indicates that more than
half of all travel demand are using private vehicles.
The key solution is a sustainable transportation
system that focuses on safety, eco-friendliness, and
dependency reduction on limited resources. For
example, a walking system will reduce the usage of
private vehicle/motorcycle transportation. Therefore,
proper and standardized walkway design system is
necessary.
When it becomes necessary to provide, making
decision on selecting an inappropriate concept can be
costly to rectify. For example, to design a pedestrian
facility, foreign criterion was adopted in Chinese
metro stations without any further studies to
understand the difference between Chinese and
Pitaksringkarn, J. and Shaik, S.
A Microsimulation Modeling of Pedestrian Characteristics in Bangkok Transit System Case Study.
DOI: 10.5220/0011067300003191
In Proceedings of the 8th International Conference on Vehicle Technology and Intelligent Transport Systems (VEHITS 2022), pages 353-359
ISBN: 978-989-758-573-9; ISSN: 2184-495X
Copyright
c
2022 by SCITEPRESS – Science and Technology Publications, Lda. All rights reserved
353
Westerners. This leads to a peerless connection
between demand and capacity of pedestrians during
rush hours in some Shanghai, China, metro stations.
Such that designing effective and appropriate walking
facilities that suit local pedestrian characteristics
considered as a challenge by dense and regular
passenger traffic. For example, a typical illustration is
metro transfer stations. So consciously, to sidestep the
issue, in-depth study of local pedestrian flow
characteristics is compulsory (Ye et al., 2008).
Application of Western standards for pedestrian
facility design in Asian countries is not always
effective way to design and, in some cases,
inappropriate, as every location is bound by its own
unique set of environmental and physical constraints.
As the study conducted by (Y Tanaboriboon, Record,
& 1991) summarizes, in designing of pedestrian
facilities walking speed parameter is of utmost
importance. Therefore, more attention should be
given to pedestrian facilities by doing studies on
pedestrian flow characteristics and walking behavior
to find the optimal design for pedestrian spaces.
Hence, this study will explore the walking speed in
Thailand by using the case study of BTS Sky Walk
Bangna – BITEC. The traffic microsimulation model
has been applied to analyze the pedestrian
characteristics which are calibrated through adjusted
pedestrian speed.
2 LITERATURE REVIEW
2.1 Pedestrian Walking Speed
The findings of the various studies show that Asian
pedestrians walk slower compared to Western
pedestrians as shown in Table 1. (Y Tanaboriboon &
Guyano, 1991) conducted a study in Thailand and
obtained a mean walking speed of 73 m/min, which
is relatively comparable to the 74 m/min walking
speed of Singaporean pedestrians (Yordphol
Tanaboriboon et al., 1986) but significantly slower
than the 81 m/min speed of the U.S. pedestrians
(Fruin, 1971).
In the United States, study conducted by (Navin
& Wheeler, 1969) in the University of Missouri,
Columbia found students were walking at an average
speed of 79 m/min. Similar study conducted in the
United States by (Gupta, 1986) and yielded a result of
slightly higher mean walking speed of 88 m/min.
In Asia, (Gupta, 1986) conducted a study in Delhi
and found a mean pedestrian walking speed of 72
m/min. (Yu, 1993) found a mean pedestrian walking
speed of 73 m/min in China. (Gerilla et al., 1995)
found a mean pedestrian walking speed of 70.6 m/min
in the Philippines.
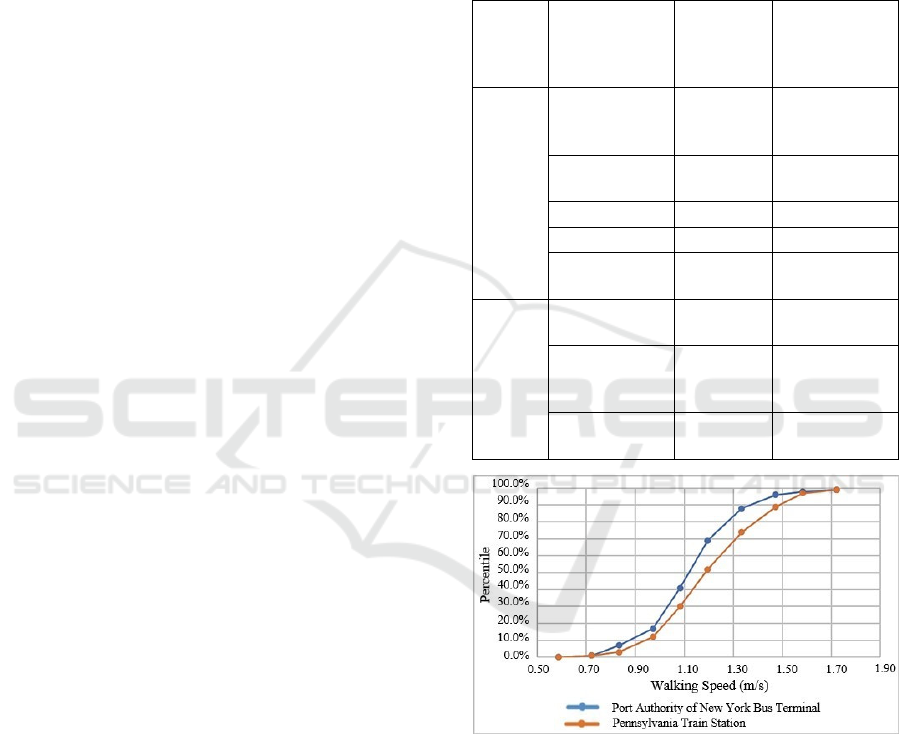
In addition, (Fruin, 1971) also studied the
distribution of free-flow pedestrian walking speeds at
Port Authority of New York bus terminal and
Pennsylvania Train Station. The results are shown in
Figure 1.
Table 1: Mean walking speeds in various studies.
Region City, Country
Mean
Walking
Speed
(m/min)
Author
Asian
Bangkok,
Thailand
73.0
Tanaboriboon
and Guyano
(1991)
Singapore 74.0
Tanaboriboon
et al. (1986)
Delhi, India 72.0 Gupta (1986)
China 73.0 Yu (1993)
Metro Manila,
Philippines
70.6 Gerilla (1995)
Western
New York,
United States
81.0 Fruin (1971)
Columbia,
United States
79.0
Navin and
Wheeler
(1969)
Pittsburgh,
United States
88.0 Hoel (1968)
Figure 1: Speed distribution according to (Fruin, 1971).
2.2 Human Ellipse of Pedestrians
Human Ellipse (Body Ellipse) has a significant
impact on pedestrian characteristics. According to (Y
Tanaboriboon et al., 1991) study, Thai pedestrians
walk slower than Western pedestrians, but Thai
pedestrian capacity per 1-meter width is greater.
While designing a pedestrian facility, current
practices adopt pedestrian space requirements
mentioned in US-Highway Capacity Manual (HCM-
VEHITS 2022 - 8th International Conference on Vehicle Technology and Intelligent Transport Systems
354
2010), which serves as the standard for developing a
level of service criteria for a pedestrian facility
design.
Dimensions of a pedestrian are bound to be
different, when two different regions are compared.
As per the study conducted by (Singh et al., 2016)
concluded that compared to Western people Asians
are generally shorter with relatively less broader
shoulders as shown in Figure 2.
Singh, N., (Singh et al., 2016) studied Asian
people and found Asian ellipse dimensions to be
0.3476m × 0.5082m (Body Depth × Shoulder Width)
while the dimension provided by USHCM 2010 is
0.4572m × 0.6096m (Body Depth × Shoulder Width).
Therefore, it was concluded that Asians have 23.97%
relatively less body height and their shoulder are
16.63% less when compared to the Americans.
Figure 2: The study of Asian Ellipse dimensions (Singh et
al., 2016).
Table 2: Average dimensions of pedestrians for different
countries (Dynamics Ltd., 2005).
Population
M = Male; F
= Female
Width
(cm)
Depth
(cm)
Area in
Rectangle
(m
2
)
Area in
Ellipse
(m
2
)
France M 51.50 28.00 0.14 0.11
F 47.00 29.50 0.14 0.11
USA
M 51.50 29.00 0.15 0.12
F 44.00 30.00 0.13 0.10
Great
Britain
M 51.00 32.50 0.17 0.13
F 43.50 30.50 0.13 0.10
India M 45.50 23.50 0.11 0.09
F 39.00 25.50 0.10 0.08
Japan M 41.00 28.50 0.12 0.09
F 42.50 23.50 0.10 0.08
Hong
Kong
M 47.00 23.50 0.11 0.09
F 43.50 27.00 0.12 0.09
3 METHODOLOGY
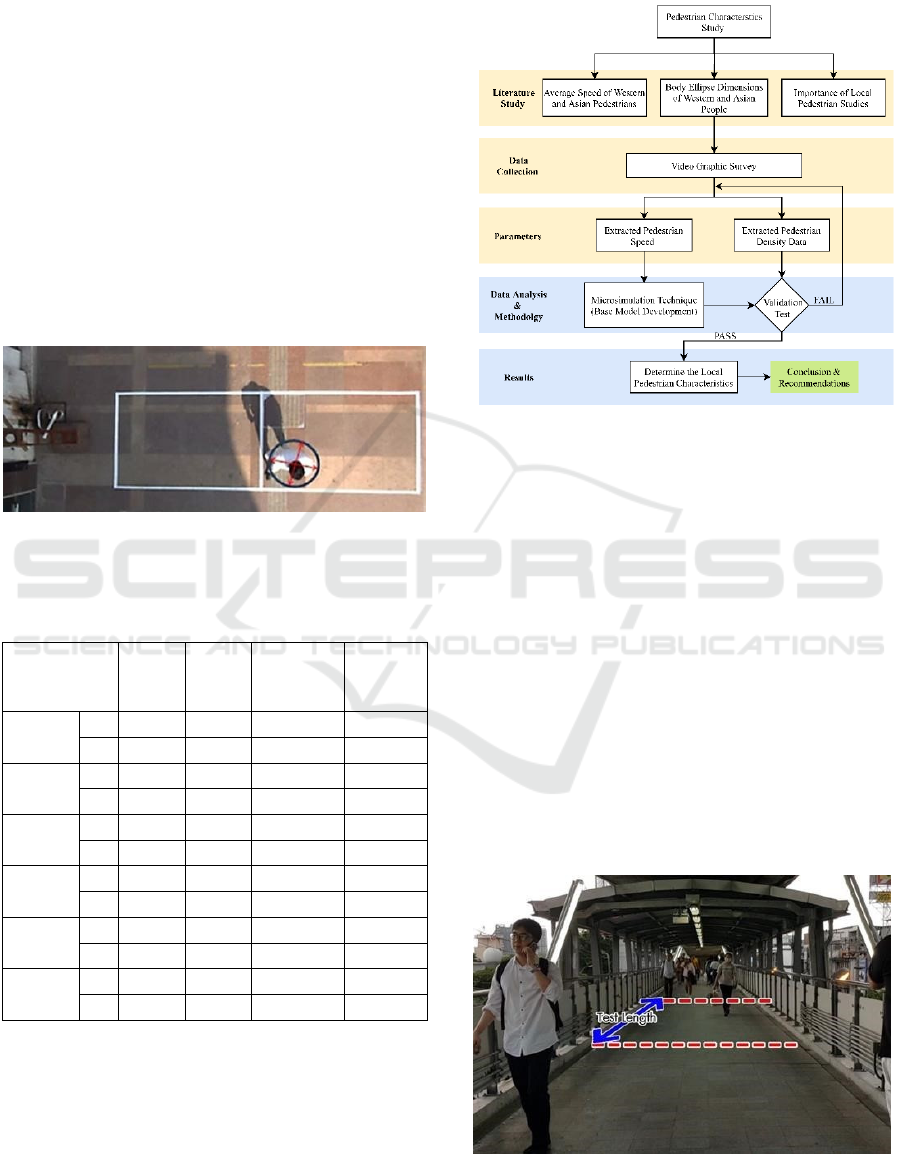
Figure 3 shows the framework employed for this
study to estimate pedestrian characteristics, also
shows intermediate steps of data collection methods,
analysis, and an overview of validating the developed
model.
Figure 3: Research framework.
3.1 Data Collection
This study was conducted in Bangkok, Thailand. As
this study required an area with higher pedestrian
density to perform speed studies, so, BTS Sky Walk
Bangna – BITEC as shown in Figure 4, was selected.
Pedestrians were timed manually over a measured
length, and then their respective speeds were
calculated. A portable video camera was used to
collect all the data on pedestrian traffic. The camera
was placed in a fixed position to obtain a view that
encompassed all the selected study area. The surveys
were conducted for 7 hours during peak and off-peak
periods. Speed data for calibrating models and
density data for validating model has been collected.
In addition, the processed results of the walking speed
are shown in Figure 5.
Figure 4: Site location.
A Microsimulation Modeling of Pedestrian Characteristics in Bangkok Transit System Case Study
355
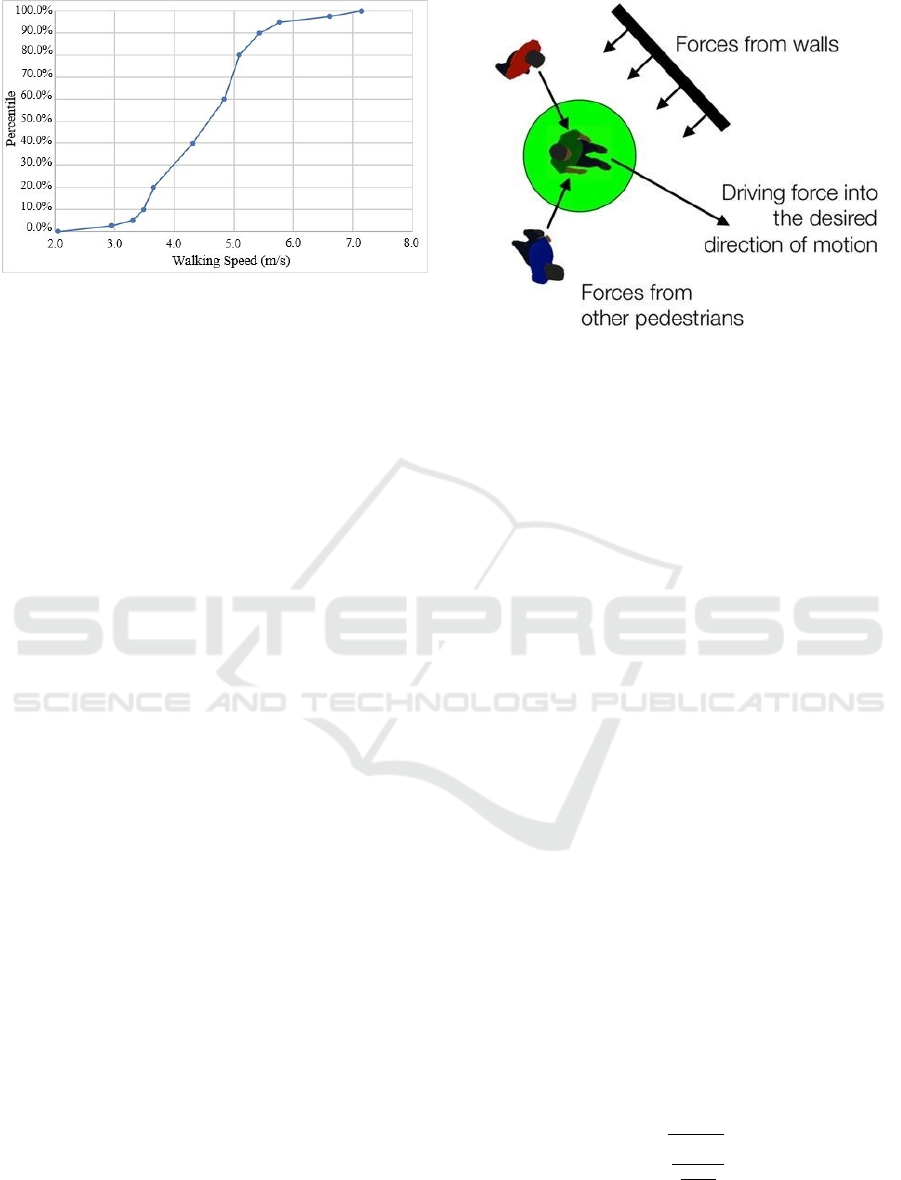
Figure 5: Results of walking speed (m/s=meter/second).
3.2 Pedestrian Simulation
This study used the traffic microsimulation modeling
software for pedestrians, PTV Viswalk, to analyze the
pedestrian capacity with Social Force Model theory
(Helbing & Molnár, 1995).
Fundamental notion of Social Force Model is to
model the elementary forces that influence motion of
pedestrians (as shown in Figure 6), this modelling is
analogous to how Newtonian mechanics is used to
resolve forces acting on a physical object. Total force
evaluated comprises of social, psychological, and
physical forces, which eventually results in an
entirely physical parameter acceleration of
pedestrian.
The forces discussed above come into play due to
the desire of pedestrians to reach a destination and
these forces are the results of the influence of various
factors such as obstacles, walls, other pedestrians etc.,
(PTV VISION, 2016). In the same way, pedestrian
behavior can be categorized into three different levels
as in (Hoogendoorn & Bovy, 2002):
At strategic level of minutes to hours, a
pedestrian plans his or her route and generates a
list of stops/destinations.
At tactical level of seconds to minutes, a
pedestrian chooses the route between the
destinations. Thereby he takes the network into
account.
At operational level of milliseconds to seconds,
the pedestrian performs the actual movement to
avoid oncoming pedestrians, navigates through
a dense crowd, or simply continues the
movement toward his/her destination.
The Social Force Model encompasses both
operational and tactical levels of pedestrian behavior.
Therefore, this study discusses the aspects of the
strategic level of pedestrian behavior using factors
such as pedestrian volume and pedestrian speed.
Figure 6: Social Force Model (Helbing and Molnár, 1995).
Among all the other microscopic pedestrian
model SFM has the ability to model all the
interactions and tends to be more realistic when
reproducing the pedestrian walking environments
(Helbing et al., 2005). Also, SFM has been
considered by a majority of researchers (Teknomo,
2016) -(Helbing et al., 2006) - (W & A, 2007) -
(Lakoba et al., 2016) the reason being, social force
model accurately captures most of the phenomenon
resulting due to complex interactions between
pedestrians compared to other similar models.
4 DATA ANALYSIS AND
RESULTS
4.1 Calibration and Validation Process
The models were calibrated by adjusting two
parameters. First is the desired walking speed
collected from the site (shown in Figure 7), second is
the Asian body ellipse (shown in Figure 8). In order
to obtain a realistic pedestrian behavior, simulation
run was visually validated and necessary adjustments
were made accordingly, as shown and discussed in
Figure 3.
For the output to be considered satisfactory the
statistical GEH (Geoffrey E. Havers) equation value
of output was constrained to a value of GEH < 5.0 for
85 % of all modeled volumes. Further, the summary
of the validation process results is shown in Table 3.
=
()
()
(1)
Where E is the estimated traffic volume from the
simulation model, V is the observed traffic volume.
VEHITS 2022 - 8th International Conference on Vehicle Technology and Intelligent Transport Systems
356
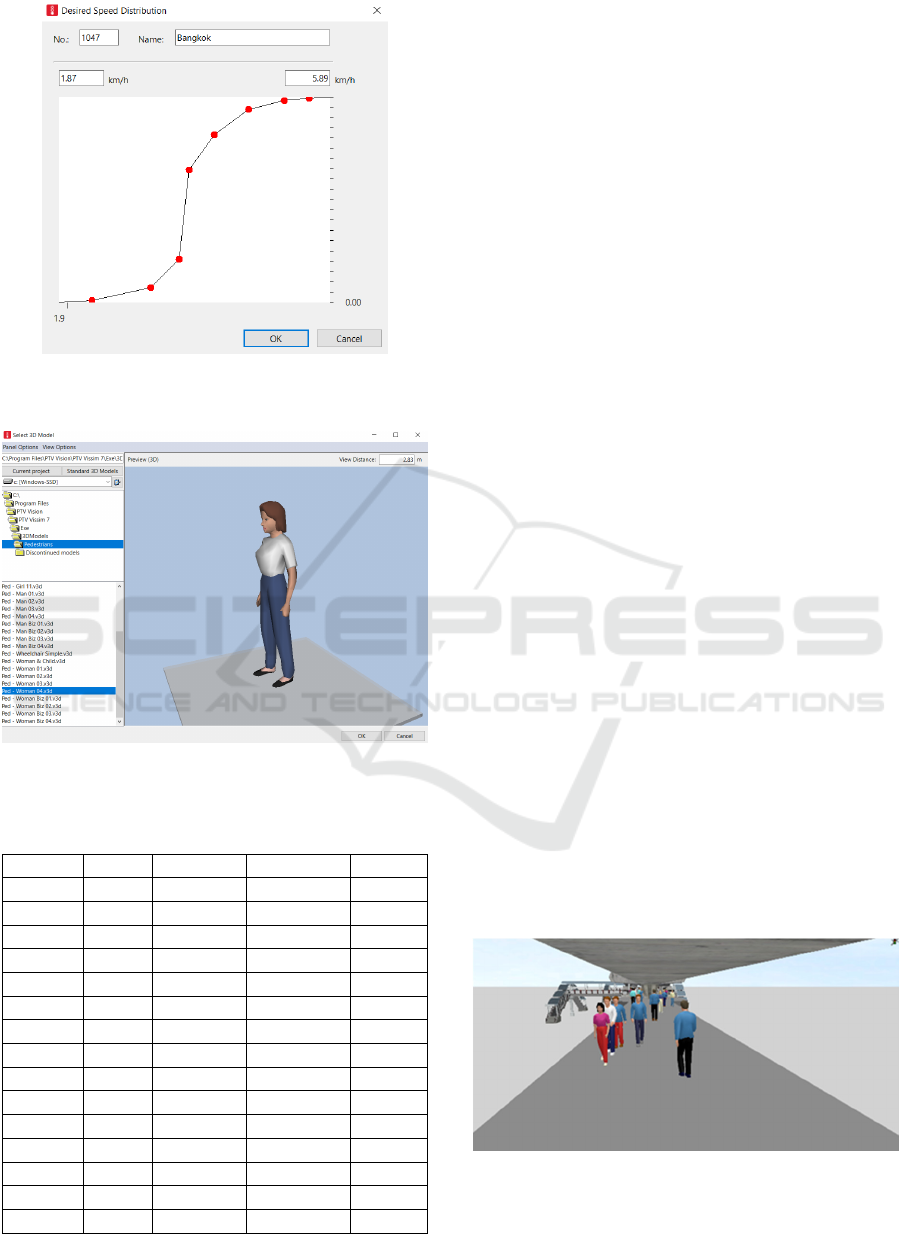
Figure 7: Calibration of walking speed in the traffic
microsimulation model.
Figure 8: Calibration of Asian body ellipse in the traffic
microsimulation model.
Table 3: Result of the Validation Process.
From TO Observed Simulation GEH
11:00 11:30 1,262 1,238 0.6788
11:30 12:00 1,184 1,170 0.4081
12:00 12:30 1,432 1,440 0.2111
12:30 13:00 1,231 1,215 0.4575
13:00 13:30 1,681 1,717 0.8734
13:30 14:00 1,701 1,723 0.5317
14:00 14:30 1,750 1,739 0.2634
14:30 15:00 896 908 0.3996
15:00 15:30 1,326 1,324 0.0549
15:30 16:00 1,291 1,289 0.0557
16:00 16:30 1,413 1,440 0.7149
16:30 17:00 2,313 2,320 0.1454
17:00 17:30 1,834 1,851 0.3960
17:30 18:00 1,672 1,702 0.7304
18:00 18:30 1,555 1,556 0.0254
4.2 Simulation Results and Pedestrian
Flow Characteristics
After the model calibration, the analysis of pedestrian
flow rates at various pedestrian densities were
analyzed. For the analysis to provide greater
resolution, pedestrian volumes from 1,000
pedestrians/hr to 30,000 pedestrians/hr with an
increment of 1,000 pedestrians/hr were used.
It is noticed that the average pedestrian walking
speed is evidently higher in U.S when compared to
Asian walking speeds, which results in higher
average flow rates. However, when pedestrian
volumes near the walkway capacity as shown in
Figure 10 and Figure 11 in terms of pedestrian
density, the body size factor gains more importance.
Hence, resulting in the maximum Thai Pedestrian
flow rate being greater than U.S flow rates when
nearing critical volumes.
Under the free flow conditions as shown in Figure
9, it is evident that a pedestrian is relatively free to
decide on his/her walking speeds due to less
obstructive forces, this scenario was also observed in
simulation trials and it further validates the approach
of modeling pedestrian behavior using social force
model.
But when the pedestrian volume approaches the
capacity, the flow rate of this study is relatively
higher than US due to the smaller body size of Asians
on average. In addition, when comparing between
uni-directional and bi-directional walking, it is found
that the capacities of the flow rate are different. The
pedestrian flow rates of uni-directional and bi-
directional walking are 91 peds/m/min and 78
peds/m/min, respectively. Figure 12 compares the
variation observed between uni-directional and bi-
directional pedestrian flows vs area module observed
in this study and past studies, which indicates the
model proposed in this study have the potential to be
used to model the pedestrian behavior accurately.
Figure 9: PTV VISSIM 3D Animation (Low Density).
A Microsimulation Modeling of Pedestrian Characteristics in Bangkok Transit System Case Study
357
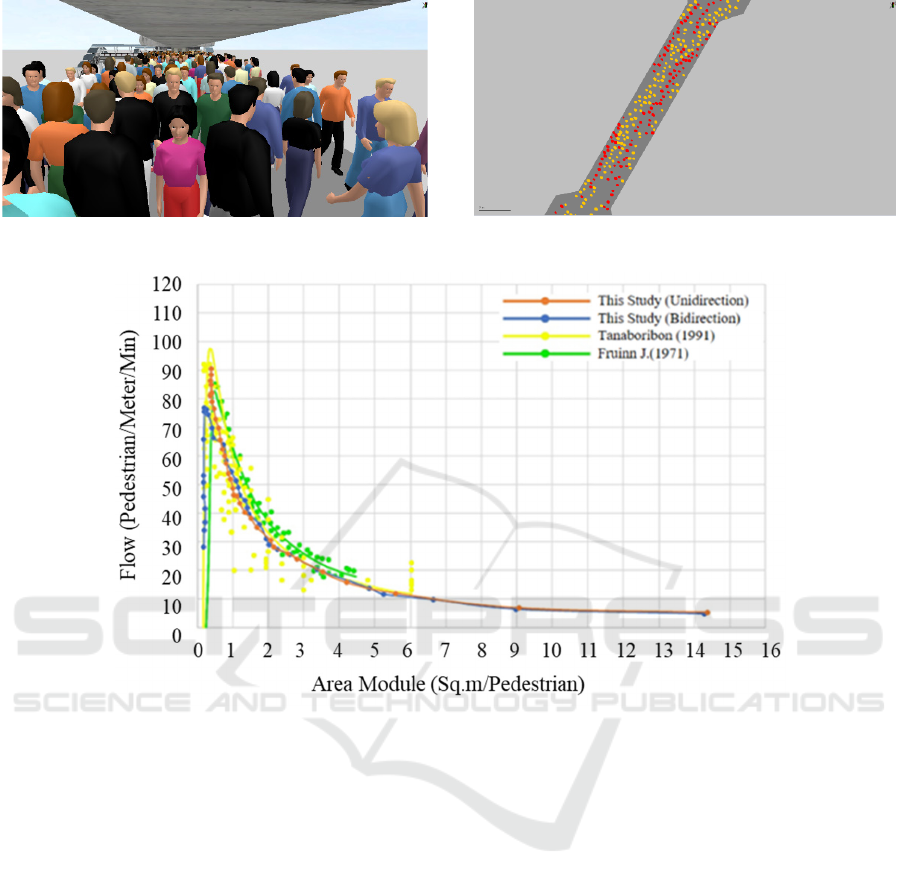
Figure 10: PTV VISSIM 3D Animation (High Density).
Figure 11: PTV VISSIM 2D Animation (High Density).
Figure 12: Pedestrian flow area module relationship.
5 CONCLUSION
The methodology of this study proves to be robust
enough to model the pedestrian behaviors accurately,
and the validation technique employed provides a
measure to compare and validate the observed and
simulated pedestrian volumes of the skywalk in
Bangkok. The results of this case study demonstrates
that Thai pedestrian walking speed is 75.07 m/min,
which is higher than 73.0 m/min of the previous
walking speed study results conducted in Bangkok in
1991 but still slower than U.S. pedestrian walking
speed.
The pedestrian flow per one-meter width of uni-
direction and bi-direction is 91 peds/m/min and 78
peds/m/min, respectively. It is also clearly indicated
that a uni-directional walkway would provide a
higher pedestrian flow rate than a bi-directional
walkway.
In addition, the maximum Thai pedestrian flow
rate obtained in this study is greater than the one
obtained in the U.S. It could indicate that the Thai
pedestrian body size is smaller than the U.S.
Therefore, this study concludes that walking speed
and body size significantly affect the pedestrian flow
rate. Most importantly, the methodology and results
of this study would provide useful information for
better planning and robust design of pedestrian
facilities in Bangkok. Similarly, the other cities with
similar pedestrian flow characteristics could also
adopt this methodology where walkways reach their
capacities and the importance of body sizes comes
into the foreground.
For future research, in addition to factors
considered in this study, it would be essential to
consider socio-economic factors like age, gender,
occupation, etc. Also, a comparison of different types
of pedestrian locations at midblock crosswalks,
signalized and unsignalized crosswalks, and
sidewalks would also be a great prospect for studying
VEHITS 2022 - 8th International Conference on Vehicle Technology and Intelligent Transport Systems
358

the pedestrian flow characteristics and behaviors
using the proposed methodology.
ACKNOWLEDGMENTS
The corresponding author wishes to express his
thanks to the Department of Civil Engineering,
School of Engineering, King Mongkut’s Institute of
Technology Ladkrabang for allowing him to conduct
this research. The authors would also like to thank
S2R Consulting Co. Ltd., and Mr. Satapana
Nammuang whose comments and suggestions helped
to improve this paper.
REFERENCES
Dynamics Ltd. (2005). Graphic - Levels of Service.
www.crowddynamics.com
Fruin, J. J. (1971). Pedestrian planning and design.
Gerilla, G. P., Hokao, K., & Takeyama, Y. (1995).
Proposed level of service standards for walkways in
Metro Manila. Journal of the Eastern Asia Society for
Transportation Studies, 1(3), 1041–1060.
Gupta, R. . (1986). Delhi 2010 AD: Cycle - An important
mode even after the 20th century. Int. Conf. on
Transportation System Studies, 625–632.
Helbing, D., Buzna, L., Johansson, A., & Werner, T.
(2005). Self-organized pedestrian crowd dynamics:
Experiments, simulations, and design solutions.
Transportation Science, 39(1), 1–24.
Helbing, D., Johansson, A., Mathiesen, J., Jensen, M. H., &
Hansen, A. (2006). Analytical Approach to Continuous
and Intermittent Bottleneck Flows. Physical Review
Letters, 97(16).
Helbing, D., & Molnár, P. (1995). Social force model for
pedestrian dynamics. Physical Review E, 51(5), 4282.
Hoogendoorn, S. P., & Bovy, P. H. L. (2002). Normative
Pedestrian Behaviour Theory and Modelling.
Transportation and Traffic Theory in the 21 St Century,
219–245.
Lakoba, T. I., Kaup, D. J., & Finkelstein, N. M. (2016).
Modifications of the Helbing-Molnár-Farkas-Vicsek
Social Force Model for Pedestrian Evolution, 81(5),
339–352.
Navin, F. P., & Wheeler, R. J. (1969). Pedestrian Flow
Characteristics. Traffic Engineering, Inst Traffic Engr,
39.
Pongprasert, P., & Kubota, H. (2017). Switching from
motorcycle taxi to walking: A case study of transit
station access in Bangkok, Thailand. IATSS Research,
41(4), 182–190.
Rastogi, R., Engineering, K. K. R.-J. of T., & 2003,
undefined. (2003). Travel characteristics of commuters
accessing transit: Case study. Ascelibrary.Org, 129(6),
684–694.
Singh, N., Parida, P., Advani, M., & Gujar, R. (2016).
Human Ellipse of Indian Pedestrians. Transportation
Research Procedia, 15, 150–160.
Tanaboriboon, Y, & Guyano, J. (1991). Analysis of
pedestrian movements in Bangkok.
Tanaboriboon, Yordphol, Hwa, S. S., & Chor, C. H. (1986).
Pedestrian characteristics study in Singapore. Journal of
Transportation Engineering, 112(3), 229–235.
https://doi.org/10.1061/(ASCE)0733-947X(1986)112:
3(229)
Teknomo, K. (2016). Microscopic Pedestrian Flow
Characteristics: Development of an Image Processing
Data Collection and Simulation Model.
https://arxiv.org/abs/1610.00029v1
W, Y., & A, J. (2007). Modeling crowd turbulence by
many-particle simulations. Physical Review. E,
Statistical, Nonlinear, and Soft Matter Physics, 76(4 Pt
2).
Ye, J. H., Chen, X., Yang, C., & Wu, J. (2008). Walking
Behavior and Pedestrian Flow Characteristics for
Different Types of Walking Facilities. Transportation
Research Record, 2048, 43–51.
Yu, M. F. (1993). Level of service design standards for non-
motorized transport in Shanghai, China. Asian Institute
of Technology, Bangkok.
A Microsimulation Modeling of Pedestrian Characteristics in Bangkok Transit System Case Study
359
