
Multi-Sensor 3D Modeling of Natural Heritage:
Example of the Lake Zmajevo Oko
Lovre Panđa
a
, Ante Šiljeg
b
and Ivan Marić
c
University of Zadar, Department of Geography, Trg kneza Višeslava 9, Zadar, Croatia
Keywords: Zmajevo Oko, Geospatial Technologies, UAV, WASSP S3, MBES, Virtual Walk.
Abstract: In recent decades geospatial technologies (GST) have been affected by a process of rapid development. One
of their applications involves the documentation of the protected areas reference state and the development of
high-quality models for their preservation and management. The research area of this paper is Lake Zmajevo
oko (Lake Dragon eye), near Rogoznica (Croatia). The research goals were to create a multisensor model of
the lake and present the application of these technologies for promotional purposes. The secondary objective
was to obtain morphometric data about the lake. The research methodology included performing the process
of UAV photogrammetry and bathymetry. In UAV photogrammetry, a Phantom 4 Pro was used. In the
bathymetric survey, an integrated system composed of WASSP S3 multibeam depth sounder (MBES) and the
Hemisphere V320 GNSS smart antenna was used. The data collected by both methods were combined and an
multisensor high-quality model of the lake was created. Ten underwater tunnels on the steep sides of the lake
were detected. From the derived models, the volume and surface area of the lake, as well as the length of the
lake shoreline were calculated. Furthermore, a virtual walk around the lake was made to promote this area. A
physical model of the lake, which can serve as a souvenir, was printed with the 3D printer Prusa i3 MK3. The
collected high-quality data can serve as the basis for future research, while derived models and a virtual walk
can be used for its promotion.
1 INTRODUCTION
The rapid development of geospatial technologies
(GST) in the last twenty years (Bodzin and Cirucci,
2009; Bishop et al., 2012; Šiljeg et al., 2018), enabled
the modeling of complex processes and objects in
different levels of detail (LoD), depending on the
purpose of the research (Kyriakaki et al., 2014). To
improve its quality, multisensor models are
developed. These models are made from data
collected by different methods and techniques (Fabris
et al., 2010; Abdalla, 2016, Erenoglu et al., 2017)
using different sensors (Hackett and Shah, 1990). In
the process of generating multisensor models, data
obtained by UAV photogrammetry and bathymetry
are often being combined (Fabris et al. 2010; Šiljeg et
al 2022). Great advances and the increasing
availability of modern technology have enabled 3D-
4D-5D documentation, conservation and, digital
a
https://orcid.org/0000-0003-4549-4481
b
https://orcid.org/0000-0001-6332-174X
c
https://orcid.org/0000-0002-9723-6778
promotion of protected areas and facilities
(Remondino and Rizzi, 2010; Ficarra, 2011,
Kyriakaki et al., 2014). 3D documentation involves
collecting, processing, reproduction, and presentation
of geospatial data by determining the position, shape,
and dimensions of an object or area in three-
dimensional space to preserve the current state (Marić
et al., 2019) of cultural (Manić et al., 2013) or natural
heritage (Leonov et al., 2011; Bishop et al., 2012).
UNESCO (1972) uses the term “natural heritage” for
physical, biological, and geological features,
formations, and sites of exceptional value from an
aesthetic or scientific point of view (Boehler et al.,
2001). The study of natural heritage largely depends
on conservation because global climate change,
natural disasters, mass tourism, terrorism, and human
negligence greatly affect changes in the landscape,
and thus on the protected areas (Marić et al., 2019).
Furthermore, the rapid development of virtual reality
138
Pan
¯
da, L., Šiljeg, A. and Mari
´
c, I.
Multi-Sensor 3D Modeling of Natural Heritage: Example of the Lake Zmajevo Oko.
DOI: 10.5220/0011065300003185
In Proceedings of the 8th International Conference on Geographical Information Systems Theory, Applications and Management (GISTAM 2022), pages 138-146
ISBN: 978-989-758-571-5; ISSN: 2184-500X
Copyright
c
2022 by SCITEPRESS – Science and Technology Publications, Lda. All rights reserved
technology (VR) offers the possibility of using GSTs
for tourism purposes (Bruno et al., 2010; Leonov et
al., 2011; Tussyadiah et al., 2018). Also, the use of
3D printers enables the production of attractive
souvenirs. Therefore, the promotion of protected
natural areas, using modern GSTs is necessary if
decision-makers and administration want to keep up
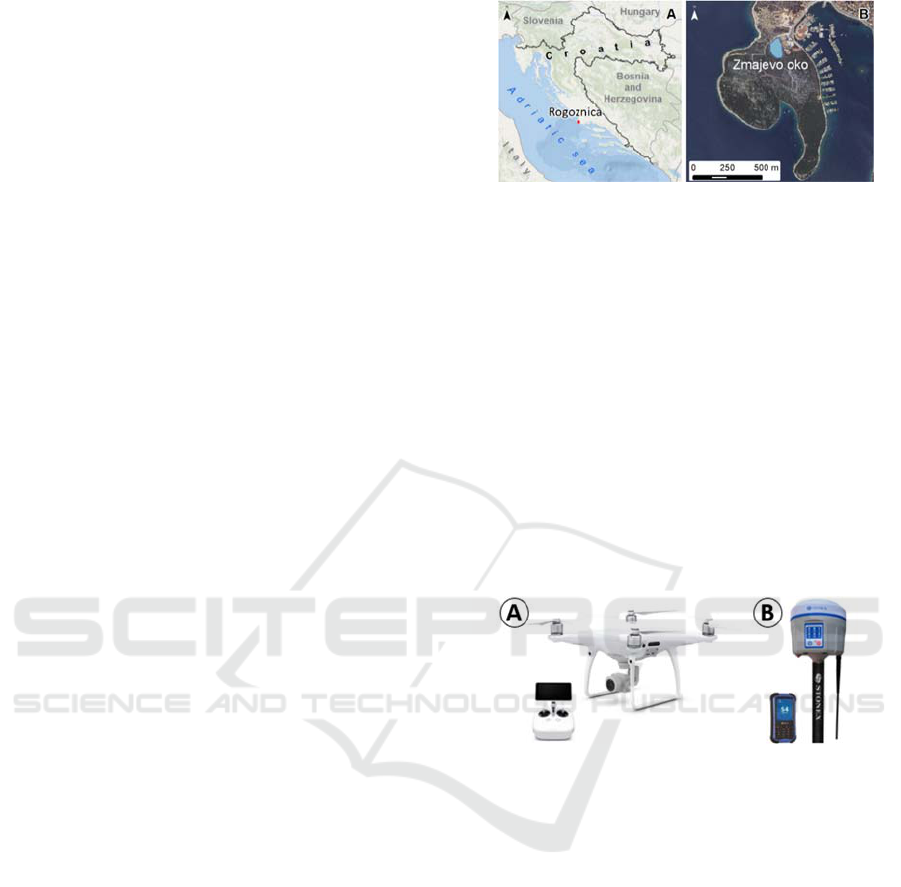
with the modern requirements of tourism. The object
of this research was Lake Zmajevo oko near
Rogoznica (Figure 1). It was recorded using UAV
photogrammetry and multibeam echosounder
(MBES). The research goals were to create an m
model of the lake and present the application of these
technologies for promotional purposes. Also, the
secondary objective was to obtain morphometric data
about the lake (surface area, volume, depth, and
shoreline length).
2 STUDY AREA
The bathymetric survey covered the area of Lake
Zmajevo oko (Figure 1), while the UAV
photogrammetric survey covered the wider coastal
area. The area is characterized by a large terrain
roughness. It is located on the Gradina peninsula,
which is connected to the mainland by a thin isthmus
and surrounded by the bays of Soline and Koprišće.
The lake is connected to the sea by underground
tunnels. This is indicated by the salinity of the water,
the presence of the mediolateral staircase, and the
change of tides (Bakran-Petricioli et al., 1998).
Physicochemical properties are specific. The lake is
characterized by sudden changes in temperature,
salinity, and density caused by poor water mixing,
geomorphological features, and meteorological
conditions. The lake is naturally sheltered from the
wind since it is located in a valley. This is one of the
main reasons for the constant chemical stratification
(Ciglenečki et al., 1996; Bakran-Petricioli et al.,
1998; Bura-Nakić et al., 2012). The bottom layer is
characterized by a thick layer of hydrogen sulfide
which makes the water cloudy and white. Anoxia is
also present (Bakran-Petricioli et al., 1998; Bura-
Nakić et al., 2007; Bura-Nakić et al., 2012).
3 MATERIALS AND METHODS
UAV photogrammetry was used for the recording of
the water body and the wider coastal area in order to
obtain data about the surface area and the shoreline
length as well as to develop high-resolution models
Figure 1: Geographical position of the Lake Zmajevo oko.
for visualization. An MBES survey was performed to
obtain data on the depth and volume of the lake as
well as to detect and map underwater tunnels.
3.1 UAV Photogrammetric Survey
A UAV photogrammetric survey of Lake Zmajevo
oko was performed on July 19, 2019. The Phantom 4
Pro (Figure 2A) was used for imagery acquisition
while RTK-GPS Stonex S10 (Figure 2B) was used to
measure ground control (GCP) and check points
(CP). The detailed specifications of the used UAV are
available (URL1) and GNSS receiver at (URL2). The
Stonex S10 was also used to monitor the water level
during data acquisition.
Figure 2: Phantom 4 Pro and Stonex S10.
A UAV photogrammetric data acquisition and
processing were performed in several steps. The first
was to mark and collect GCPs and CPs. A total of 9
points (6 GCPs and 3 CPs) were marked and collected
(Figure 3). On the east side of the lake, it was not
possible to collect any points because the area was
fenced (private property).
The second step was the development of an
optimal survey plan. That included the selection of
mission types concerning the morphology of the
terrain and the distribution of points. Multiple double
grid missions were performed at flight altitudes of 70
m with a camera angle of 90°. Also, one circular and
one free flight mission was conducted to collect
oblique images of the steep coastal parts of the lake.
The front and side overlap was set to 80%. Before
data acquisition, the vision positioning system,
inertial measurement unit (IMU), and compass were
calibrated. An image processing was performed in
Multi-Sensor 3D Modeling of Natural Heritage: Example of the Lake Zmajevo Oko
139
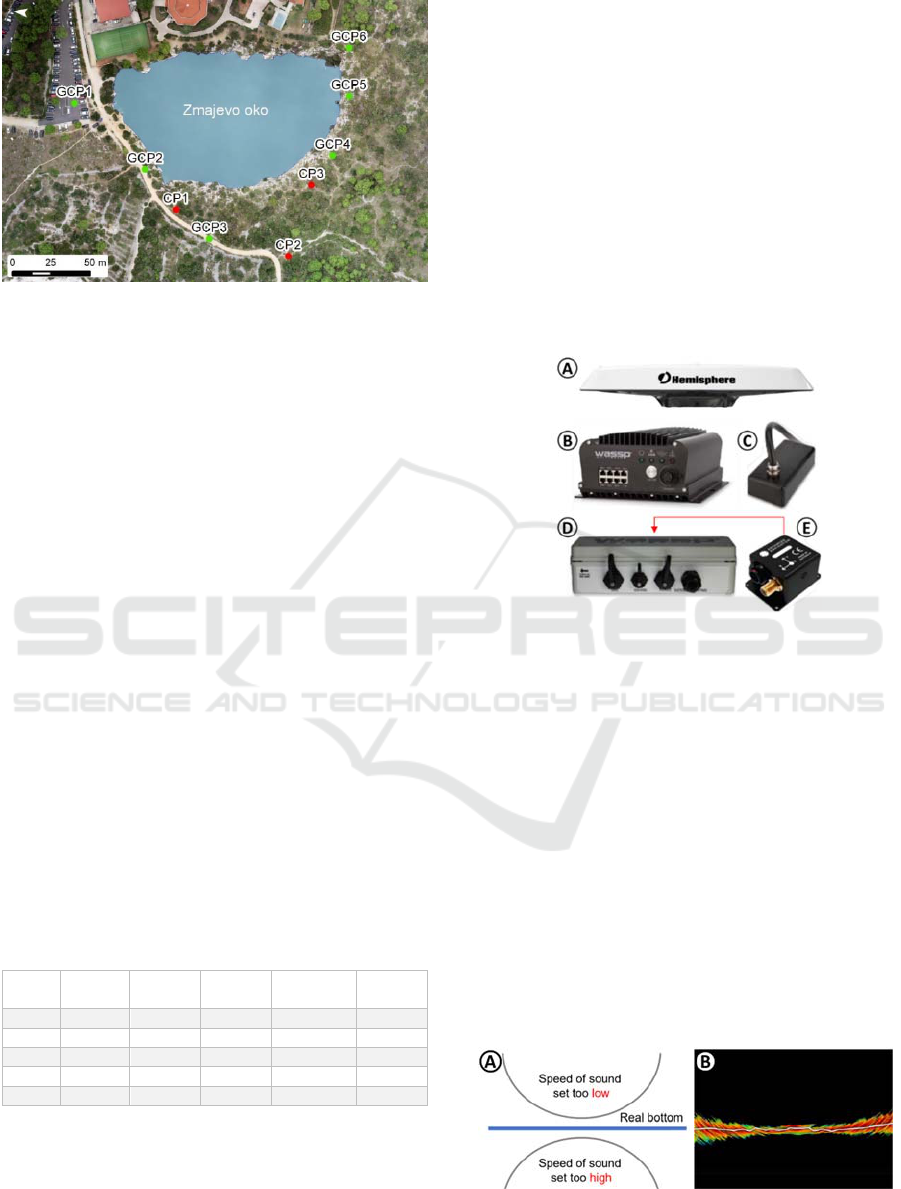
Figure 3: Spatial distribution of GCPs and CPs.
Agisoft Metashape Professional 1.5.1. The image
workflow process consisted of several steps as in
Marić et al. (2019). The camera calibration was done
automatically whilst aligning photos in Metashape.
The image alignment, the building of the dense cloud,
and the mesh were set to medium quality. After
positioning the GCPs and CPs, the accuracy of the
derived models were calculated mean absolute error
(MAE) and root mean square error (RMSE).
The values of MAE and RMSE in CPs are stated in
(Table 1). The MAE for the X-axis was 1.48, for the
Y-axis 3.26, and for the Z-axis 1.16 cm. The total MAE
of the CPs was 3.99 cm. The MAE in the image
coordinate system was 0.18 pixels. The RMSE for the
X-axis was 1.72, for the Y-axis 3.48, and for the Z-axis
1.36 cm. The total RMSE of the CPs was 4.13 cm. The
RMSE in the image coordinate system was 0.20 pixels.
The MAE and RMSE correspond to the values
achieved in similar studies and papers (Agüera-Vega et
al., 2017; Marić et al., 2019; Rogers et al., 2020). We
are aware that only three CPs are not enough to assess
the accuracy of the model, but due to the large terrain
roughness, very dense vegetation, and private property
on the east side, there were not many available places
where more points could be marked.
Table 1: The accuracy of CPs.
Label X error
(cm)
Y error
(cm)
Z error
(cm)
Total
error (cm)
Image
(pix)
CP1 2.45 -2.63 -1.73 3.99 0.30
CP2 1.67 -2.18 -0.15 2.75 0.16
CP3 -0.32 -4.96 1.59 5.22 0.08
MAE 1.48 3.26 1.16 3.99 0.18
RMSE 1.72 3.48 1.36 4.13 0.20
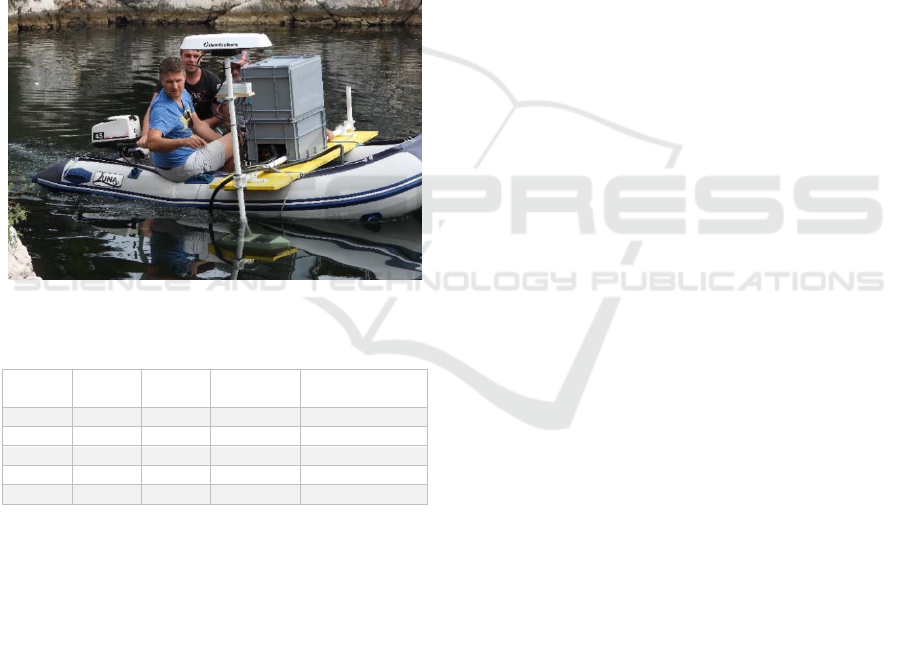
3.2 MBES Survey
The first step of the MBES survey was to obtain
secondary data that were necessary for optimal
bathymetric survey planning. The reference mean
water level was determined using geodetic
measurement (GNSS-RTK receiver Stonex S10). The
reference mean water level was recognized as the
point marked by wet conditions, a difference in color,
and algae formed on the steep side of the lake. The
MBES survey was performed with an integrated
measurement system (Figure 4) which included eight
main components: (a) WASSP S3 Multibeam
Wideband Sounder c/w DRX (Figure 4B); (b) WASSP
Sensor Box (Figure 4D) with integrated Spatial IMU
(Figure 4E); (c) Hemisphere V320 GNSS Smart
Antenna (Figure 4A); (d) WMB-160 probe (Figure
4C); (e) battery and power cord; (f) configuration
computer and cable; (g) configuration software; (h)
Data Management and Exporting Software (CDX).
Figure 4: Integrated measuring system components.
All components were connected and configured
according to the manufacturer's instructions and
international standards concerning the characteristics
of the boat. In addition to the above system
configuration, it was important to calibrate the probe
during the measurement and to calculate the optimal
speed of sound in water based on the output results of
the temperature and salinity of the water. The visual
effect of incorrect speed of sound is manifested by the
concave or convex curvature of the flat seabed (Dong
et al., 2007; Dong et al., 2011) (Figure 5A).
Therefore, the device was calibrated on the flattened
part of the lake to minimize measurement errors
(Figure 5B). Considering the characteristics of
temperature and salinity on the day of measurement,
the speed of sound was 1531.58 m/s.
Figure 5: A) An example of the inaccuracy of the lake
bottom display due to an incorrect speed of sound; B) An
GISTAM 2022 - 8th International Conference on Geographical Information Systems Theory, Applications and Management
140
set speed of sound during the bathymetric survey of the
lake.
The MBES survey (Figure 6) was performed four
times (Table 2) to collect as many points as possible
so that a more accurate bathymetric model can be
made after the point filtering process. The percentage
of overlap was 50% because the relatively small
research area allowed it. The operating frequency was
set to 160 kHz, while the operating beam width was
20°. The ping rate varied from 10 to 14 /sec. The
device collected and displayed real-time data of boat
position, speed, azimuth, plane deviation, and depth
based on predefined user-defined system settings.
The GPS antenna was connected to the CROPOS
(Croatian Positioning System) system via the GSM
network. That enabled a very high accuracy of the
collected data. The system collected data in the
WGS84_UTM_N33 projection.
Figure 6: The MBES survey of the Lake Zmajevo oko.
Table 2: Characteristics of collected unfiltered points.
Survey Min Z Max Z Z Range Number of
points
1 -0.91 -18.54 -17.63 1 397 243
2 -0.73 -19.82 -19.09 1 267 833
3 -1.07 -20.37 -19.30 1 487 819
4 -1.25 -16.91 -15.66 521 969
Total 4 674 864
The measured data were transferred to the desktop
computer for further processing and interpretation via
software packages for guidance (CDX) and data
management (Data Manager). Numerous authors
stated that one of the most demanding tasks in the
MBES process is data filtering (An et al., 2019; Šiljeg
et al. 2022). Following the Šiljeg et al. (2022) three
methods were used in the data filtering process: (a)
manual removal which is an extremely time-
consuming and demanding process; (b) automatic
method Label Connected Components in
CloudCompare software, and (c) SOR filter
(Statistical Outlier Removal).
A digital bathymetry model (DBM) with
continuous surfaces was produced from a filtered
dense point cloud using the interpolation method
Natural Neighbour. Spatial resolution was calculated
using the Grid calculator and the Point pattern
analysis method was chosen (Hengl, 2006). The
optimal spatial resolution of 5 cm was selected for the
multisensor model (DBM+DSM). It represents a
compromise between the sampling density of points
collected by UAV and MBES points and the research
area. The resolution was reduced to 10 cm for
visualization. The validation method of the generated
DBM included only the visual inspection of the
created model with the findings of an experienced
diver who knows the bottom of the lake in order to
make sure that the most conspicuous outliers were
removed. In the final phase of the processing, the
surface area, volume, and shoreline length were
calculated. The volume was calculated from a regular
grid obtained by interpolation. Three Newton-Cotes
formulas integrated within the Surfer software were
used: (a) Trapezoidal Rule; (b) Simpson's Rule; and
(c) Simpson's 3/8 Rule. The total surface area of the
lake and the shoreline length were calculated in the
ArcMap software.
3.3 Virtual Walk
Using the trial version of Lumion, a short promotion
video and six 360° panoramas were created. First, the
created 3D models in .obj format were imported. The
high polygon count within the photogrammetry
process caused a slowdown. Therefore, the number of
it was reduced. The next step included a selection of
the six locations which represented the best model
(Figure 7). The final step was to set the parameters in
the render all 360° panoramas option. The output
quality was set to 4/5, the stereoscopic view was
turned on and the distance between the two eyes was
set to 64.0 mm to give the appearance of space depth.
The images were generated for computer or mobile
platforms. Panoramas were exported in resolution
4096x4096. To create a promotional video, 50
selected viewpoints were rendered. Video quality was
set to 5/5, and the number of frames per second to 30.
The video resolution was set to Full HD (1920x1080).
Multi-Sensor 3D Modeling of Natural Heritage: Example of the Lake Zmajevo Oko
141
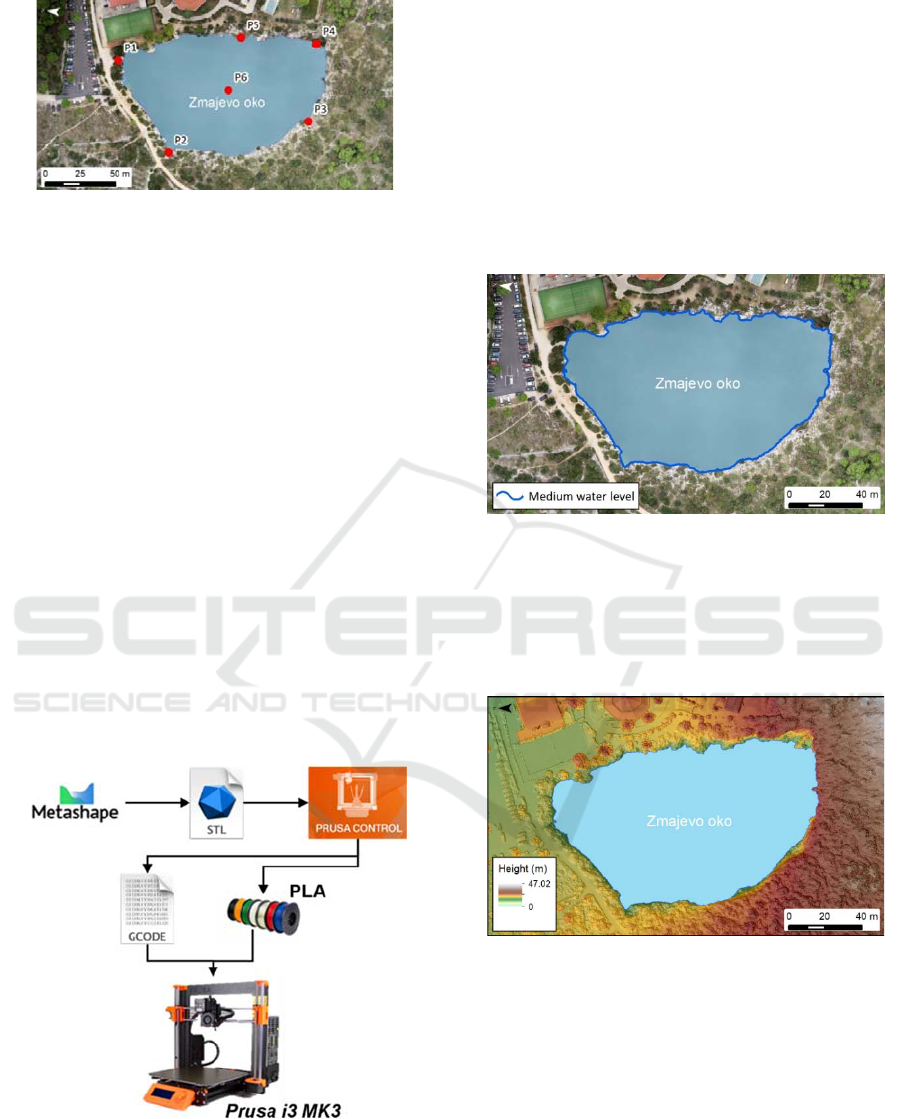
Figure 7: Spatial distribution of the six 360° panoramas.
3.4 3D Print
A 3D printing of the Lake Zmajevo oko was
performed using a 3D printer Prusa i3 MK3. Creating
a 3D physical model consisted of several steps
(Figure 8). First, the data was converted to .stl format.
This mesh must be dense enough to achieve the
satisfactory quality of the physical model. However,
it should not be too complex to avoid overloading and
slowing down of the computer (Marić et al., 2019).
Then, the 3D printing parameters were set. The
orientation of the model and the type of filament were
adjusted. PLA (polylactide) plastic has proven to be
the best choice because of its compactness, strength,
and further processing.
The height of the filament layer was set at 0.15
mm. Then the model was exported in the G-code
format that is standard for most 3D printers and
industrial machines. In the final phase, the model was
transferred to a previously calibrated 3D printer with
a USB memory and 3D printing of the lake was
performed.
Figure 8: 3D printing process of the Lake Zmajevo oko.
4 RESULTS AND DISCUSSION
4.1 UAV Photogrammetric Survey
From the UAV photogrammetric survey conducted
on July 19, 2019, the following models of the Lake
Zmajevo oko were derived: (a) a high-resolution DOP
(Figure 9); (b) a high-resolution DSM (Figure 10);
and (c) a 3D model of the lake (Figure 11). A high-
resolution DOP of the Lake Zmajevo oko had a
spatial resolution of 1.56 cm (Figure 9).
Figure 9: A high-resolution DOP of the lake.
A DSM (GSD = 3.12 cm) (Figure 10) of the wider
coastal area of the Lake Zmajevo oko was generated
from a dense point cloud. The high value of resolution
is because the Quality parameter in Agisoft
Metashape was set to High.
Figure 10: A high-resolution DSM of the lake.
Finally, a 3D model of the wider coastal area of
Lake Zmajevo oko was generated (Figure 11). The
derived model can be used for promotional purposes
by creating a virtual walk. It is necessary to render
selected points around the lake to do that. However,
it is also possible to make a virtual walk in which the
user cannot manage and make decisions, but the
whole walk is pre-programmed. Panoramic 360°
shots and a short promotional video were made based
on this model.
GISTAM 2022 - 8th International Conference on Geographical Information Systems Theory, Applications and Management
142
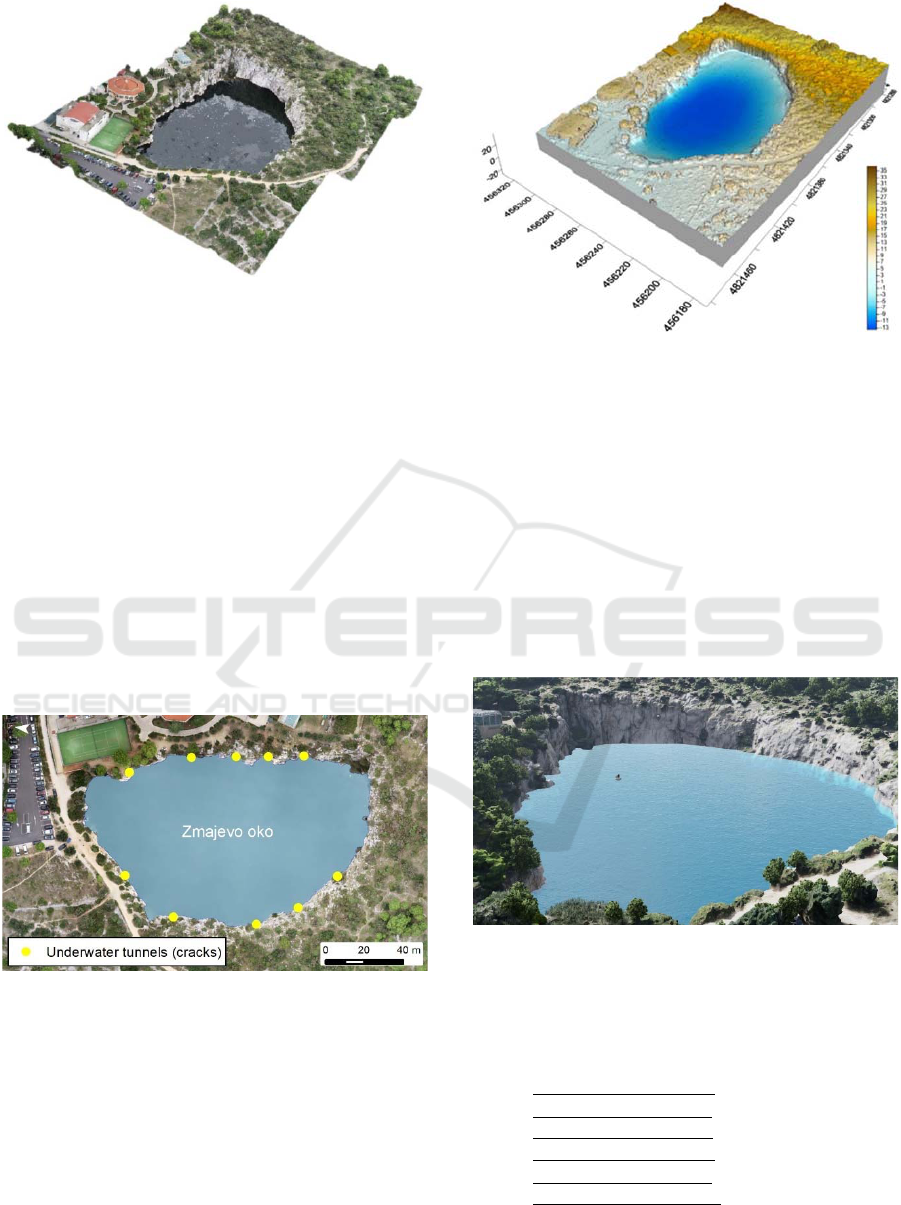
Figure 11: A 3D model of the lake.
4.2 MBES Survey
A total of 4 674 864 points were collected. The
operating frequency of 160 kHz allowed mapping the
actual bottom of the lake despite the presence of a
thick layer of hydrogen sulfide in the bottom layer.
The minimum collected value of depth was -0.73 m,
and the maximum depth was -20.37 m (Table 1).
These maximum and minimum values are the results
of outliers present in the unfiltered point cloud. They
were removed following the point-cloud processing
approach presented in Šiljeg et al. (2022). Thanks to
the wide operating angle, the possibility of side-
scanning, and the selected operating frequency, ten
horizontal underwater tunnels (cracks) were detected
and marked (Figure 12).
Figure 12: Locations of underwater tunnels (cracks).
A DBM with a maximum depth of -13.45 m was
generated. The first multisensor model of the Lake
Zmajevo oko was created by merging a DBM with a
DSM created by UAV photogrammetry (Figure 13).
The volume of the Lake Zmajevo oko on the day
of the MBES survey was 90691.74 m
3
, the length of
the coastline was 513.15 m, and the surface area was
0.99 ha.
Figure 13: An multisensor model of the lake Zmajevo oko.
4.3 Virtual Walk
A promotional video called Zmajevo oko Virtual
Walk (Rogoznica, Croatia) was created (Figure 14).
It was published on the official website of the
Geospatial Analysis Laboratory (GAL).
Six viewpoints with panoramic 360
o
images were
also rendered (Figures 7 and 15). They cover the
researched area and give the potential visitor a quality
visual impression about this protected area. Videos
and panoramic images can be used to promote the
lake online.
Figure 14: A clip from a promotional video Zmajevo oko
Virtual Walk (Rogoznica, Croatia).
Panoramic 360
o
images of the lake can be found
on the 360Cities open-source platform. The
recordings can be viewed at the following links:
P1: https://cutt.ly/KInIJbQ;
P2: https://cutt.ly/GInI2ye;
P3: https://cutt.ly/gInI7Gy;
P4: https://cutt.ly/NInOtJP;
P5: https://cutt.ly/lInOp89;
P6: https://cutt.ly/KInOh64.
Multi-Sensor 3D Modeling of Natural Heritage: Example of the Lake Zmajevo Oko
143
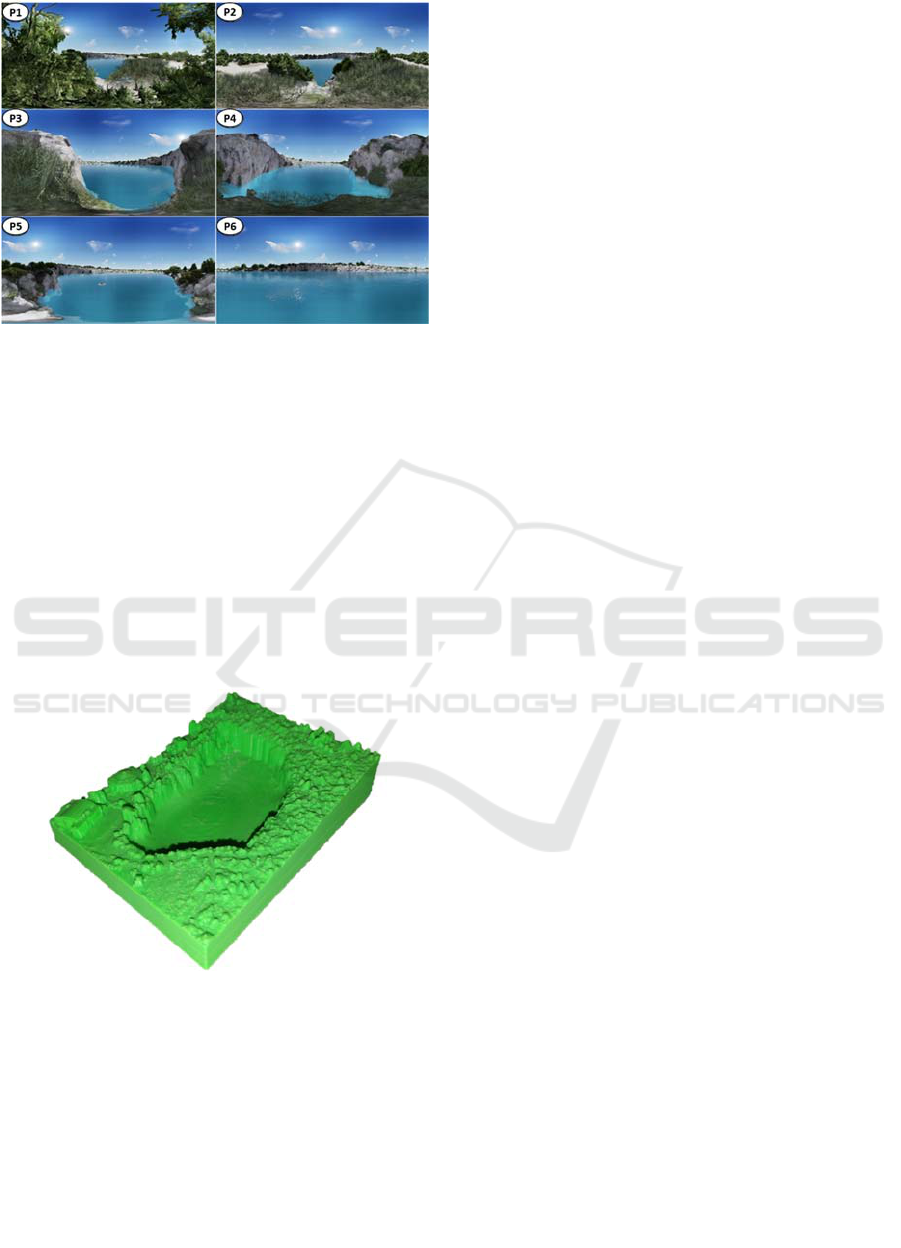
Figure 15: Panoramic 360
o
images of the lake Zmajevo oko
from six viewpoints.
4.4 3D Print
The physical model (12 x 9 cm) of the Lake Zmajevo
oko (Figure 16) was generated. This model can be
used as a souvenir, and if desired, it can be
personalized. The filament is made of completely
workable material and can be painted as desired.
Anastasiadou and Vettese, (2019) examined visitor
preferences and managers' views on 3D printed
souvenirs and concluded that there is a tourist interest
in this type of souvenir and that this is the future of
tourism.
Figure 16: A physical model of the Lake Zmajevo oko.
5 CONCLUSIONS
In this research, we presented an application of
modern GSTs and their use for promotional purposes.
High-quality DSM and DBM have been created. A
multisensor model of this natural phenomenon was
made. The accuracy of the UAV images calculated by
the MAE is 3.99 cm and for the RMSE 4.13 cm in
CPs. The biggest challenge was the choice of the
operating frequency of the MBES considering the
physio-chemical characteristics of the lake. The
operating frequency of 160 kHz allowed mapping the
actual bottom of the lake despite the presence of a
thick layer of hydrogen sulfide in the bottom layer.
All four measurements were made with the same
frequency and dense cloud points were successfully
collected.
The integrated measuring system enabled the
detection of underwater tunnels. The distribution and
characteristics of the detected underwater tunnels will
be discussed in future research. Based on the DOP
and DSM, exact volume, surface area and shoreline
length data were derived. Based on 3D model of the
lake the virtual walk was generated. Finally, using a
modern 3D printer, a physical model of the lake with
a wider coastal area was made. That model can be
used as a souvenir to promote the Lake Zmajevo oko.
The documentation of this natural heritage can enable
further monitoring of changes and it is the starting
point for future research in this area.
ACKNOWLEDGEMENTS
This research was performed within the project
Bathymetric and geodetic survey of the lake Zmajevo
oko as a part of economic cooperation between the
University of Zadar and the Public Institution for the
Management of Protected Areas and Other Protected
Parts of Nature of Šibenik-Knin County and
supported by Croatian Science Foundation under the
project UIP-2017-05-2694.
REFERENCES
Abdalla, R. (2016). Introduction to geospatial information
and communication technology (GeoICT). Springer
International Publishing.
Agüera-Vega, F., Carvajal-Ramírez, F., & Martínez-
Carricondo, P. (2017). Assessment of photogrammetric
mapping accuracy based on variation ground control
points number using unmanned aerial vehicle.
Measurement, 98, 221-227.
An, L., Rignot, E., Millan, R., Tinto, K., & Willis, J. (2019).
Bathymetry of northwest Greenland using “Ocean
Melting Greenland”(OMG) high-resolution airborne
gravity and other data. Remote Sensing, 11(2), 131.
Anastasiadou, C., Vettese, S. (2019). “From souvenirs to
3D printed souvenirs”. Exploring the capabilities of
additive manufacturing technologies in (re)-framing
tourist souvenirs. Tourism Management, 71, 428-442.
Bakran-Petricioli, T., Petricioli, D., Požar-Domac, A.
(1998). Influence of isolation and peculiar ecological
GISTAM 2022 - 8th International Conference on Geographical Information Systems Theory, Applications and Management
144

properties on biodiversity–an example of marine lake
Zmajevo Oko near Rogoznica (Adriatic Sea). Rapports
et proces verbaux des réunions–Commission
internationale pour l’exploration scientifique de la mer
Méditerranée, 35(2), 518-519.
Bishop, M. P., James, L. A., Shroder Jr, J. F., Walsh, S. J.
(2012). Geospatial technologies and digital
geomorphological mapping: Concepts, issues and
research. Geomorphology, 137(1), 5-26.
Bodzin, A. M., Cirucci, L. (2009). Integrating geospatial
technologies to examine urban land use change: A
design partnership. Journal of Geography, 108(4-5),
186-197.
Boehler, W., Heinz, G., Siebold, M. (2001). Topographic
information in cultural and natural heritage
visualization and animation. International Archives of
Photogrammetry and Remote Sensing, 34(5/W1), 56-
61.
Bruno, F., Bruno, S., De Sensi, G., Luchi, M. L., Mancuso,
S., Muzzupappa, M. (2010). From 3D reconstruction to
virtual reality: A complete methodology for digital
archaeological exhibition. Journal of Cultural
Heritage, 11(1), 42-49.
Bura-Nakić E., Ciglenečki I., Bošković N., Burić Z.,
Ćosović B. (2007): Sezonska i okomita raspodjela
organske tvari i reduciranih sumpornih vrsta u vodenom
stupcu Rogozničkog jezera, Hrvatske vode i Europska
Unija - izazovi i mogućnosti: zbornik radova, Zagreb:
Hrvatske vode, 85-90.
Bura-Nakić, E., Marguš, M., Orlić, S., Ciglenečki, I.
(2012). Zmajevo oko–a unique example of anchialine
system on the Adriatic coast (Croatia) during spring-
summer stratification and autumn mixing
period. Natura Croatica: Periodicum Musei Historiae
Naturalis Croatici, 21(suppl. 1), 17-20.
Ciglenečki, I., Kodba, Z., Ćosović, B. (1996). Sulfur
species in Rogoznica lake. Marine chemistry, 53(1-2),
101-110.
Dong, Q. L., Cui, M. X., Zhou, J. H., Wang, J. G., Xu, Y.
(2011). Analysis and Processing of Transform
Geography of Convex and Cave in Multibeam
Sounding System [J]. Hydrographic Surveying and
Charting, 1.
Dong, Q. L., Han, H. Q., Fang, Z. B., Pan, L., Chen, Y. Y.,
Lu, G. F. (2007). The Influence of Sound Speed Profiles
Correction on Multi-beam Survey. Hydrographic
Surveying and Charting, 2, 56-58.
Doulamis, A., Grammalidis, N., Ioannides, M., Potsiou, C.,
Doulamis, N. D., Stathopoulou, E. K., ... &
Dimitropoulos, K. (2015). 5D modelling: an efficient
approach for creating spatiotemporal predictive 3D
maps of large-scale cultural resources. In ISPRS Annals
of the Photogrammetry, Remote Sensing and Spatial
Information Sciences, Volume II-5/W3, 25th
International CIPA Symposium 2015, 31 August – 04
September 2015, Taipei, Taiwan
Erenoglu, R. C., Akcay, O., & Erenoglu, O. (2017). An
UAS-assisted multi-sensor approach for 3D modeling
and reconstruction of cultural heritage site. Journal of
cultural heritage, 26, 79-90.
Fabris, M., Baldi, P., Anzidei, M., Pesci, A., Bortoluzzi, G.,
Aliani, S. (2010). High resolution topographic model of
Panarea Island by fusion of photogrammetric, lidar and
bathymetric digital terrain models. The
photogrammetric record, 25(132), 382-401.
Ficarra, F. V. C. (2011, September). The expansion era of
the communicability: first nations for the local and
global promotion of cultural and natural heritage.
In International Workshop on Human-Computer
Interaction, Tourism and Cultural Heritage (pp. 25-
37). Springer, Berlin, Heidelberg.
Hackett, J. K., Shah, M. (1990, May). Multi-sensor fusion:
a perspective. In Proceedings., IEEE International
Conference on Robotics and Automation (pp. 1324-
1330). IEEE.
Hengl, T. (2006). Finding the right pixel size. Computers &
geosciences, 32(9), 1283-1298.
Kyriakaki, G., Doulamis, A., Doulamis, N., Ioannides, M.,
Makantasis, K., Protopapadakis, E., ... & Weinlinger,
G. (2014). 4D reconstruction of tangible cultural
heritage objects from web-retrieved images.
International Journal of Heritage in the Digital Era,
3(2), 431-451.
Leonov, A., Aleynikov, A., Belosokhov, D., Bobkov, A.,
Eremchenko, E., Frolov, P., ... Klimenko, S. (2011). 3D
Documentation of Natural Heritage for Virtual
Environments and Web—Case Study: Valley of
Geysers, Kamchatka. In Proc. of the IADIS
International Conference CGVCVIP (pp. 255-259).
Manić, L., Aleksić, M., Tankosić, M. (2013). Possibilities
of New Technologies in Promotion of the Cultural
Heritage: Danube Virtual Museum. In 2nd
International Conference on Sustainable Tourism and
Cultural Heritage (STACH'13)“Advances in
Environment, Ecosystems and sustainable Tourism”,
Brasov, Romania.
Marić, I., Šiljeg, A., Domazetović, F. (2019). Geoprostorne
tehnologije u 3D dokumentaciji i promociji kulturne
baštine–primjer utvrde Fortica na otoku
Pagu. Geodetski glasnik, 50, 19-44.
Remondino, F., Rizzi, A. (2010). Reality-based 3D
documentation of natural and cultural heritage sites—
techniques, problems, and examples. Applied
Geomatics, 2(3), 85-100.
Rogers, S. R., Manning, I., Livingstone, W. (2020).
Comparing the spatial accuracy of Digital Surface
Models from four unoccupied aerial systems:
Photogrammetry versus LiDAR. Remote Sensing,
12(17), 2806.
Šiljeg A, Marić I, Domazetović F, Cukrov N, Lovrić M,
Panđa L. (2022). Bathymetric Survey of the St.
Anthony Channel (Croatia) Using Multibeam
Echosounders (MBES) - A New Methodological Semi-
Automatic Approach of Point Cloud Post-Processing.
Journal of Marine Science and Engineering,10(1):101.
Šiljeg, A., Barada, M., Marić, I. (2018). Digital Terrain
Modelling. Alfa d.d. and University of Zadar, Zagreb.
Tussyadiah, I. P., Wang, D., Jung, T. H., tom Dieck, M. C.
(2018). Virtual reality, presence, and attitude change:
Multi-Sensor 3D Modeling of Natural Heritage: Example of the Lake Zmajevo Oko
145

Empirical evidence from tourism. Tourism
Management, 66, 140-154.
UNESCO (1972). UNESCO Convention Concerning the
Protection of the World Cultural and Natural Heritage,
United Nations Educational, Scientific and Cultural
Organization, Paris (1972).
URL 1 https://www.dji.com/hr/phantom-4-pro/info, 28
February, 2022.
URL 2 https://www.stonex.it/project/s10-gnss-receiver/, 28
February, 2022.
GISTAM 2022 - 8th International Conference on Geographical Information Systems Theory, Applications and Management
146
