
Perceptions on the Use of an Online Tool in the Teaching-learning
Process in Microscopy
Breno N. S. Keller
1 a
, Mariana T. Rezende
2 b
, Tales M. Machado
1 c
, Saul Delabrida
1 d
,
Claudia M. Carneiro
2 e
and Andrea G. C. Bianchi
1 f
1
Computing Department, Federal University of Ouro Preto, Ouro Preto, MG, Brazil
2
Clinical Analysis Department, Federal University of Ouro Preto, Ouro Preto, MG, Brazil
Keywords:
Online Learning, Cytology, Microscopy, Evaluation.
Abstract:
During the COVID-19 pandemic, remote learning was an alternative to maintaining student participation in
subjects, active learning, and knowledge development. This approach is necessary for the experimental de-
mands of the practical content of the Cervical Cytology class. This paper presents and discusses using an
online platform to learn practical content in the microscopy subject of Cervical Cytology class. The evaluated
scenarios demonstrated that the planning of the discipline and personal factors such as student interest and
availability could influence the student performance.
1 INTRODUCTION
Digital native is a term defined by (Prensky, 2001)
to refer to a generation who were born in a world
greatly permeated by technology. That means they
expect digital tools to constantly mediate their inter-
actions with the world. Such assumption implies that
even contents covered in the classroom need to be
closer to their digital daily life to keep students inter-
ested and motivated. Therefore, there is a formal ex-
pectation that education at all levels (university, high
school, and elementary) incorporate educational tech-
nologies in their execution resulting in practices of
Digital Technologies of Information and Communica-
tion (Bahia et al., 2019). This approach aims to facil-
itate, enhance learning, and include innovative prac-
tices in education.
Thus, computational tools are necessary to ad-
dress that vision in several areas of knowledge since
these tools allow the learning process to be modified
to suit the student or explore different teaching meth-
ods for the same topic.
(Guze, 2015) classify these tools in the following
a
https://orcid.org/0000-0001-5414-6716
b
https://orcid.org/0000-0002-9514-9312
c
https://orcid.org/0000-0003-0603-823X
d
https://orcid.org/0000-0002-8961-5313
e
https://orcid.org/0000-0002-6002-857X
f
https://orcid.org/0000-0001-7949-1188
categories: computer-assisted learning, mobile de-
vices, digital games (or serious games), simulations,
and wearable equipment. Moreover, despite the sim-
ilarity between these tools due to the computational
resources used, each represents a different interaction
model, which explores users’ different senses and per-
ceptions, allowing access to activities analogous to
the experimental ones in the case of remote learning.
In digital pathology and cytopathology, these ap-
proaches range from different scholar levels, from in-
side university classrooms to conferences and spe-
cializations (Maley et al., 2008; Wiecha et al., 2010;
Bahia et al., 2019; Guiter et al., 2021). The technol-
ogy allowed a significant transformation in the pro-
cess with the digitization of microscopic slides to gen-
erate images of whole slides (Whole slide imaging
(WSI) or digital slides), which can be manipulated by
the operator and used in the learning context (Hanna
et al., 2020; Guiter et al., 2021). However, such sys-
tems require high-value equipment and are not easy
to access. In addition, users (students) also need qual-
ity internet access and good computers to use these
resources well.
This work proposes a digital tool to support the
implementation of remote model microscopy subjects
and the discussion and evaluation of such interaction.
Hence two remote teaching scenarios of a cytology
discipline were implemented using a support tool for
assessing students. These scenarios were performed
during the COVID-19 pandemic in 2020 and 2021.
Keller, B., Rezende, M., Machado, T., Delabrida, S., Carneiro, C. and Bianchi, A.
Perceptions on the Use of an Online Tool in the Teaching-learning Process in Microscopy.
DOI: 10.5220/0011062200003179
In Proceedings of the 24th International Conference on Enterprise Information Systems (ICEIS 2022) - Volume 2, pages 325-331
ISBN: 978-989-758-569-2; ISSN: 2184-4992
Copyright
c
2022 by SCITEPRESS – Science and Technology Publications, Lda. All rights reser ved
325

This work is structured as follows: Section 2
presents some related works; Section 3 presents a
contextualization of the class used as the basis; Sec-
tion 4 introduces the digital the tool used; Section 5
presents the evaluated scenarios; Section 6 describes
the results observed and Section 7 presents the con-
clusions of this work.
2 RELATED WORK
(Maley et al., 2008) propose a computational tool
used to assist teaching. The authors evaluate how a
web system helps in the pathology learning process.
It was observed how these students behave in the pro-
posed scenario and how this impacts their learning
process. One behavior observed is that users prefer
a face-to-face setting and are not fulfilling the appli-
cation’s response deadlines during the school term.
However, only a small group of students maintained
this behavior. That was associated with individuals’
characteristics, who focus on the result as a study
strategy.
Another use of computational resources as teach-
ing tools was shown by (Wiecha et al., 2010) where
they discuss the use of the Second Life (SL) platform
for teaching and training. The SL is a virtual envi-
ronment focused on providing communication and in-
teraction resources to users. The authors created a
test case based on a seminar on the use of insulin for
patients with type 2 diabetes. The scenario allowed
participants to be more confident about evaluating the
need to apply the discussed treatment after participat-
ing in the dynamics. In addition, participants also re-
ported that the interaction model was as good or su-
perior to a traditional face-to-face model.
(Krasne et al., 2013) shows a combination of
learning tools and algorithms, which presents a sys-
tem to aid the study of histopathology based on a
web system, which implements an adaptive learning
model. The user is provided with a study scenario
that presents different cases related to the course con-
tents to improve students’ long-term content reten-
tion. Moreover, the system presents a case study and
options to identify which type of problem (injury) the
case study addresses. Furthermore, the order in which
the case studies are delivered to the user is constructed
using an algorithm that learns from the user’s perfor-
mance. It was observed how students’ content reten-
tion was through their reassessment in later periods,
which showed that users who used the system had
greater content retention.
(Darici et al., 2021) report the implementation of
a histology course in a remote model for the context
of the COVID-19 pandemic. Students from two dif-
ferent academic periods (second and third) were eval-
uated in the scenario developed. These students were
introduced to the course content and performed inter-
active activities during remote classes. At the end of
the course, the students’ performance was evaluated
as 71% (second period) and 74% (third period). How-
ever, the students’ evaluation of the model was posi-
tive, on a 100-point scale with 1 being “very good”
and 100 being “very bad” students reported a median
of 21 (second semester) and 22.5 (third semester).
The works described in this section show that the
remote teaching-learning process is possible and fea-
sible. However, they present a great variety in how
they work and are applied, consequently impacting
their performance.
3 CERVICAL CYTOLOGY
The Cervical Cytology class aims to present to un-
dergraduates the dimension of cervical cancer and
how screening for this neoplasm is essential to ensure
women’s health. This class aims to enable students
to develop logical, critical, and analytical reasoning
in the face of cervical cancer screening. All screen-
ing steps are characterized, from the collection of the
material to the release of the diagnosis report, includ-
ing staining techniques, assembly, reading of the cyto-
logical smear, interpretation, quality monitoring, and
report. In addition, there is content focused on the
physiology of the female reproductive system, his-
tology, cytology of the cervix, hormones, menstrual
cycle, inflammatory processes, microbiota, and cyto-
morphological criteria of malignancy.
Most of the concepts and contents presented in the
class are linked to identifying and recognizing ele-
ments in the Pap smears when viewed under an op-
tical microscope or in images originated from them.
Traditionally, the professor explains the content by
exposing many images illustrating cervical-vaginal
smears, infectious agents, microbiota, inflammatory
processes, cytological changes, and other important
biological structures to understand the theory studied
fully. So, the visualization of images within this disci-
pline’s teaching is crucial for better student learning.
The course evaluation is split into two parts: theo-
retical and practical. The practical classes of the dis-
cipline are carried out under an optical microscope
for visualization of cytology slides after each theo-
retical class, covering the topics and biological struc-
tures taught for a better understanding of the students.
Thus, each student has an optical microscope and
slides available to visualize the subjects teach in the
ICEIS 2022 - 24th International Conference on Enterprise Information Systems
326
theoretical classes and are present in the slide. Also,
the practical classes are accompanied by the teacher
and allow the students to look at different examples
equivalent to multiple slide images over each lecture’s
content.
The periods evaluated were remote, so applying
the traditional practical test under an optical micro-
scope was impracticable. Therefore, the tool pre-
sented in Section 4 was essential to assess students re-
garding the visual requirements required in the practi-
cal test, which are fully linked to the theoretical con-
tent taught. In addition to the tool presenting a content
review, it was responsible for learning tests.
4 THE SYSTEM
This section describes the system used during the
class as a support tool. The computational system was
constructed based on the interaction process for iden-
tifying and recognizing the elements present in the
Pap smear. The students perform these activities in
optical microscopes during classes and practice tests.
Thus, the online platform was built to replicate the in-
teraction and experience from those situations. More-
over, due to accessibility, the system was designed to
be used in mobile device browsers. Also, the system
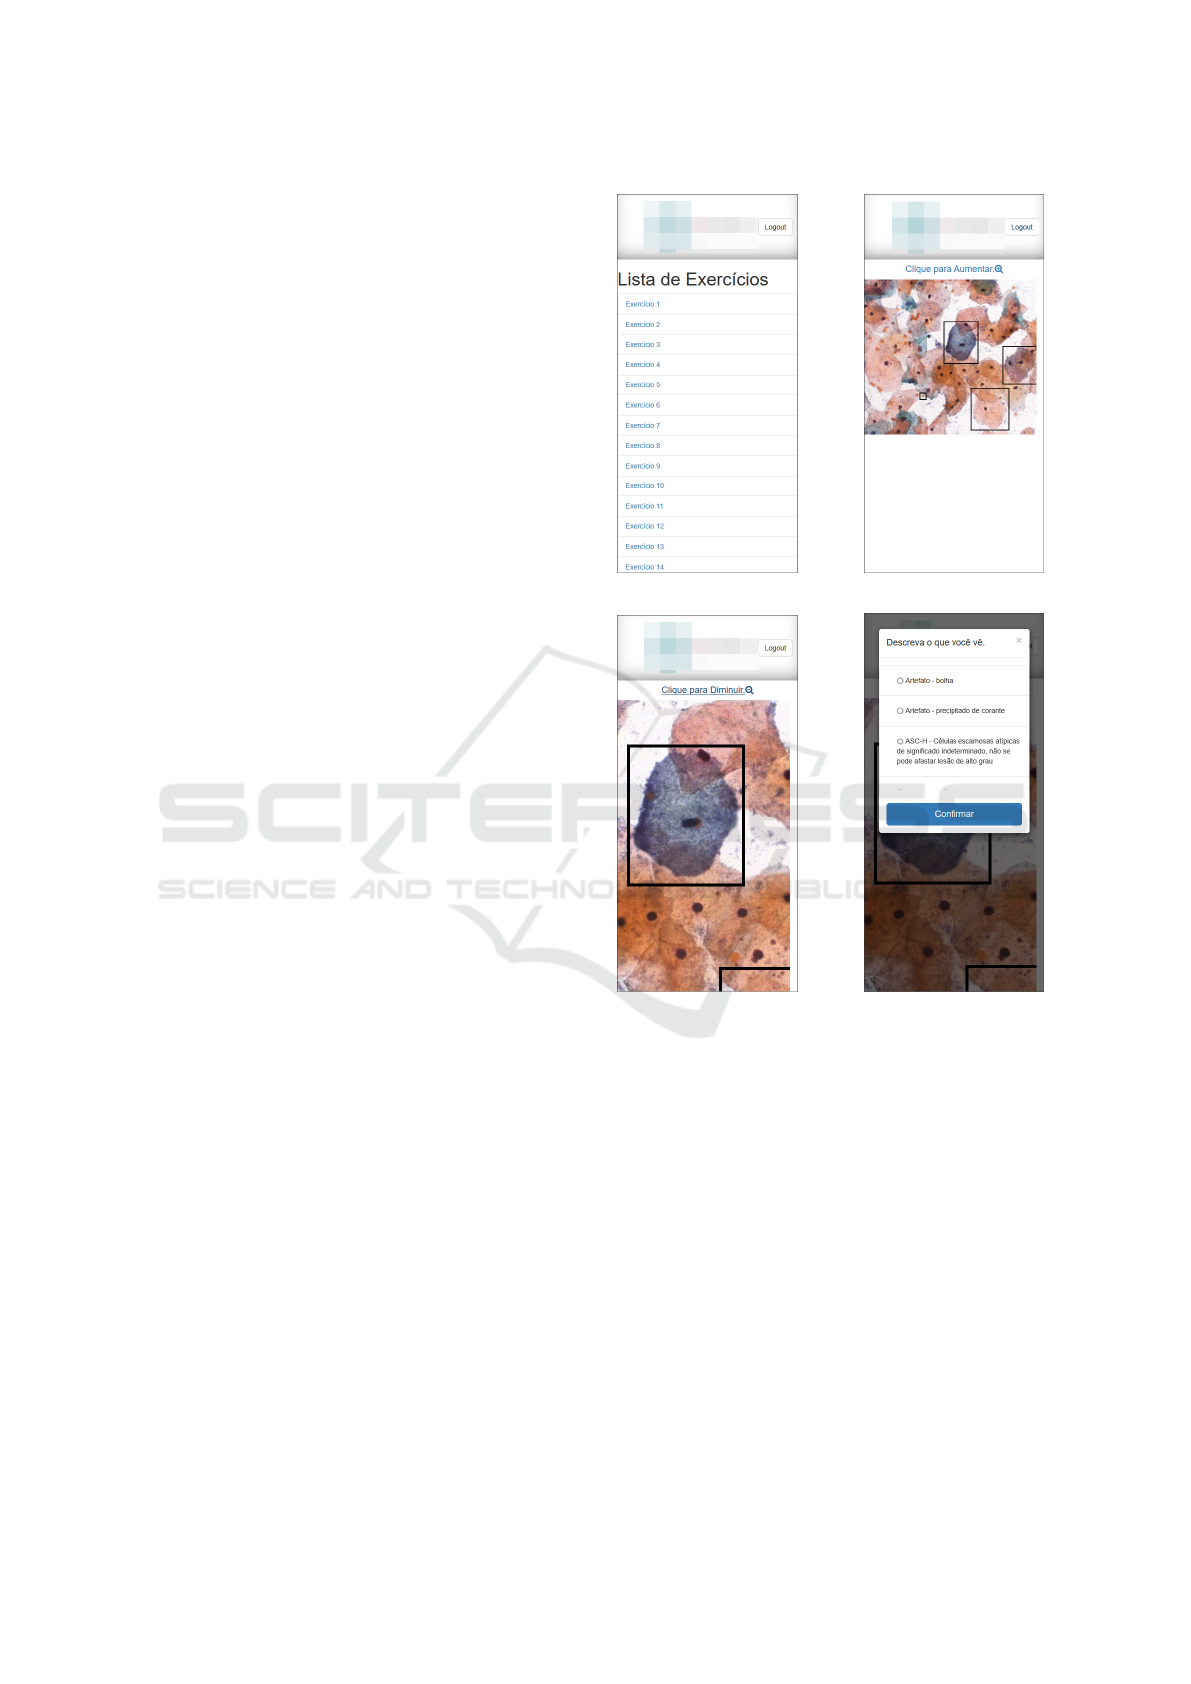
interface is in the students’ native language. Figure 1
shows screens of the implemented system.
Figure 1a presents the list of exercises (or activi-
ties) that students must answer on the topics studied
in the theoretical class. When the user clicks on one
exercise of the list, the system shows a screen similar
to Figure 1b. The image to be evaluated is presented
with the regions of interest (denominated questions)
to be identified and named. Multiple regions of inter-
est in the same image make up the activity. The stu-
dent is also able to zoom in on the image to see more
details of the analyzed region, as shown in Figure 1c.
Finally, the student clicks on the region, and multi-
ple options are presented to select which alternative
best describes the highlighted (or marked) region, as
shown in Figure 1d. The student has prompt feedback
about his answer and can view the correct answer for
a region if he has selected the wrong option. The ex-
ercise is completed and corrected by answering all the
questions in the image.
Besides, considering the return of face-to-face ac-
tivities, this tool can also be used in the routine of
practical classes to establish knowledge, not only in
cytology but in any subject involving microscopy.
It is necessary to point out that the presentation
and description of this tool are not essential for this
article, but their use in the process of interaction in
(a) Exercise List. (b) Evaluated Image.
(c) Region of Interest. (d) Answers Alterna-
tives.
Figure 1: System Screens.
online pathology classes. To facilitate understanding,
in the next section, we will describe the experimenta-
tion scenario used to evaluate the interaction between
students and their performance in the tool.
5 TEST SCENARIOS
In this section, the observed scenarios are described.
They correspond to two approaches of remote learn-
ing activities carried out during the COVID-19 pan-
demic between 2020 and 2021. In both scenarios, the
system described in Section 4 was used, in which 87
activities and a total of 249 questions were consid-
ered.
Perceptions on the Use of an Online Tool in the Teaching-learning Process in Microscopy
327

5.1 Scenario 1: Shorter Academic
Period
The first scenario corresponds to a model of a reduced
academic period, designed as an alternative for re-
motely carrying out the subject during the pandemic.
The class was developed in a shorter time than the tra-
ditional one, in this case, nine weeks instead of eigh-
teen weeks. Thus, in addition to the remote execution
model, it was also a faster and more compact model
than the traditional one. The classes were four times
a week instead of twice. However, the participation
of students in this period was optional, so the student
enrolled in the course had some interest or motivation
in carrying out this process.
As for the course dynamics, system access, and
evaluation, the students had only one deadline at the
end of the school term. This deadline includes all the
activities of the system.
5.2 Scenario 2: Regular Academic
Period
The second scenario corresponds to a regular model
of academic terms carried out remotely. In this case,
the period comprises fourteen weeks, and the partici-
pation of students in the period was mandatory.
In this scenario, the dynamics, system access, and
evaluation were divided into two deliveries: around
the first half of the course, which means around 50
days, and the other half at the end of the school term.
6 RESULTS AND DISCUSSIONS
This section presents the results observed in the sce-
narios described above. Only the data from students
who have completed the course are considered, that
is, those who have completed the discipline.
6.1 Scenario 1: Shorter Academic
Period
In Scenario 1, 12,164 responses were obtained from
50 students (97.70% of all possible answers, 98.11%
of all possible activities), which resulted in an aver-
age of 243.28 responses per student. Students had an
average hit rate of 85.47% concerning answered ques-
tions and 83.51% concerning all available questions.
Figure 2 shows the distribution of student re-
sponses during the period considering the class. In-
terestingly, most responses are concentrated in the last
two weeks of the period. However, some answers are
in the middle of the observed period, which corre-
sponds to the end of complementary activities to the
discipline.
Figure 2: Accumulated Activities Answered in Scenario 1.
Figure 3 shows the distribution of student re-
sponses during the period. Students with less than
70% hit rate were considered outliers and excluded
from the analysis (resulting in 45 students out of 50),
the remaining students’ results were divided into 3
groups of size 15 based on their performance. Thus,
the group 1 corresponds to students with a hit rate
between 100% to 89.5%; group 2 corresponds to the
correctness range from 89.5% to 83.5% and group 3
corresponds to the correctness range from 83.5% to
75%. Each color in the Figures 3a, 3b and 3c repre-
sents a student and in case of overlap only one colored
point is shown.
By observing the Figures 3a, 3b and 3c, we can
identify two behaviors among students: (I) resolution
of activities throughout the course and (II) resolution
of activities at the end of the course. These behaviors
occur in all groups in different proportions. However,
the behavior II seems to be connected to better stu-
dent performance. Given that in group 1, which con-
tains the users with the best success rates, at least two-
thirds of the students did the activities at the end of the
course, and in one or two interactions, they answered
87 activities (247 questions) in two days.
6.2 Scenario 2: Regular Academic
Period
In the second scenario, 2,113 responses were ob-
tained from 9 students (94.29% of all possible an-
swers, 90.42% of all possible activities), resulting in
a rate of 234.78 responses per student. On average,
these students had a hit rate of 80.69% concerning
what they answered and 70.08% concerning all ac-
tivities.
Figure 4 shows the distribution of student re-
sponses during the academic period. It is interesting
ICEIS 2022 - 24th International Conference on Enterprise Information Systems
328
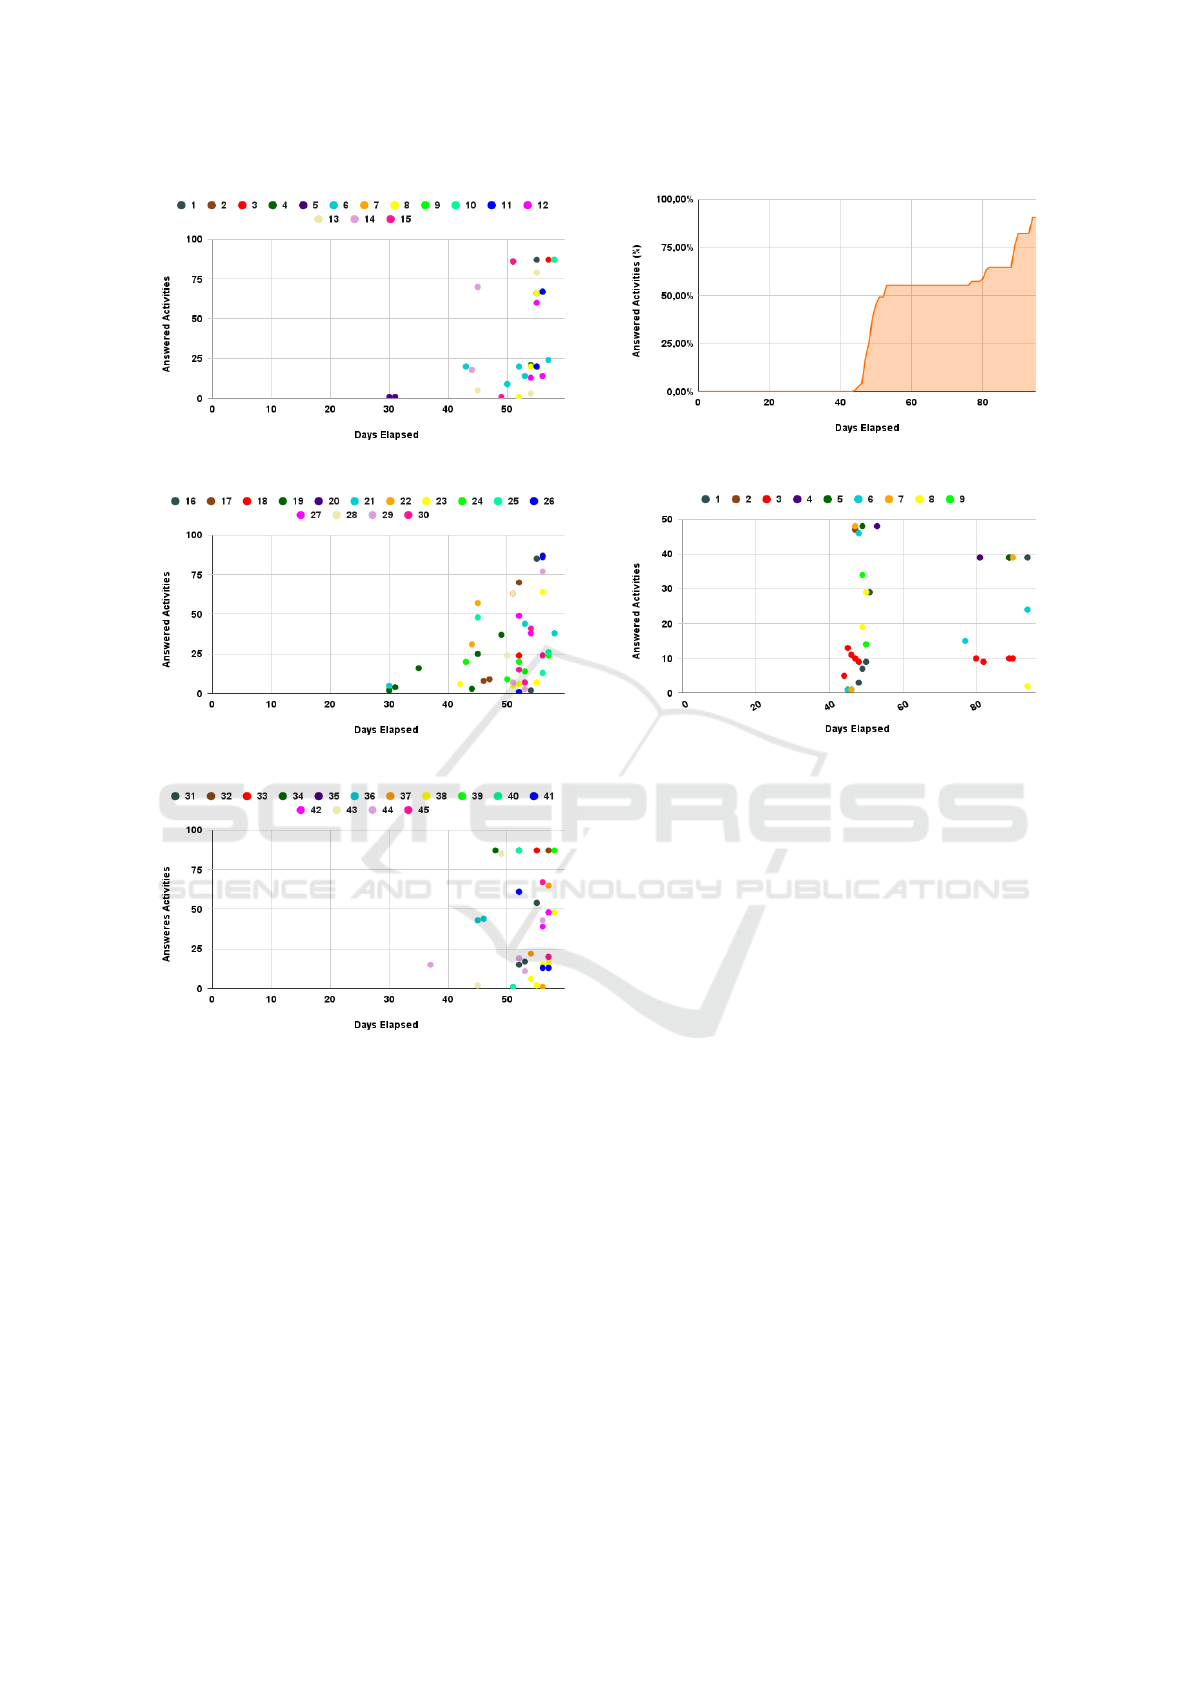
(a) Group 1.
(b) Group 2.
(c) Group 3.
Figure 3: Students Complete Activity Distribution in Sce-
nario 1.
to note that, as in this scenario, two delivery dates
were made for the activities (50 and 84 days elapsed
since the beginning). The distribution of responses is
concentrated around these two dates.
Figure 5 shows the distribution of student re-
sponses during the period. The responses are clus-
tered around the 50th (day of the first delivery) and
84th (second delivery), with a smaller concentration
in the last one. However, the number of responses
decreased in the second delivery. This behavior can
be related to the student’s feeling of having already
passed the discipline and redirecting his efforts to
other courses.
Figure 4: Accumulated Activities Answered in Scenario 2.
Figure 5: Students Complete Activity Distribution in Sce-
nario 2.
6.3 Discussion about Both Scenarios
In general, the methodology utilized in Scenario 1 al-
lowed it to have the highest success rate. This behav-
ior can be associated with the fact that the students an-
swered all the activities at the evaluation period end.
The course structure favors that behavior as the sub-
ject is passed to the students by cumulative exposi-
tion. This increases the students’ ability to assess the
elements on the images over the period. In this way,
students could assimilate more information about the
structures and the exposure during classes.
Figure 6 presents a summary of user success rates
in both scenarios. Considering the first delivery of
Scenario 2 as a splitting point, the data was separated
into two halves (the first and the second delivery of
Scenario 2). In the first half, it is observed that both
scenarios were obtained answers to almost all ques-
tions. However, the hit rates are both relative to what
was answered, and the total is proportional to each
other.
In the second half, there is again a lower delivery
rate of activities by students in Scenario 2. However,
the success rates relative to what was answered by the
students is high, on the order of 80%. The low de-
livery of activities reinforces the hypothesis that stu-
dents preferred not to respond to the activities, either
because they have already passed the subject or have
Perceptions on the Use of an Online Tool in the Teaching-learning Process in Microscopy
329
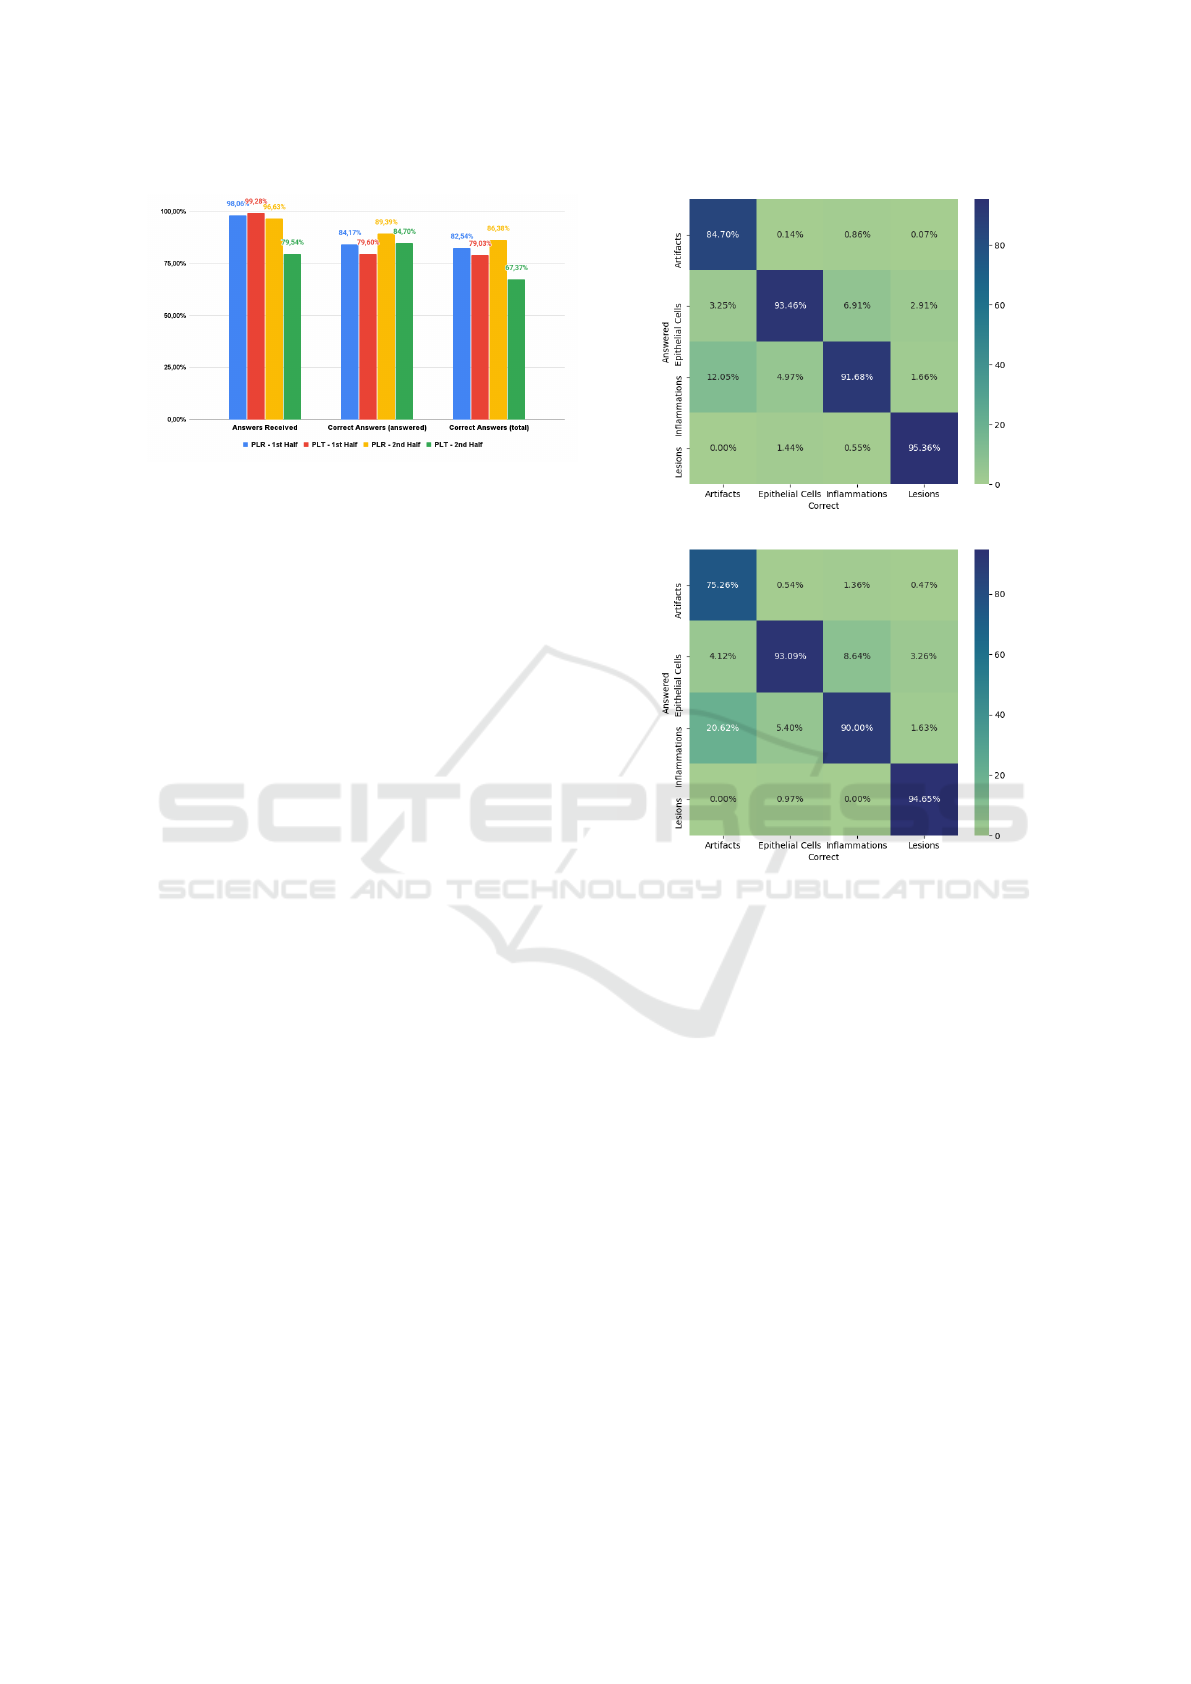
Figure 6: Answers Distributions in Both Halves of the Test
Scenarios.
other priorities (other courses). The observed hit rates
indicate they knew the subject; however, they pre-
ferred not to answer the activities.
Figure 7 presents the confusion matrix of the stu-
dents’ answers for the main concepts addressed in the
discipline. A confusion matrix is a form of visualiza-
tion in which the columns represent the instances’ ac-
tual category while each row represents the instances’
answered category. Since the activities contain mul-
tiple alternatives, they were categorized into four the-
matic groups based on their concepts, these groups
being: Artifacts (1), Epithelial Cells (2), Inflamma-
tions (3), and Lesions (4). The Artifacts group gath-
ers the alternatives for materials foreign to the cytol-
ogy sample, such as dye precipitate and bubbles. The
Epithelial Cells group gathers alternatives represent-
ing the cells collected from the cervical epithelium.
The Inflammations group gathers alternatives asso-
ciated with the cellular changes that indicate an in-
flammatory process associated with some infectious
agents. And Lesions group gathers the alternatives
representing the classifications for different changes
in cervical epithelial cells. Also, if a student answered
a wrong alternative but the alternative was in the same
group as the correct answer, it will be considered a
“hit” for this graph since the user had a small concep-
tual error.
In Figure 7a the confusion matrix for Scenario 1
is presented, and it is interesting to observe that users
confuse responses from category 1 with category 3.
However, the reverse process almost does not happen.
The results may indicate a learning effect during the
course span since the group 3 alternatives are content
from the middle of the course while the category 1 al-
ternatives are from the beginning. There is also some
confusion between category 2 and 3 alternatives, in-
flammations, and lesions.
Figure 7b presents the confusion matrix of the re-
sponses obtained for Scenario 2. Like Scenario 1,
there are also errors between categories 1 and 3, but
(a) Scenario 1.
(b) Scenario 2.
Figure 7: Confusion matrices for responses categories.
with a volume greater than occurred in the first sce-
nario. This may be a consequence of carrying out
the activities in two stages since, in this scenario, the
students had less exposure to the contents when they
were answering the first half of the activities (com-
pared to Scenario 1), which may have caused this
higher error rate. Similar to the first scenario, there
is also some confusion between category 2 and 3 al-
ternatives.
As categorized above, the response options were
generalized into four groups. However, the user may
have answered some alternative in the same category
as the correct answer, which marks the answer as in-
correct. The table 1 presents the hit and miss rates
within each category. Interestingly, there is a constant
error rate above 7% across all categories and scenar-
ios. Furthermore, in Scenario 2, there is a higher error
rate compared to Scenario 1.
ICEIS 2022 - 24th International Conference on Enterprise Information Systems
330

Table 1: Categories’ hit and miss rate.
Scenario 1 Scenario 2
Category Hits Miss Category Hits Miss
Artifacts 92.78% 7.22% Artifacts 89.04% 10.96%
Epithelial Cells 91.37% 8.63% Epithelial Cells 86.54% 13.46%
Inflammations 91.92% 8.08% Inflammations 90.91% 9.09%
Lesions 92.67% 7.33% Lesions 86.94% 13.02%
7 CONCLUSIONS
The COVID-19 pandemic has created the need to in-
corporate remote education experiences into the cer-
vical cytology discipline quickly. This proposal de-
veloped a framework that allowed students to interact
with images and subjects similar to those in a practi-
cal class. Also, we evaluated how different classroom
scenarios impacted student performance.
The data collected demonstrate that in Scenario
1 a better average performance of students was ob-
tained. This performance can be associated with
both the discipline’s methodology who performed in
less time with more condensed content, and students’
commitment since participation in the term contain-
ing Scenario 1 was optional. Also, it is important to
emphasize that the two scenarios present a difference
in the participants’ composition, motivations, and the
number of students in each scenario. So some differ-
ences in the performance are related to that.
The virtual environment allows the student to
choose what and when to do it. For example, he can
organize himself, focusing on more difficult content
(individualization of learning). Although the student
is not in a real laboratory, the diagnostic context is
covered and the situations created are very close to
routine. Another clear point in remote teaching is that
even if the laboratory does not have slides with a spe-
cific lesion, it is possible to create a repository with
different images from different locations and the most
varied lesions. Thus, it allows the student to see, de-
tect and learn in the widest possible way.
Finally, it is noteworthy that the external factors
also impact in the teaching-learning process (and con-
sequentially, their performance). Some of the exter-
nal factors include the time, the performance on other
subjects or disciplines studied parallel and personal
context.
Further experimental investigations are needed to
better estimate the impact of this learning model. One
improvement is using the system in more academic
periods to obtain more reliable data. Moreover, the
system can be improved to make it easier to access
and better interact with the different actors (students
and teachers) without impacting the model’s perfor-
mance.
ACKNOWLEDGMENTS
The authors would like to thank the Coordenac¸
˜
ao
de Aperfeic¸oamento de Pessoal de N
´
ıvel Superior
- Brasil (CAPES) - Finance Code 001, Fundac¸
˜
ao
de Amparo
`
a Pesquisa do Estado de Minas Gerais
(FAPEMIG), Conselho Nacional de Desenvolvimento
Cient
´
ıfico e Tecnol
´
ogico (CNPq) for supporting the
development of the present study. Also like to thanks
the Universidade Federal de Ouro Preto (UFOP),
the Center for Recognition and Inspection of Cells
(CRIC), the Extended Reality for Good Laboratory
(XR4Good) and the Laborat
´
orio Multiusu
´
arios de Mi-
croscopia Avanc¸ada e Microan
´
alise do N
´
ucleo de
Pesquisas em Ci
ˆ
encias Biol
´
ogicas (NUPEB) for also
supporting this research.
REFERENCES
Bahia, N. S., da Silva, W. R., Vianna, J. B., Rodrigues,
H. G., Silva, M. T. B., and Bacchi, R. R. (2019). O
uso das tdic’s como estrat
´
egia para aprendizagem em
morfologia microsc
´
opica. Inform
´
atica na educac¸
˜
ao:
teoria & pr
´
atica, 22(2).
Darici, D., Reissner, C., Brockhaus, J., and Missler, M.
(2021). Implementation of a fully digital histology
course in the anatomical teaching curriculum during
covid-19 pandemic. Annals of Anatomy-Anatomischer
Anzeiger, 236:151718.
Guiter, G. E., Sapia, S., Wright, A. I., Hutchins, G. G.,
and Arayssi, T. (2021). Development of a remote on-
line collaborative medical school pathology curricu-
lum with clinical correlations, across several interna-
tional sites, through the covid-19 pandemic. Medical
Science Educator, 31(2):549–556.
Guze, P. A. (2015). Using technology to meet the challenges
of medical education. Transactions of the American
clinical and climatological association, 126:260.
Hanna, M. G., Reuter, V. E., Ardon, O., Kim, D., Sirin-
trapun, S. J., Sch
¨
uffler, P. J., Busam, K. J., Sauter,
J. L., Brogi, E., Tan, L. K., et al. (2020). Validation
of a digital pathology system including remote review
during the covid-19 pandemic. Modern Pathology,
33(11):2115–2127.
Krasne, S., Hillman, J. D., Kellman, P. J., and Drake, T. A.
(2013). Applying perceptual and adaptive learning
techniques for teaching introductory histopathology.
Journal of pathology informatics, 4.
Maley, M. A., Harvey, J. R., Boer, W. B. d., Scott, N. W.,
and Arena, G. E. (2008). Addressing current problems
in teaching pathology to medical students: blended
learning. Medical teacher, 30(1):e1–e9.
Prensky, M. (2001). Digital natives, digital immigrants. on
the horizon. mcb university press. 9 (october).
Wiecha, J., Heyden, R., Sternthal, E., and Merialdi, M.
(2010). Learning in a virtual world: experience with
using second life for medical education. Journal of
medical Internet research, 12(1):e1.
Perceptions on the Use of an Online Tool in the Teaching-learning Process in Microscopy
331
